Abstract
We investigate hadron production and transverse hadron spectra in nucleus-nucleus collisions from 2 GeV to 21.3 TeV within two independent transport approaches (UrQMD and HSD) based on quark, diquark, string and hadronic degrees of freedom. The enhancement of pion production in central Au+Au (Pb+Pb) collisions relative to scaled collisions (the ’kink’) is described well by both approaches without involving a phase transition. However, the maximum in the ratio at 20 to 30 AGeV (the ’horn’) is missed by 40%. Also, at energies above 5 AGeV, the measured -spectra have a larger inverse slope than expected from the models. Thus the pressure generated by hadronic interactions in the transport models at high energies is too low. This finding suggests that the additional pressure - as expected from lattice QCD at finite quark chemical potential and temperature - might be generated by strong interactions in the early pre-hadronic/partonic phase of central heavy-ion collisions. Finally, we discuss the emergence of density perturbations in a first-order phase transition and why they might affect relative hadron multiplicities, collective flow, and hadron mean-free paths at decoupling. A minimum in the collective flow excitation function was discovered experimentally at 40 AGeV - such a behavior has been predicted long ago as signature for a first order phase transition.
Review of QGP signatures - ideas versus observables ††thanks: Supported by DFG, BMBF, GSI
1 Introduction
The phase transition from partonic degrees of freedom (quarks and gluons) to interacting hadrons is a central topic of modern high-energy physics. In order to understand the dynamics and relevant scales of this transition laboratory experiments under controlled conditions are presently performed with ultra-relativistic nucleus-nucleus collisions. Hadronic spectra and relative hadron abundancies from these experiments reflect important aspects of the dynamics in the hot and dense zone formed in the early phase of the reaction. Furthermore, as has been proposed early by Rafelski and Müller [1] the strangeness degree of freedom might play an important role in distinguishing hadronic and partonic dynamics.
In fact, estimates based on the Bjorken formula [2] for the energy density achieved in central Au+Au collisions suggest that the critical energy density for the formation of a quark-gluon plasma (QGP) is by far exceeded during a few fm/c in the initial phase of the collision at Relativistic Heavy Ion Collider (RHIC) energies [3], but sufficient energy densities ( 0.7-1 GeV/fm3 [4]) might already be achieved at Alternating Gradient Synchrotron (AGS) energies of 10 GeV [5, 6]. More recently, lattice QCD calculations at finite temperature and quark chemical potential [7] show a rapid increase of the thermodynamic pressure with temperature above the critical temperature for a phase transition to the QGP. The crucial question is, however, at what bombarding energies the conditions for the phase transition (or cross-over) might be fulfilled.
Presently, transverse mass (or momentum) spectra of hadrons are in the center of interest. It is experimentally observed that the transverse mass spectra of kaons at AGS and SPS energies show a substantial flattening or hardening in central Au+Au collisions relative to interactions (cf. Refs. [8, 9]). In order to quantify this effect, the spectra are often parametrised as:
| (1) |
where is the transverse mass and is the inverse slope parameter. This hardening of the spectra is commonly attributed to strong collective flow, which is absent in the or data.
The authors of Refs. [10] have proposed to interpret the approximately constant slopes above AGeV – the ’step’ – as an indication for a phase transition following an early suggestion by Van Hove [11]. This interpretation is also based on a rather sharp maximum in the ratio at 20 to 30 AGeV in central Au+Au (Pb+Pb) collisions (the ’horn’ [10]). However, it is presently not clear, if the statistical model assumptions invoked in Refs. [10] hold to be reliable.
We will demonstrate in this contribution that the pressure needed to generate a large collective flow – to explain the hard slopes of the spectra as well as the ’horn’ in the ratio – is not produced in the present models by the interactions of hadrons in the expansion phase of the hadronic fireball. In our studies we use two independent transport models that employ hadronic and string degrees of freedom, i.e., UrQMD (v. 1.3) [12, 13] and HSD [14, 15]. They take into account the formation and multiple rescattering of hadrons and thus dynamically describe the generation of pressure in the hadronic expansion phase. This involves also interactions of ’leading’ pre-hadrons that contain a valence quark (antiquark) from a ’hard’ collision (cf. Refs. [14, 16]).
The UrQMD transport approach [12, 13] includes all baryonic resonances up to masses of 2 GeV as well as mesonic resonances up to 1.9 GeV as tabulated by the Particle Data Group [17]. For hadronic continuum excitations a string model is used with hadron formation times in the order of 1-2 fm/c depending on the momentum and energy of the created hadron. In the HSD approach nucleons, ’s, N∗(1440), N∗(1535), , and hyperons, ’s, ’s and ’s as well as their antiparticles are included on the baryonic side whereas the and octet states are included in the mesonic sector. High energy inelastic hadron-hadron collisions in HSD are described by the FRITIOF string model [18] whereas low energy hadron-hadron collisions are modeled based on experimental cross sections. Both transport approaches reproduce the nucleon-nucleon, meson-nucleon and meson-meson cross section data in a wide kinematic range. We point out, that no explicit parton-parton scattering processes (beyond the interactions of ’leading’ quarks/diquarks) are included in the studies below contrary to the multi-phase transport model (AMPT) [19], which is currently employed from upper SPS to RHIC energies.
2 Hadron excitation functions and ratios
2.1 versus central reactions – the ’kink’
In order to explore the main physics from central reactions it is instructive to have a look at the various particle multiplicities relative to scaled collisions as a function of bombarding energy. For this aim we show in Fig. 1 the total multiplicities of and (i.e., the yields) from central Au+Au (at AGS) or Pb+Pb (at SPS) collisions (from UrQMD and HSD) in comparison to the scaled total multiplicities from collisions versus the kinetic energy per particle .
The general trend from both transport approaches is quite similar: we observe a slight absorption of pions at lower bombarding energy and a relative enhancement of pion production by rescattering in heavy-ion collisions above 10 AGeV. Kaons and antikaons from collisions are always enhanced in central reactions relative to scaled multiplicities, which is a consequence of strong final state interactions. Thus, the ’kink’ in the pion ratio as well as the enhancement might result from conventional hadronic final state interactions.
![[Uncaptioned image]](/html/nucl-th/0401031/assets/x1.png)
Figure 1: Total multiplicities of and (i.e., yields) from central Au+Au (at AGS) or Pb+Pb (at SPS) collisions in comparison to the total multiplicities from collisions (scaled by a factor 350/2) versus kinetic energy . The solid lines with full triangles and squares show the UrQMD (l.h.s.) and HSD results (r.h.s.) for collisions, respectively. The dotted lines with open triangles and squares correspond to the multiplicities calculated within UrQMD (l.h.s.) and HSD (r.h.s.). The figure is taken from Ref. [16].
2.2 Particle yields in central collisions of heavy nuclei
![[Uncaptioned image]](/html/nucl-th/0401031/assets/x2.png)
Figure 2: The excitation function of and yields from central Au+Au or Pb+Pb collisions in comparison to the experimental data from Refs. [20, 21, 22] (AGS), [23, 24, 25] (SPS) and [26, 27, 28] (RHIC) for midrapidity (left column) and rapidity integrated yields (right column). The solid lines with open squares show the results from HSD whereas the dashed lines with open triangles indicate the UrQMD calculations. The lower theoretical errorbars at RHIC energies correspond to the yields for 10% central events. The figure is taken from Ref. [29].
Fig. 2 shows the excitation function of and yields (midrapidity (l.h.s.) and rapidity integrated (r.h.s)) from central Au+Au (Pb+Pb) collisions in comparison to the experimental data. Note that all data from the NA49 Collaboration at 30 AGeV have to be considered as ’preliminary’. As can be seen from Fig. 2 the differences between the independent transport models are less than 20%. The maximum deviations between the models and the experimental data are less than %. In addition, a systematic analysis of the results from both models and experimental data for central nucleus-nucleus collisions from 2 to 160 GeV in Ref. [16] has shown that also the ’longitudinal’ rapidity distributions of protons, pions, kaons, antikaons and hyperons are quite similar in both models and in reasonable agreement with available data. The exception are the pion rapidity spectra at the highest AGS energy and lower SPS energies, which are overestimated by both models [16]. For a more detailed comparison of HSD and UrQMD calculations with experimental data at RHIC energies we refer the reader to Refs. [30, 31].
2.3 Particle ratios – the ’horn’
![[Uncaptioned image]](/html/nucl-th/0401031/assets/x3.png)
Figure 3: The excitation function of and ratios from 5% central (AGS energies, SPS at 160 AGeV and at RHIC energies), 7% central (20, 30, 40 and 80 AGeV), 10% central for at 160 AGeV Au+Au (AGS and RHIC) or Pb+Pb (SPS) collisions in comparison to the experimental data from Refs. [20, 22] (AGS), [23, 24, 25] (SPS) and [26, 27, 28] (RHIC) for midrapidity (left column) and rapidity integrated yields (right column). The solid lines with open squares show the results from HSD whereas the dashed lines with open triangles indicate the UrQMD calculations. The figure is taken from Ref. [29].
In Fig. 3 we present the excitation function of the particle ratios and from central Au+Au (Pb+Pb) collisions in comparison to experimental data. The deviations between the transport models and the data are most pronounced for the midrapidity ratios (left column) since the ratios are very sensitive to actual rapidity spectra. The ratio in UrQMD shows a maximum at 8 AGeV and then drops to a constant ratio of 0.11 at top SPS and RHIC energies. In the case of HSD a continuously rising ratio with bombarding energy is found for the midrapidity ratios which partly is due to a dip in the pion pseudo-rapidity distribution at RHIC energies (cf. Fig. 1 in Ref. [30]). The 4 ratio in HSD is roughly constant from top SPS to RHIC energies, however, larger than the ratio from UrQMD due to the lower amount of pion production in HSD essentially due to an energy-density cut of 1 GeV/fm3, which does not allow to form hadrons above this critical energy density [16] and a slightly higher yield (cf. Fig. 2). Nevertheless, the experimental maximum in the ratio is missed, which we address dominantly to the excess of pions in the transport codes rather than to missing strangeness production. Qualitatively, the same arguments - due to strangeness conservation - also hold for the ratio, where the pronounced experimental maxima are underestimated due to the excess of pions in the transport models at top AGS energies (for HSD) and above 5 AGeV (for UrQMD). Since the yields are well reproduced by both approaches (cf. Fig. 2) the deviations in the ratios at SPS and RHIC energies in UrQMD can be traced back to the excess of pions (see discussion above).
We stress that the maximum in the ratio is essentially due to a change from baryon to meson dominated dynamics with increasing bombarding energy. Similar arguments hold for the experimentally observed maxima in the ratio (cf. Ref. [32]). However, the ’horn’ in the ratio at 30 AGeV is not described by neither of our transport models.
3 Transverse mass spectra – the ’step’
We now focus on transverse mass spectra of pions and kaons/antikaons from central Au+Au (Pb+Pb) collisions from 2 GeV to 21.3 TeV and compare to recent data (cf. Ref. [33]). Without explicit representation we mention that the agreement between the transport calculations and the data for and for central C+C and Si+Si is quite satisfactory [33]; no obvious traces of ’new’ physics are visible. The situation, however, changes for central Au+Au (or Pb+Pb) collisions. Whereas at the lowest energy of 4 GeV the agreement between the transport approaches and the data is still acceptable, severe deviations are visible in the spectra at SPS energies of 30 and 160 GeV [33]. We note that the spectra are reasonably described at all energies while the inverse slope of the transverse mass spectra in Eq. (1) is underestimated severely by about the same amount in both transport approaches (within statistics). The increase of the inverse slopes in heavy-ion collisions with respect to collisions, which is generated by rescatterings of produced hadrons in the transport models, is small because the elastic meson-baryon scattering is strongly forward peaked and therefore gives little additional transverse momentum at midrapidity.
The question remains whether the underestimation of the slopes in the transverse mass spectra [33] might be due to conventional hadronic medium effects. In fact, the slopes of kaons and antikaons at SIS energies (1.5 to 2 GeV) were found to differ significantly [34]. As argued in [15] the different slopes could be traced back to repulsive kaon-nucleon potentials, which lead to a hardening of the spectra, and attractive antikaon-nucleon potentials, which lead to a softening of the spectra. However, the effect of such potentials was calculated within HSD and found to be of minor importance at AGS and SPS energies [15] since the meson densities are comparable to or even larger than the baryon densities at AGS energies and above. Additional self energy contributions stem from interactions with mesons; however, -wave kaon-pion interactions are weak due to chiral symmetry arguments and -wave interactions such as transitions are suppressed substantially by the approximately ’thermal’ pion spectrum [35].
Furthermore, we have pursued the idea of Refs. [36, 37] that the spectra could be hardened by string-string interactions, which increase the effective string tension and thus the probability to produce mesons at high [19, 37]. In order to estimate the largest possible effect of string-string interactions we have assumed that for two overlapping strings the string tension is increased by a factor of two, for three overlapping strings by a factor of three etc. Here the overlap of strings is defined geometrically assuming a transverse string radius , which according to the studies in Ref. [38] should be 0.25 fm. Based on these assumptions (and =0.25 fm), we find only a small increase of the inverse slope parameters at AGS energies, where the string densities are low. At 160 GeV the model gives a hardening of the spectra by about 15%, which, however, is still significantly less than the effect observed in the data.
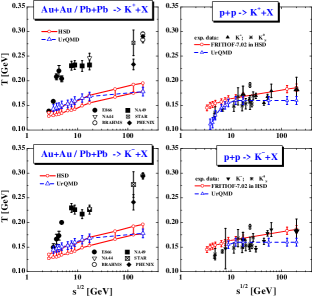
Our findings are summarized in Fig. 4, where the dependence of the inverse slope parameter (see Eq. (1)) on is shown and compared to the experimental data [8, 39] for central Au+Au (Pb+Pb) collisions (l.h.s.) and reactions (r.h.s.). The upper and lower solid lines (with open circles) on the l.h.s. in Fig. 4 correspond to results from HSD calculations, where the upper and lower limits are due to fitting the slope itself, an uncertainty in the repulsive -pion potential or the possible effect of string overlaps. The slope parameters from collisions (r.h.s. in Fig. 4) are seen to increase smoothly with energy both in the experiment (full squares) and in the HSD calculations (full lines with open circles). The UrQMD results for collisions are shown as open triangles connected by the solid line and systematically lower than the slopes from HSD at all energies.
We mention that the RQMD model [36] gives higher inverse slope parameters for kaons at AGS and SPS energies than HSD and UrQMD, which essentially might be traced back to the implementation of effective resonances with masses above 2 GeV as well as ’color ropes’ which decay isotropically in their rest frame [42]. A more detailed discussion of this issue is presented in Ref.[29].
4 Proton elliptic flow - the minimum
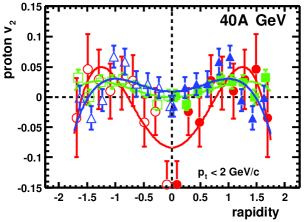
The NA49 Collaboration [44] has recently observed a vanishing elliptic flow of protons in Pb+Pb collisions at 40 AGeV at midrapidity for all centralities (Fig. 5). This observation of the apparent collapse of the collective flow is remarkable because the proton elliptic flow at top AGS (11 AGeV) [43] and top SPS energies (160 AGeV) [44] is non-zero for mid-central collisions and large for peripheral collisions. This experimental observation of a minimum of the collective flow excitation function has been predicted as a signature for a first order phase transition [45].
5 Thermodynamics in the plane
This still leaves us with the question of the origin of the rapid increase of the slopes with invariant energy for central Au+Au collisions at AGS energies and the constant slope at SPS energies (the ’step’), which is missed in both transport approaches. We recall that higher transverse particle momenta either arise from repulsive self energies – in mean-field dynamics – or from collisions, which reduce longitudinal momenta in favor of transverse momenta [5, 46]. As shown above in Fig. 4 conventional hadron self-energy effects and hadronic binary collisions are insufficient to describe the dramatic increase of the slopes as a function of . This indicates additional mechanisms for the generation of the pressure that is observed experimentally.
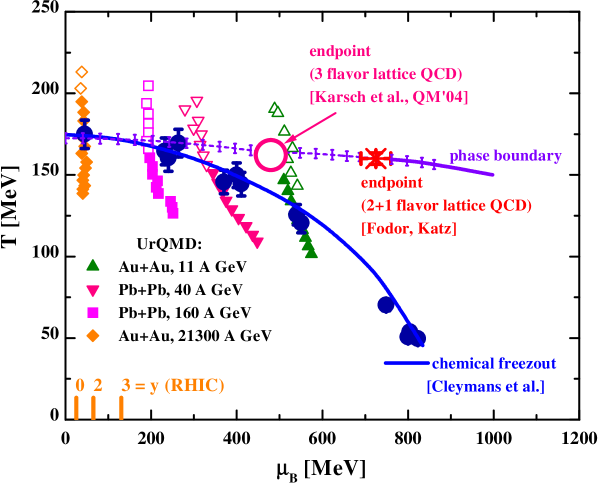
Here we propose that additional pre-hadronic/partonic degrees of freedom might be responsible for this effect already at 5 GeV. Our arguments are based on a comparison of the thermodynamic parameters and extracted from the transport models in the central overlap regime of Au+Au collisions [48] with the experimental systematics on chemical freeze-out configurations [47] in the plane. The solid line in Fig. 6 characterizes the universal chemical freeze-out line from Cleymans et al. [47] whereas the full dots with errorbars denote the ’experimental’ chemical freeze-out parameters - determined from the fits to the experimental yields - taken from Ref. [47]. The various symbols (in vertical sequence) stand for temperatures and chemical potentials extracted from UrQMD transport calculations in central Au+Au (Pb+Pb) collisions at 21.3 ATeV, 160, 40 and 11 AGeV [48] as a function of the reaction time (from top to bottom). The open symbols denote nonequilibrium configurations and correspond to parameters extracted from the transverse momentum distributions, whereas the full symbols denote configurations in approximate pressure equilibrium in longitudinal and transverse direction.
During the nonequilibrium phase (open symbols) the transport calculations show much higher temperatures (or energy densities) than the ’experimental’ chemical freeze-out configurations at all bombarding energies ( 11 AGeV). These numbers are also higher than the tri-critical endpoints extracted from lattice QCD calculations by Karsch et al. [49] (large open circle) and Fodor and Katz [7] (star). Though the QCD lattice calculations differ substantially in the value of for the critical endpoint, the critical temperature is in the range of 160 MeV in both calculations, while the energy density is in the order of 1 GeV/fm3 or even below. Nevertheless, this diagram shows that at RHIC energies one encounters more likely a cross-over between the different phases when stepping down in temperature during the expansion phase of the ’hot fireball’. This situation changes at lower SPS or AGS (as well as new GSI SIS-300) energies, where for sufficiently large chemical potentials the cross over should change to a first order transition [51], i.e., beyond the tri-critical point in the () plane. Nevertheless, Fig. 6 demonstrates that the transport calculations show temperatures (energy densities) well above the phase boundary (horizontal line with errorbars) in the very early phase of the collisions, where hadronic interactions practically yield no pressure, but pre-hadronic degrees of freedom should do. This argument is in line with the studies on elliptic flow at RHIC energies, that is underestimated by 30% at midrapidity in the HSD approach for all centralities [30]. Only strong early stage pre-hadronic interactions might cure this problem.
In Fig. 6 we also show the baryon chemical potential for different rapidity intervals at RHIC energies as obtained from a statistical model analysis by the BRAHMS Collaboration based on measured the antihadron to hadron yield ratios [50]. For midrapidity, , whereas for forward rapidities increases up to MeV at . Thus, the forward rapidity measurement allows to probe large at the same bombarding energies. Hence, at RHIC only a rather limited chemical potential range is accessible experimentally. To reach the probable first order phase transition region, the International Facility at GSI seems to be the right place to go.
6 Density perturbations from dynamical symmetry breaking
It is of great interest, of course, to investigate whether the above-mentioned observations could be due to a phase transition of strongly interacting matter. The natural effective theory for exploring the effects from phase transitions on the production and phase-space distribution of hadrons is hydrodynamics: the equation of state enters directly by closing the system of continuity equations for energy, momentum and charge conservation. Typically, first-order phase transitions are modelled by matching the pressure of the low-density massive (symmetry broken) phase to that of the high-density massless (symmetric) phase along a ‘phase boundary’ in the plane (cf. Fig. 6). On the phase transition line, the system is in a mixed state where both phases coexist and where their relative fractions are determined from Gibbs’s conditions of phase equilibrium. This construction assumes that the phase transition is a quasi-static, reversible process (entropy is conserved) near equilibrium. Entropy is produced only in the initial compression stage which ends with the formation of a locally equilibrated fireball of hot and dense matter which subsequently expands and cools.
The crossover from suppressed to increased pion production in central nuclear collisions relative to scaled collisions reflects the excess entropy produced at higher energies [52], as also seen in Fig. 1. Somewhat surprisingly though, the excitation function of entropy production turns out to be rather smooth, without exhibiting ‘discontinuities’ from crossing the phase boundary at some energy. Aside from some dynamical effects, the main reason for this behavior is that in baryon-rich matter the specific entropy is a smooth function of temperature without a pronounced ‘jump’ [52].
Since the entropy produced right at impact (on a time scale of order in the CM frame) increases smoothly with energy, all hadron abundance ratios will behave correspondingly and the sharp ‘horn’ in seen in the data can not be reproduced. This holds for typical hydro models with a first-order phase transition [52] as well as for hadronic transport models (see discussion above).
If early-stage entropy poduction can not account for the sharp peak of ratio then perhaps the phase transition back to the broken phase (which occurs later on after some cooling) can ? This might be possible indeed if one abandons the equilibrium phase transition based on the macroscopic Gibbs construction and, in turn, introduces a dynamical microscopic treatment of phase transitions into hydrodynamics. It is well-known that first-order phase transitions lead to inhomogeneities such as high-density ‘nuggets’, surrounded by low-density ‘voids’. Analogous effects are frequently discussed within the context of the QCD transition in the early universe, where inhomogeneities of the entropy (or baryon to photon ratio) might affect BBN. The usual mixed-phase construction applies on scales much larger than the size and separation of inhomogeneities, and on such scales the matter and entropy distributions appear smooth. On small scales however, for example in heavy-ion collisions, inhomogeneous density distributions have significant effects on observables which are non-linear functions of the density: take a large homogeneous system, split it in half, and move all baryons into one half, then let each half equilibrate. Suppose you can not measure the hadron multiplicities in each half separately, just the total. The obvious measurement, namely of baryon number, doesn’t reflect the presence of the high-density nugget because the total baryon number is the same as for the homogeneous distribution. However, the total yield of over the total yield of will be larger than for the homogeneous system ! This is because the ratio is enhanced in the high-density nugget by a much bigger factor than it is suppressed in the low-density half of the system. (Other hadrons like (multi-)strange baryons of course compensate the strangeness and are also more abundant than for the homogeneous system.) The effect diminishes rapidly when the entropy per (net) baryon becomes large, that is, in the meson-dominated high-energy regime.
![[Uncaptioned image]](/html/nucl-th/0401031/assets/x7.png)
Figure 7: Space-time evolution of the fluid energy density along the -axis at . The scale on the right specifies the energy density in units of nuclear matter density MeV/fm3.
To investigate the formation of inhomogeneities during the phase transition we solve for the coupled evolution of an order parameter field such as the chiral condensate and the thermalized matter fields [53]:
| (2) |
Here, is the energy-momentum tensor of the fluid, that of the classical modes of the chiral condensate, and is the effective potential obtained by integrating out the thermalized degrees of freedom. We focus first on energy-density inhomogeneities and present solutions of these coupled equations for vanishing baryon density [53]. As initial condition we chose a homogeneous energy density above the critical energy density for the transition to the broken phase. However, the condensate exhibits ‘primordial’ Gaussian fluctuations on length scales fm on top of a smoothly varying mean field. These fluctuations are then propagated through a first-order chiral phase transition and leave a rather inhomogeneous (energy-) density distribution in the wake of the transition, as seen in Fig. 7. Evidently, the scale for such fluctuations is not tiny and so it would not be appropriate to assume a homogeneous density distribution. On the other hand, they are too small to be resolved in rapidity space because the scale factor is large at times long after the initial impact. To resolve individual hot/dense spots would require a resolution better than one unit of rapidity, which is roughly equal to the thermal width of the local particle momentum distributions.
However, additional hints for the existence of large density inhomogeneities created in the course of the transition to the broken phase remain to be explored. (Inhomogeneities from fluctuations of particle production in the primary nucleon-nucleon collisions should be largely washed out until decoupling by hydrodynamic transport of matter due to pressure gradients, see e.g. [54].) Clearly, the yields of other hadron species depend non-linearly on the density as well, and their behavior has to be tested for consistency. Moreover, coordinate-space fluctuations of the energy-momentum tensor of matter produced by a phase transition are uncorrelated to the reaction plane and therefore should act to reduce out-of-plane collective flow () as compared to equilibrium hydrodynamics, cf. the discussion in [53]. Finally, Hanbury-Brown–Twiss correlations could provide valuable coordinate-space information on the regions from which particles are emitted. In this regard, note the stunning result of CERES [55] according to which pions decouple when their mean-free path is fm. This is inconceivable in standard equilibrium hydrodynamics without density perturbations because there particles decouple only when their mean-free path exceeds the scale of spatial homogeneity, which is about an order of magnitude larger [56]. The CERES analysis indicates that density (and perhaps velocity) gradients in coordinate space are 1/1 fm rather than 1/10 fm.
7 Conclusions
Summarizing this contribution, we point out that baryon stopping [57] and hadron production in central Au+Au (or Pb+Pb) collisions is quite well described in the independent transport approaches HSD and UrQMD. Also the ’longitudinal’ rapidity distributions of protons, pions, kaons, antikaons and hyperons are similar in both models and in reasonable agreement with available data. The exception are the pion rapidity spectra at the highest AGS energy and lower SPS energies, which are overestimated by both models [16]. As a consequence the HSD and UrQMD transport approaches underestimate the experimental maximum of the ratio (’horn’) at 20 to 30 AGeV. However, we point out that the maxima in the and ( ratios partly reflect a change from baryon to meson dominated dynamics with increasing bombarding energy.
We have found that the inverse slope parameters for mesons from the HSD and UrQMD transport models are practically independent of system size from up to central Pb+Pb collisions and show only a slight increase with collision energy, but no ’step’ in the transverse momentum slopes. The rapid increase of the inverse slope parameters of kaons for collisions of heavy nuclei (Au+Au) found experimentally in the AGS energy range, however, is not reproduced by neither model (see Fig. 4). Since the pion transverse mass spectra – which are hardly effected by collective flow – are described sufficiently well at all bombarding energies [29], the failure has to be attributed to a lack of pressure. This additional pressure should be generated in the early phase of the collision, where the ’transverse’ energy densities in the transport approaches are higher than the critical energy densities for a phase transition (or cross-over) to the QGP. The interesting finding of our analysis is, that pre-hadronic degrees of freedom might already play a substantial role in central Au+Au collisions at AGS energies above 5 GeV. The more astonishing is the experimentally observed collapse of the collective flow at 40 AGeV - such a behavior has been predicted as signature for a first order phase transition long ago.
References
- [1] J. Rafelski and B. Müller, Phys. Rev. Lett. 48 (1982) 1066.
- [2] J.D. Bjorken, Phys. Rev. D 27 1983 140.
- [3] Quark Matter 2002, Nucl. Phys. A 715 (2003) 1.
- [4] F. Karsch et al., Nucl. Phys. B 502 (2001) 321.
- [5] H. Stöcker and W. Greiner, Phys. Rep. 137 (1986) 277.
- [6] W. Cassing, E.L. Bratkovskaya, and S. Juchem, Nucl. Phys. A 674 (2000) 249.
- [7] Z. Fodor and S. D. Katz, JHEP 0203, 014 (2002); Z. Fodor, S. D. Katz, and K. K. Szabo, Phys. Lett. B 568, 73 (2003).
- [8] V. Friese et al., NA49 Collaboration, J. Phys. G 30 (2004) 119.
- [9] M. I. Gorenstein, M. Gaździcki, and K. Bugaev, Phys. Lett. B 567 (2003) 175.
- [10] M. Gaździcki and M. I. Gorenstein, Acta Phys. Polon. B 30 (1999) 2705.
- [11] L. Van Hove, Phys. Lett. B 118 (1982) 138.
- [12] S.A. Bass et al., Prog. Part. Nucl. Phys. 42 (1998) 255.
- [13] M. Bleicher et al., J. Phys. G 25 (1999) 1859.
- [14] J. Geiss, W. Cassing, and C. Greiner, Nucl. Phys. A 644 (1998) 107.
- [15] W. Cassing and E. L. Bratkovskaya, Phys. Rep. 308 (1999) 65.
- [16] H. Weber, E.L. Bratkovskaya, W. Cassing, and H. Stöcker, Phys. Rev. C 67 (2003) 014904.
- [17] K. Hagiwara et al., (Review of Particle Properties), Phys. Rev. D 66 (2002) 010001.
- [18] B. Andersson et al., Z. Phys. C 57 (1993) 485.
- [19] Z. W. Lin et al., Nucl. Phys. A 698 (2002) 375.
- [20] L. Ahle et al., E866 and E917 Collaboration, Phys. Lett. B 476 (2000) 1; ibid. 490 (2000) 53.
- [21] J. L. Klay et al., E895 Collaboration, Phys. Rev. C 68 (2003) 054905.
- [22] S. Ahmad et al., E891 Collaboration, Phys. Lett. B 382 (1996) 35; C. Pinkenburg et al., E866 Collaboration, Nucl. Phys. A 698 (2002) 495c.
- [23] S. V. Afanasiev et al., NA49 Collaboration, Phys. Rev. C 66 (2002) 054902.
- [24] A. Mischke et al., NA49 Collaboration, J. Phys. G. 28 (2002) 1761; Nucl. Phys. A 715 (2993) 453.
- [25] F. Antinori et al., WA97 Collaboration, Nucl. Phys. A 661 (1999) 130c.
- [26] D. Ouerdane et al., BRAHMS Collaboration, Nucl. Phys. A 715 (2003) 478; J. H. Lee et al., J. Phys. G 30 (2004) S85.
- [27] S. S. Adler et al., PHENIX Collaboration, preprint nucl-ex/0307010; preprint nucl-ex/0307022.
- [28] C. Adler et al., STAR Collaboration, preprint nucl-ex/0206008; O. Barannikova et al., Nucl. Phys. A 715 (2003) 458; K. Filimonov et al., preprint hep-ex/0306056.
- [29] E. L. Bratkovskaya et al., preprint nucl-th/0402026.
- [30] E. L. Bratkovskaya, W. Cassing and H. Stöcker, Phys. Rev. C 67 (2003) 054905.
- [31] S. Soff et al., Phys. Lett. B 551 (2003) 115.
- [32] K. Redlich, J. Cleymans, H. Oeschler, and A. Tounsi, Acta Phys. Polonica B 33 (2002) 1609.
- [33] E. L. Bratkovskaya, S. Soff, H. Stöcker, M. van Leeuwen, and W. Cassing, Phys. Rev. Lett. 92 (2004) 032302.
- [34] A. Förster et al., KaoS Collaboration, J. Phys. G 28 (2002) 2011.
- [35] B. V. Martemyanov et al., nucl-th/0212064.
- [36] H. Sorge, Phys. Rev. C 52 (1995) 3291.
- [37] S. Soff et al., Phys. Lett. B 471 (1999) 89.
- [38] J. Geiss et al., Phys. Lett. B 447 (1999) 31.
- [39] I. Kraus et al., NA49 Collaboration, J. Phys. G 30 (2004) 5583.
- [40] I.G. Bearden et al., NA44 Collaboration, preprint nucl-ex/0202019.
- [41] M. Kliemant, B. Lungwitz, and M. Gaździcki, preprint hep-ex/0308002.
- [42] H. van Hecke et al., Phys. Rev. Lett. 81 (1998) 5764.
- [43] H. Liu et al., E895 Collaboration, Phys. Rev. Lett. 84 (2000) 5488.
- [44] C. Alt et al., NA49 Collaboration, preprint nucl-ex/0303001, Phys. Rev. C, in press.
- [45] J. Hofmann, H. Stöcker, U. Heinz, W. Scheid, and W. Greiner, Phys. Rev. Lett. 36 (1976) 88.
- [46] W. Cassing and U. Mosel, Prog. Part. Nucl. Phys. 25, 235 (1990).
- [47] J. Cleymans and K. Redlich, Phys. Rev. C 60 (1999) 054908.
- [48] L. V. Bravina et al., Phys. Rev. C 60 (1999) 024904. Nucl. Phys. A 698 (2002) 383.
- [49] F. Karsch, talk given in Quark Matter 2004, Oakland, January 11-17, 2004; http://qm2004.lbl.gov
- [50] I. G. Bearden et al., BRAHMS Collaboration, Phys. Rev. Lett. 90 (2003) 102301.
- [51] E. V. Shuryak, Nucl. Phys. A 661 (1999) 119c.
- [52] M. Reiter et al., Nucl. Phys. A 643 (1998) 99.
- [53] K. Paech, H. Stöcker and A. Dumitru, Phys. Rev. C 68 (2003) 044907; K. Paech, preprint nucl-th/0308049.
- [54] M. Bleicher et al., Nucl. Phys. A 638 (1998) 391.
- [55] D. Adamova et al., CERES Collaboration, Phys. Rev. Lett. 90 (2003) 022301.
- [56] S. Soff, S. A. Bass and A. Dumitru, Phys. Rev. Lett. 86 (2001) 3981.
- [57] H. Weber, E.L. Bratkovskaya and H. Stöcker, Phys. Lett. B 545 (2002) 285.