Analysis of kaon spectra at SIS energies -
what remains from the KN potential?
111Supported by IN2P3/CNRS and GSI.
Abstract
We study the reaction Au+Au at 1.48 AGeV and analyze the influence of the KN optical potential on cm spectra and azimuthal distributions at mid-rapidity. We find a significant change of the yields but only slight changes in the shapes of the distributions when turning off the optical potential. However, the spectra show contributions from different reaction times, where early kaons contribute stronger to higher momenta and late kaons to lower momenta. Azimuthal distributions of the kaons at mid-rapidity show a strong centrality dependence. Their shape is influenced by the KN optical potential as well as by re-scattering.
1 Introduction
One key question in the analysis of sub-threshold kaon production is how to obtain information on the properties of strange mesons in dense nuclear matter. Especially the relation of the optical potential of and in nuclear medium to experimental observables like ratios, mesonic in-plane flow and azimuthal distribution of kaons is subject of vivid discussions, who have triggered a lot of activities on the experimental [1, 2, 3, 4, 5, 6, 7, 8] and theoretical side [9, 10, 11, 12, 13, 14, 15, 16].
In this article we study the production of in the reaction Au+Au at 1.48 AGeV which corresponds to recent experiments performed by the KaoS collaboration [8] and by the FOPI collaboration [5]. For this purpose we use the IQMD model [17, 18] where we have supplemented our standard simulation program by all relevant cross sections for kaon production and annihilation and a (density and momentum dependent) optical potential. For the latter we use a parametrization resulting from relativistic mean field calculations of Schaffner-Bielich [19]. Detailed description of our simulations can be found in [20, 21].
2 Time evolution of kaon production
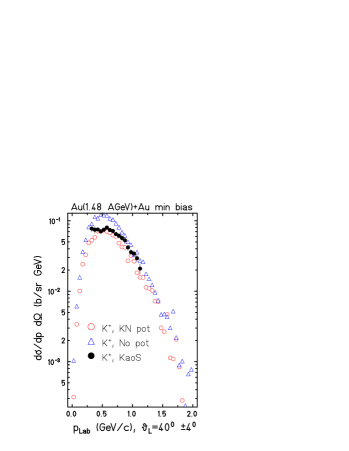
Right: Lab momentum spectra of a minimum bias Au(1.48 AGeV)+Au collision at with and without KN potentials compared to KaoS Data [8].
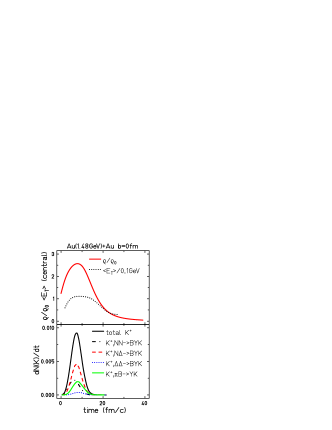
Let us first take a short view on the reaction dynamics of a central Au+Au collision at 1.48 AGeV. Figure 1 shows on top of the left hand side the time evolution of the normalized baryonic density (full line) taken at the center of the reaction in a b=0 fm collision. We see a maximum at about 8 fm/c after first contact (0 fm/c) yielding about 2.5 times ground state densities. In the same figure the dotted line shows the time evolution of the transverse energy at the center of the reaction which can be taken as an indicator of temperature. The transverse energies are divided by 0.1 GeV, thus a value of 1 corresponds to 100 MeV. We see a strong rise at very early times (up to about 4 fm/c) followed by a plateau and a moderate decrease. We see that are produced quite early (dashed line) and that the maximum of their production co-incidents with the maximum of baryonic densities.
The bottom part of the left hand side of Figure 1 shows the time evolution of the production and its decomposition into different channels. the different production channels. We see that are produced quite early (full black line ) and that the maximum of their production co-incidents with the maximum of baryonic densities. The different channels show a rather similar shape. The production of in direct collisions (dash-dotted line) acts earliest. It shows it maximum at about 4-6 fm/c, a time when the first violent reactions already took part and the transverse energy (left hand side, dotted line) reached its plateau. At that time first equilibration effects in the collision dynamics can be assumed. The production of in (dashed line) and collisions shows it maximum a little bit later. These collisions may dominantly take place at high densities in the stopped matter when some equilibrium is already reached. The channel (full gr. line) finally peaks at still later time due to the delayed freeze-out of pions.
3 Analysis of kaon spectra
If the kaons are produced at highest densities we may assume that they should carry a signature of the KN potentials. Indeed the penalty of the KN-potentials can clearly be seen in the absolute yield of the produced [10, 13, 14, 20, 22]. This penalty shifts the threshold for the production toward higher values and therefore reduces the production yields. That effect can be easily seen on the right hand side of figure 1 where we compare laboratory momentum spectra taken at laboratory angle taken from calculations with (open circles) and without (open triangles) KN optical potential to recent data taken by the KaoS collaboration (bullets) [8]. For our calculations we assumed a total cross section of 5.3 barn for minimum bias reactions. We see that a calculation without KN potentials yields higher yields than a calculation with potential. The data favor the calculation with KN potentials. Nevertheless it should be noted that incertitudes on unknown production cross sections like may alter this statement [22].
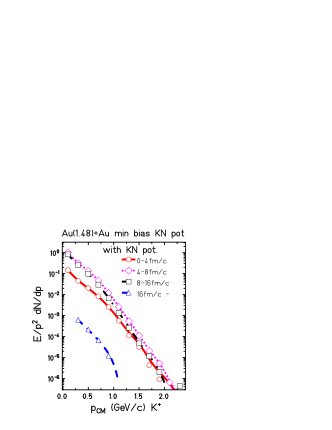
Right: Decomposition of kaon spectra into contributions of different reaction times.
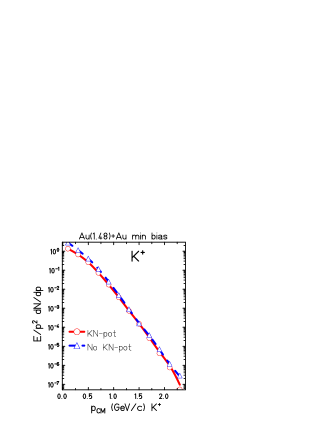
In order to allow the analysis of high energetic kaons let us now turn to center-of-mass momentum spectra in full as they are shown in figure 2. As we already stated, the penalty of the KN potentials shifts the threshold for the production toward higher values. Furthermore the produced kaons get less energy from the producing collision. However, this energy is regained in the expansion when the kaon leaves the nuclear medium. Therefore it is not very surprising to see on the left hand side of figure 2 that the spectrum of the in a calculation with potential (full line with circles) does not very much differ to that in a calculation without KN-potentials (dashed line with triangles), especially at high kaon momenta. Remember that the energy range shown in fig. 2 is larger than that shown on the right hand side of fig. 1. Only at low momenta we see a difference in the absolute values. This difference corresponds to kaons which are produced slightly above the threshold. In calculations without potentials they can be produced but they get little momentum for kinematic reasons. In calculations with potential their production is forbidden due to the enhanced threshold. For high kaon momenta re-scattering plays an important role. If we disable kaon re-scattering the values at high momenta drop down visibly.
The right hand side of figure 2 decomposes the spectrum obtained in a calculation with KN potentials into different time windows. The time-window 0-4 fm/c (full line with circles) corresponds to the violent non-equilibrated phase where density and transverse energy is rising (a temperature cannot be defined at that time). We see a strong contribution at high cm momenta. When we go to later time windows the spectra are becoming steeper. The window fm/c (dotted line with diamonds) corresponds to the time when equilibrium is starting but compression is still increasing. It shows the dominant contribution to the overall spectrum. In the expansion state (t=8-16fm/c, dash-dotted line with square) a strong contribution can be found at lower momenta. The very late kaons ( fm/c, dashed line with triangles) finally do not contribute significantly. This effect is coherent with the observation that re-scattering is important for the high momentum part of the spectrum. The later the kaons are produced, the less time and less density they find for doing re-scattering. The behavior “the later the production the steeper the spectra” is already known from the analysis of pion spectra [18] and from perturbative studies of kaon production [23]. It indicates that the detailed analysis of the spectra gives information on the time structure of the collision dynamics rather than on the KN potentials.
4 Azimuthal distributions at mid-rapidity
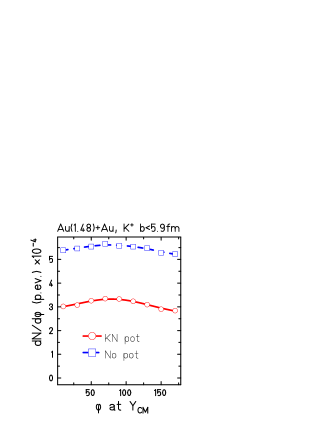
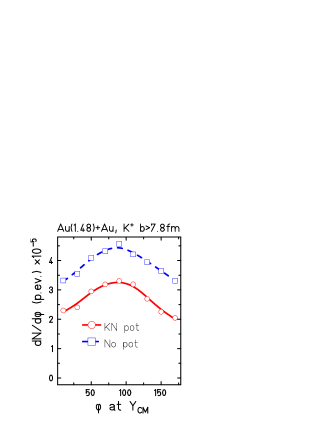
Let us now turn to the azimuthal distributions of kaons at mid-rapidity. For this observable an influence of medium effects has been reported by [15, 16]. Fig 3 shows the azimuthal distributions for calculations with KN potentials (full line with circles) and without KN potentials (dashed line with squares) for central (fm, left hand side) and peripheral (fm, right hand side) collisions. We see a strong dependence of the centrality. While central collisions only show a slight maximum at , i.e. out of the reaction plane, this maximum becomes a significant peak for peripheral collisions. This centrality dependence indicates the importance of the spectator matter for understanding this behavior. We have to discuss whether it is the potential or the re-scattering in matter which is important.
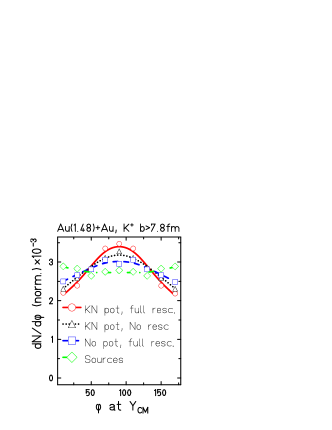
Right: Normalized azimuthal distributions of kaons at mid-rapidity calculated in peripheral collisions with and without potential and with and without re-scattering
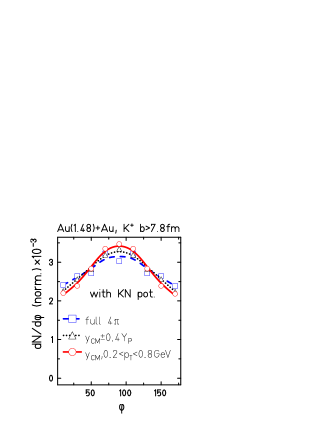
Concerning the potential we already see a large influence on the absolute yield of the distribution. In order to compare the shapes of the curves figure 4 shows normalized distributions for peripheral collisions. In central collisions the maximum of the distribution is less significant.
The left hand side of figure 4 shows the influence of different cuts which have been used by experiment[8]. The dashed line with squares shows the distribution integrated over all rapidities, the dotted line with triangles shows the distribution for and the full line with circles shows the effect of an additional application of a cut in transverse momentum GeV/cGeV/c. We see that each cut yields for slightly stronger peak of the squeeze. In the calculations of fig. 3 both cuts have been applied in order to allow a better comparison to experimental data of the KaoS collaboration [8].
The right hand side of figure 4 compares the azimuthal distribution at mid-rapidity (and with the given -cut of GeV/cGeV/c) obtained in a calculation with (full line with circles) and without (dashed line with squares) KN potentials, both using full re-scattering of the kaons. We see a visible increase of the peak when KN potentials are active. If we use a calculation with KN-potentials but disable re-scattering (dotted line with triangles) we see a slight decrease of the squeeze signal if compared to the calculation with full re-scattering (full line with circles). However, it should be kept in mind, that the influence of the cuts (left hand side) is of about the same size than the discussed effects.
If we now look for the sources, i.e. for the initial momenta of the kaons of the production the curve is flat or even slightly convex. A calculation without potential and re-scattering yields a similarly flat distribution. We conclude that the influence of the nuclear medium - as well potential as re-scattering - is important for explaining the squeeze, both effects contribute. Calculations of [15, 16] see a stronger contribution of the potentials which might perhaps be due to implementations of Lorentz-type forces.
5 Conclusion
We have analyzed azimuthal distributions and energy spectra of kaons in Au+Au collisions at 1.48 AGeV. We find that the KN potential interactions only show a significant influence on the absolute yield of the kaons, which is due to the penalty to be paid when producing a kaon in a dense medium. Concerning the spectra only slight effects in the low momentum range can be reported. However, the dynamics of the collision reaction affects the spectra. Early reactions contribute stronger at high momenta while late reactions contribute more to the low momentum part. Thus, when decomposing the spectra into different time windows we find the spectra become steeper the later the time window is placed. Concerning the azimuthal distributions at mid-rapidity we see a visible influence of the KN potential and of the re-scattering. The influence of re-scattering is in coherence with the centrality dependence of this observable showing a maximum signal at peripheral collisions. In conclusion the shape of spectra and azimuthal distributions give us information about the collision dynamics rather than on a KN optical potential.
References
References
- [1] R. Barth et al., (KaoS Collaboration), Phys. Rev. Lett. 78 (1997) 4007.
-
[2]
M. Menzel et al., (KaoS Collaboration),
Phys. Lett. B 495 (2000) 26;
M. Menzel, Dissertation, Universität Marburg, 2000. - [3] J.L. Ritman et al. (FOPI collaboration), Z. Phys. A352 (1995) 355
- [4] P. Crochet et al. (FOPI collaboration), Phys. Lett. B486 (2000) 6
- [5] A. Devismes et al. (FOPI collaboration), J. Phys. G 28 (2002) 1591.
- [6] F. Laue et al., (KaoS Collaboration), Phys. Rev. Lett. 82 (1999) 1640.
-
[7]
C. Sturm et al (KaoS Collaboration), Phys. Rev. Lett. 86
(2001) 39
C. Sturm et al (KaoS Collaboration), J. Phys. G 28 (2002) 1895 -
[8]
A. Förster et al., (KaoS Collaboration), submitted to Phys. Rev. Lett.
A. Förster et al., (KaoS Collaboration), these proceedings - [9] J. Schaffner-Bielich et al., Nucl Phys A669 (2000) 153;
-
[10]
W. Cassing et al., Nucl. Phys. A614 (1997) 415.
E. Bratkovskaja et al., Nucl. Phys. A622 (1997) 593
W. Cassing and E. Bratkovskaja, Phys. Rep 308 (1999) 65 - [11] J. Cleymans, H. Oeschler and K. Redlich, Phys. Lett. B485 (2000) 27.
- [12] H. Oeschler, J. Phys. G: 27 (2001) 1.
-
[13]
C.M. Ko, G.Q Li, J. Phys. G 22 (1996) 1673.
C.M. Ko, J. Phys. G 27 (2001) 327. -
[14]
C. Fuchs et al. Phys. Lett B 434 (1998) 245,
C. Fuchs et al. Phys. Rev. Lett 86 (2001) 1794
C. Fuchs et al. J. Phys. G 28 (2002) 1615 - [15] G Q Li et al. Phys. Lett B 381 (1996) 17
- [16] Z.S. Wang et al. Eur. Phys. J A 5 (1999) 275
- [17] C. Hartnack et al., Eur.Phys.J. A1 (1998) 151.
-
[18]
S.A. Bass et al. Phys. Rev. C50 (1994) 2167.
S.A. Bass et al. Phys. Rev. C51 (1995) 3343. - [19] J. Schaffner et al., Nucl. Phys. A625 (1997) 325.
-
[20]
C. Hartnack and J. Aichelin, Proc. Int.
Workshop XXVIII
on Gross prop. of Nucl. and Nucl. Excit., Hirschegg, January 2000
edt by M. Buballa, W. Nörenberg, B. Schäfer and J. Wambach
C. Hartnack and J. Aichelin, J. Phys. G 27 (2001) 571 - [21] C. Hartnack, H. Oeschler and J. Aichelin, Phys.Rev.Lett. 90 (2003) 102302.
- [22] C. Hartnack and J. Aichelin, J. Phys. G 28 (2002) 1649
- [23] C. Hartnack et al., Nucl. Phys. A580 (1994) 643.