Probing the shell valence structure underlying the B(E2) for N,Z40:
preponderance of the p-n interaction over the sub-shell closures.
Abstract
The very simple product of the number of particles by the number of holes appearing in the expression of the reduced B(E2: ) (B(E2)) transition probability of even-even nuclei obtained from the extension of the seniority scheme is used to analyze the experimental B(E2) values in the Cr up to Se isotopes. A new interpretation is given to the B(E2) measured in 68Ni and 70Zn. The B(E2) features of the even-even nuclei between Ni and Se with neutron number ranging from 28 up to 50 fit in with a global scenario involving p-n interaction. The evolution of the B(E2) curves presenting very large values is amazingly reproduced by very schematic binomial calculations.
pacs:
21.10.-k, 23.20.-g, 21.30.-x, 21.60.-n,27.40.+z,27.50.+e,27.60.+jI Introduction
Quite recently new experimental results have been obtained which
can contribute to answer the questions concerning the sub-shell closures. Coulomb excitation experiments performed
at Ganil have led to the measurement of the
B(E2: ) (B(E2)) reduced transition
probabilities for the first time in the neutron rich 68Ni
Sorlin et al. (2002a) and 70Zn nuclei Sorlin et al. (2002b). These data put
light on a different behavior of the B(E2) values in the Ni
isotopes, for N between 38 and 40, as compared to the
corresponding Zn isotopes: the B(E2) value decreases in the Ni
isotopes whilst it increases in the Zn ones. This has been
interpreted Sorlin et al. (2002b) putting forward, firstly, the change in
parity, which is brought by the orbital, hindering the
quadrupole E2 excitations (they preserve the parity symmetry), and
leading to the strong reduction of the B(E2) value of the spherical 68Ni Grawe and Lewitowicz (2001); Sorlin et al. (2002a)(the are the levels above N=40). Secondly, has been put forward
a greater deformation in the 70Zn isotope which allows to
escape from by giving access to a great amount of
other orbitals Sorlin et al. (2002b). But, it has been also mentioned that
in 68Ni neutron pair scattering plays an important role in
the B(E2) value Sorlin et al. (2002a). Such pair excitations ((2n)p-(2n)h
type) cannot be affected by the parity of the levels.
In a recent publication Langanke et al. (2003), the
value of the B(E2) lower in 68Ni than in the doubly-magic
56Ni nuclei is analyzed and explained, in 68Ni, by the
neutron pair scattering across the N=40 gap.
Therefore, when
looking to the B(E2) curves in the nuclei of this region, the
decrease of the B(E2) between the 66Ni and68Ni represents
a difference not only with the Zn isotopes, but with all their
neighbors. The B(E2) value between N=38 and 40 increases not only in
the Zn, but also in the Ge and in the Se isotopic chains, with in
addition for the B(E2) curves of the Zn and Se isotopes a minimum at
N=38.
Nowadays, the region of the Ni isotopes is then the subject
of several studies. A new experiment on Coulomb excitation of the
neutron rich 70Ni and 72Zn isotopes has just been
performed at Ganil Sorlin (2002). Another experiment on 70Ni
will be performed at REX-ISOLDE Mayet (2002). But already,
without these forthcoming results, the great amount of measured
B(E2) values makes possible systematical analyzes including nuclei
of the stability valley as well as many neutron rich nuclei. In
this paper, from such a work we propose a global interpretation of
the whole region surrounding , and new clues to
explain the difference between Ni and Zn isotopes.
The
B(E2) value is correlated to the possibilities to perform
excitations leading from the single-particle level scheme of the
to a state. So, very low B(E2) values are obtained for
nuclei with a closed shell since any excitation has to overcome
the gap. And, inversely, high values are reached at mid-shell
where the number of valence particles is maximal with respect to
the number of free levels, then available, for their excitations.
Consequently, in a very phenomenological approach, we propose to
analyze the B(E2) curves for nuclei having numbers of nucleons
ranging between 28 and 50 in terms of the underlying valence
space. In this approach, some of the B(E2) curves of these nuclei
appear to be consistent with a sub-shell structure inside the
28-50 major shell for both nucleon species, some with only one
sub-shell closure and some without any sub-shell closure. In the
Ni isotopes, due to the Z=28 gap, the B(E2) values reveals a complex
single-particle level scheme of the neutron valence space. The
part played by the p-n interaction in the onset and in the number
of sub-shell closures in the 28-50 major shells felt by the B(E2) is
discussed.
II A simple formula for B(E2)
The simplest formula relating the B(E2) transition probability to the number of elementary excitations is provided by the seniority scheme. In that scheme, assuming the N valence particles in a single j-shell configuration (the single j-shell 1f7/2 for example), the E2 transition takes place between a =0 seniority state (the N particles are all paired) and a =2 seniority state (i.e. with one ”broken” or aligned pair)Talmi (1993). The B(E2) is then expressed as :
| (1) |
and it can be shown Ring and Schuck (1980) that :
| (2) |
with .
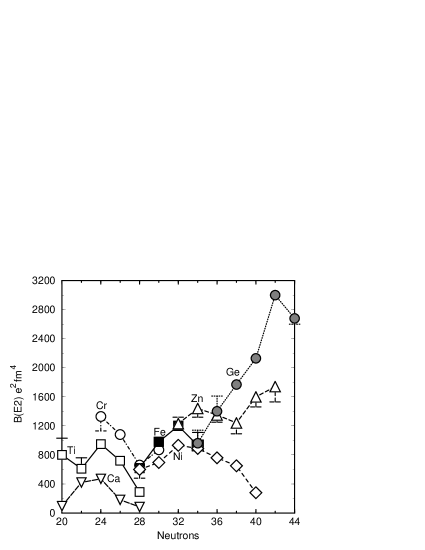
The right hand side of (2) is nothing but the product of the number of pairs of particles () by the number of pairs of holes (). This product gives, as a function of N, a bell-shaped curve, symmetrical around the maximum at N = /2, with two minima at N=0 and N=. From such a bell-shaped curve one can thus deduce , the beginning and the end of a single j-shell. The bell-shaped profile of the B(E2) is also observed in nuclei for which the valence shell extends over several single j-shells. The B(E2) curve of the Ni isotopes, reported in fig.1, exhibits such a profile when, even under the assumption of a sub-shell closure at N=40, the neutron valence space of the 58-68Ni isotopes includes at least two single j-shells, the 1f5/2 and the 2p3/2 one. Moreover these different j-shells seem, in first approximation, to have the same weights in the B(E2) values. Indeed the bell-shaped profile for the Ni isotopes appears even more regular than the one obtained for the Ca isotopic chain, which is one of the textbook case for the (single j-shell) seniority model Casten (1990); Talmi (1993). Following this constatation, and in order to treat the case of nuclei with complex valence shell, we extend the single j-shell formula (2) by replacing by , sum of the over the different j-shells, and without, as in the quasi-spin formalism, any weighting. We obtain for B(E2)approx in case of a complex valence shell:
| B(E2)approx | (3) | |||
| (4) |
with .
Such an extension of the single j-shell case to a more complex
valence shell, through the quasi-spin formalism or the generalized
seniority one, is the basis of the boson models Iachello (1978) which
allow a description of collective states. When the extension is
done through the generalized seniority, different weights are
assumed for the different j-shells. This appears to be essential
to reproduce the level spacing of the 58-66Ni isotopes
Talmi (1993). In this respect our approach can be found
over-simple. However, our aim is not to reproduce any values but
to analyze the B(E2) curves in a very phenomenological way using as
a reference the simplest model
calculations.
In that approach, the bell-shaped curve of the fig.1
can be understood as the sign of the conservation of the valence
space bulk structure (two gaps fixing the number of levels
confined between them) along an isotopic chain. The lower gap, in
particular, must be preserved even with a complete filling (up to
the upper gap) of the valence shell. Indeed, such a symmetrical
behavior implies that the values taken by along a half
of the curve (with respect to the mid-shell) are taken
symmetrically by along the other half of the curve. The
number of levels must then be constant along the isotopic chain.
Indeed, as soon as the lower gap (the upper respectively) would
disappear, the levels of the shell which were below the gap (above
resp.) would enter in the valence space. The levels which were
below the lower gap being occupied, the number would
be increased by the disappearance of the lower gap. The levels
which were above the upper gap being unoccupied, this is the
number which would be increased by the disappearance of
the upper gap. The disappearance of any of the two gaps
surrounding the shell, will then immediately and strongly induce
the increase of the product .
Reciprocally, in such a model, any sharp discontinuity
of a B(E2) curve has to be interpreted as such a change in the
valence space, as observed at the end of a valence shell. In
fig.1 the increase of the B(E2) curve of the Zn
isotopes from N=38 could be considered as such a discontinuity.
But it has been interpreted by the onset of deformation in
70Zn Sorlin et al. (2002b) which can also change the number of levels
of the valence space. It stays to determine if a change of
deformation can lead to such a discontinuity. In this aim, in the
following section, we will study for all nuclei having N or Z
comprised between 8 and 52 (and some are well-known deformed
nuclei), the rate of the increase (or of the decrease) of the
experimental B(E2) values between two consecutive isotones (or
isotopes) by computing their ratio.
III Ratios of experimental B(E2) values
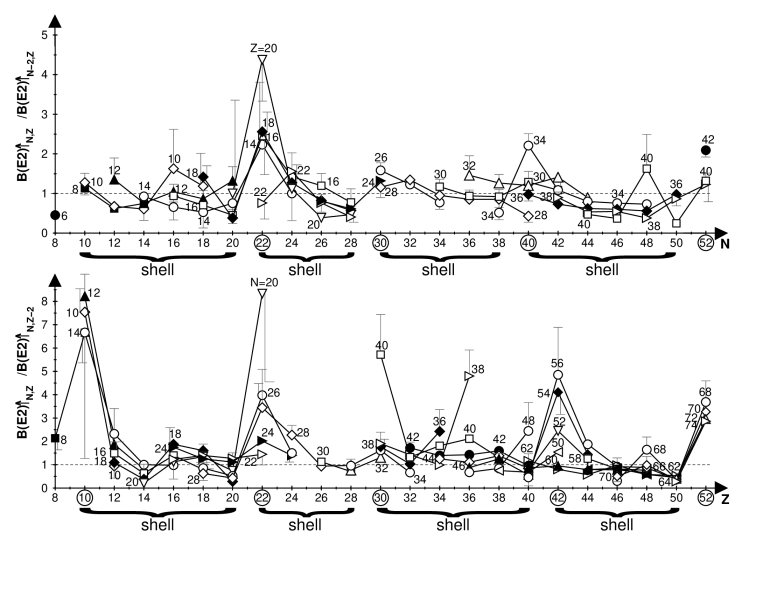
Lower part: For isotonic chains, N ranging from 8 to 52, ratios of measured B(E2)/B(E2) values as a function of proton number. The B(E2) values ar taken from Raman et al. (2001). The shells are explicitly located. For sake of legibility only a half of the error bars, and when they are larger than the symbols, are reported with grey lines.
In fig.2 are reported, at given N, for the upper
part of the picture (and at given Z for the lower part), the
ratios of the experimental B(E2) values of two consecutive nuclei :
B(E2)/B(E2).
One
can note that :
i) The behavior of the B(E2) , increasing up to the
maximum at mid-shell then decreasing within a bell-shaped profile,
induces parabola-like curves for the ratio of two consecutive B(E2) values, starting from ratio values well above 1.0 ending with
values below 1.0 at the end of a shell.
ii) Due to the expression of the ratio, the shell closure located
at a given particle number N or Z has repercussions on the ratios
at N+2 (or Z+2) (i.e. at 22 for a shell closure at 20, 30 for a
shell closure at 28….).
iii) The (sub)-shell closures induce a mean increase and a
dispersion of the values of the ratios. This can be seen at 22,
30, 52. For the sub-shell closure around 40 this is also true, but
the effect is at 42 for the protons and 40 for the neutrons. The
sub-shell closure is then located by the ratios of experimental
B(E2) values at 38 in neutrons and 40 in protons.
iv) Different curves are obtained in a neutron (proton resp.)
shell according to the different Z (N resp.) values. This
indicates that the protons and the neutrons do not mainly
contribute to the B(E2) value by way of a product. In the next
sections we will take into account protons and neutrons by summing
their contributions.
In order to determine in what extent the increase of B(E2) value is sensitive to the increase (or decrease) of deformation, we can examine some of the curves of ratios corresponding to isotopic series which are well known for their variation of deformation. Isotope shift measurements Keim et al. (1995) have shown that the deformations in the Kr (Z=36) and Sr (Z=38) isotopes are nearly identical from N=38 up to 58. From N=40 up to 50, they decrease from their maximal deformation, =0.4, to a small deformation, 0.15 Keim et al. (1995). This change of deformation, large but progressive, has no particular effect on the B(E2) ratios obtained for the [40-52] neutron valence shell and reported in the upper part of fig.2. The curves for the Kr and Sr isotopes are, as a function of N, regular compared to what is observed for the [28-40] proton valence shell (lower part of this figure) and the values taken along these curves are comparable to the ones obtained for the [30-38] neutron valence shell. One has to conclude that the changes of deformation in the Kr as well as in the Sr isotopes do not lead to irregularities in the evolution of the B(E2) values between two of their consecutive isotopes. The increase (or decrease) of their B(E2) values, from N=42 up to 48, are not exceeding the one observed between two consecutive points in a bell-shaped B(E2) curve.
Another example is provided by the Ge isotopes the shape instability of which is known Chuu et al. (1993) : transitions from a weakly deformed (oblate Ardouin et al. (1975)) 68Ge36, to the nearly spherical 70Ge38 Ardouin et al. (1975, 1978); Kumar (1978), then back to a weakly deformed nucleus (oblate Ardouin et al. (1975); Kumar (1978)) up to, at N=44 and 46, prolate deformation according to Ardouin et al. (1975) or weakly oblate according to Ardouin et al. (1978). Moreover shape coexistence is a common phenomenon in these isotopes, it has been studied in 68Ge36 de Lima et al. (1981); Chatuverdi et al. (1991); Hermkens et al. (1992), as well as in the 70,72,74Ge38,40,42 Ronnigen et al. (1976); Kumar (1978). Despite this rather complex situation, the curve of the B(E2) ratio obtained for the Ge isotopes is very regular. In fact, for N38, the variation with N of the B(E2) ratios obtained for the Ge, is very similar to the Zn and the Ni ones, and for N40 up to 44, to the variation in the Kr and Sr isotopes. However, below N=40, one can note that the distance between the Ge (Z=32) curve and the Zn (Z=30) one, clearly greater than that between the Zn and Ni (Z=28) curves –very close together–, is nearly constant (or slightly decreasing). Such a difference, nearly constant with N (at least without distortion of the curve), is more probably the expression of a non linearity in the proton contribution when going to the Ge isotopes, the same number of protons separating the Ge from the Zn isotopes and the Zn from the Ni isotopes. One can also note that above N=40, the distance separating the curve of the Ge from the Se (Z=34) curve becomes normal; these different distances will find an interpretation in the next section. Concerning the relation between the discontinuity of a B(E2) curve and a change in deformation, the Ge isotopes lead to the same result as the Kr and Sr isotopes, their changes in deformation do not induce irregularities in their B(E2) ratios. Assuming a larger, and nearly constant, proton contribution to the Ge B(E2) values, the increase (or decrease) of these B(E2) values follow the one observed between two consecutive points in a bell-shaped B(E2) curve.
At the opposite of these smooth behaviors, the curve of the B(E2) ratios obtained for Z=40 (Zr isotopes) presents a strong irregularity at N=48, such as, in the lower part of the fig.2, the irregularity of the N=38 curve at Z=36. The first case corresponds to the ratio of the 88Zr B(E2) value over the 86Zr one, which is very low. The low-lying levels of 86Zr have been interpreted as individual-particle excitations of relatively few particles (with some vibrational collectivity) Warburton et al. (1985); Kaye et al. (1998). This interpretation is supported by Hartree-Fock-Bogoliubov calculations predicting a spherical shape for the vacuum configuration in this nucleus Kaye et al. (1998). Unfortunately, no isotope shift experiments have been performed for the Zr neutron deficient isotopes, and no direct (independent from the B(E2) one) data are available for deformation of these two nuclei. The second irregular point (at Z=36 in the N=38 curve of the lower part of fig.2) involves the B(E2) value of 74Kr as numerator and of 72Se as denominator. The isotope shift measurements Keim et al. (1995) previously mentioned lead to assign a large deformation (0.4) to 74Kr. No such measurements are available for the 72Se isotope, but lifetime measurements lead to a deformation of 0.18 Lieb and Kolata (1977) for the ground state band which is interpreted as vibrational up to I=6 Lieb and Kolata (1977); Heese et al. (1996). Moreover this nucleus is known to exhibit a shape coexistence Hamilton et al. (1974) between the ground state band and the low-lying excited one having 0.31. It is worth noting that this phenomenon has been related to the competition between the shell gaps Chatuverdi et al. (1991); Chandler et al. (2000) appearing in the mean field at nucleon numbers 34, 36 (oblate), 34,38 (prolate), and 40 (spherical) Ragnarsson et al. (1978); Nazarewicz et al. (1985); et al. (1985). These gaps can induce the irregular behavior, at Z=34,36 and 40, in the N=36-40 isotonic curves reported in the lower part of fig.2. This irregular behavior is not only characterized by the high values of the ratios obtained at these Z values, but also in the non- parallelism between the different curves in the Z=34-40 range as compared to the different isotopic curves (upper part of the same figure) between N=34 and 40. This behavior and the B(E2) values are comparable to what is observed at the (sub)-shell closures. It is worth recalling that in the Ge isotopes, the proton number (Z=32) of which does not exactly correspond to one of the previous gaps, the shape coexistence phenomenon, for example in 68Ge Chatuverdi et al. (1991), does not induce any irregularity at N=36 in the curve. It seems that these gaps are effective when both protons and neutrons correspond to 34, 36, 38 or 40. Another particle numbers which seem to induce such a reinforcement in fig.2 are 40, 48 (and 68).
In conclusion it appears that the ratio of the B(E2) of two consecutive even-even isotopes (resp. isotones) is very sensitive to the (sub)-shell closure, to neutron or proton gaps. Following, the ratio can appear to depend on the deformation changes when these changes are induced by gaps. From this result it seems difficult to incriminate only an increase of deformation to explain the discontinuity of the B(E2) curve at N=38 for the Zn isotopes. The latter appear to highlight a N=38 gap that the Ni isotopes do not feel. Between N=38 and 40, the evolution of the B(E2) in the Ni isotopes, with the decrease for 68Ni, is then stranger than the evolution in the Zn isotopes. Indeed, the B(E2) value increases between N=38 and 40 not only in the Zn, but also in the Ge and in the Se isotopes (at N=40 their B(E2) ratios are greater than 1.0 as it can be seen in the upper part of the fig.2).
The deformation being insufficient to explain this difference, we will explore the track of the valence space change. Firstly, in order to get other criteria than the increase or the decrease of a B(E2) curve to sign a change of valence space, we will analyze the results of calculations performed for various valence spaces coming into play for nucleon numbers ranging from 20 up to 50. This is presented in the next section. Then, we will use these criteria to examine the experimental curves of nuclei having neutron and proton numbers comprised between 20 and 50.
IV Results of calculations
As mentioned in sec.III we take into account both type of particles by summing their contribution. The formula we use in the calculations is then:
| (5) |
where p stands for protons and n for neutrons.
For nucleon number ranging between 20 and 28, the only possible valence space is the single-j shell . For nucleon number above 28, there are four possible combinations of proton and neutron valence spaces: for each type of nucleon, two cases of valence space have to be considered, either the complete 28-50 major shell (this gives for protons and for neutrons), either a sub-shell resulting from a sub-shell closure located, accordingly to the observations of the previous section, at N=38 for neutrons and at Z=40 for protons. The proton sub-shell closure leads to two sub-shells, which have for Z below 40 and for Z above, and the neutrons sub-shell closure gives two neutron sub-shells, one having for N below 38 and the other for N above.
Except the different localization of the sub-shell closure, the results obtained as a function of N or as a function of Z lead to the same criteria for pointing out a change in the valence space. In this section we only present calculated B(E2)approx curves as a function of N and, for sake of legibility, for only a few proton number values. But at least, for each combination of proton and neutron valence spaces, we present the curves of minimal and maximal magnitude labelled by the proton number used for their calculations.
In fig.3, for the lower N values (20 N 32) the curves reported in dotted lines have been calculated for proton number below 28. The corresponding proton valence space is the single-j shell (), but the neutron valence space is either the single j-shell () when N28, or a sub-shell ranging for N28 (). These curves are specified by Z and N 20-28 or N s-s . For N28 (and up to 50), the calculations corresponding to the four cases of valence have been performed, one has considered proton numbers from 28 up to 40 (in the case of proton sub-shell closure, only the lower sub-shell with comes into play).
In fig.3 at N=38 from the bottom to the top one
finds the curves obtained assuming:
1) a proton sub-shell closure and a neutron sub-shell closure
(Z and N s-s )
2) the 28-50 major shell in protons and a sub-shell closure in
neutrons (Z MS, N s-s ). The curve obtained for Z=28 is, in
the figure, merged with the Z=28 one of the Z and N s-s curves.
3) a proton sub-shell closure and the neutron major shell (Z s-s, N MS ).
4) the major shell in protons and in neutrons ( Z and N
MS ). The curve obtained for Z=28 is, in the figure, merged with
the Z=28 one of the Z s-s, N MS curves.

Several main features, related to the size of the neutron or of
the proton valence space, appear from the analysis of the
fig.3:
i) The presence of a sub-shell closure at N=38 induces a minimum
in the B(E2)approx curves, as do the shell-closures at 20, 28 and 50. In
case of a N=38 sub-shell closure one expects then an increase in
the N=38-44 range. On the contrary, the curves calculated with a
neutron major shell assumption, decrease in this range.
ii) The position of the maximum of each curve depends on the
neutron valence space. Since the maximal contribution of
is at mid-valence shell, it is at
N=38-40 in case of a major shell for neutrons valence, at N=24 for
a single-j shell, at N=32-34 for the lowest neutron
sub-shell resulting from a N=38 closure, and at N=44 for the
highest neutron sub-shell.
iii) The spacing between the curves and the amplitude, increase
with the size of the proton valence space. One can see the greater
spacing between the different curves drawn in long-dashed lines,
obtained assuming a major shell in protons and a sub-shell in
neutrons, as compared to the curves in short-dashed lines obtained
with a sub-shell in protons and a sub-shell in neutrons. On the
contrary, one observes identical spacings between the curves when
calculated with a same proton valence space. A same distance
separates the curve labelled 28,40 from the one labelled 34 in
short-dashed lines or in dot-dashed lines, all obtained with a
proton sub-shell but with a different neutrons valence space.
(This is easier to see at N=50 where the dot-dashed curves are
joined with the short-dashed ones.) There is also a same distance
between the curves labelled 30 and the ones labelled 38, 40 drawn
in long-dashed lines or in
solid lines, obtained with the proton major shell.
iv) The magnitude reached by the various curves depends on the
total valence space (protons plus neutrons), it increases with the
size of the total valence space : the curves obtained with a
major shell for both protons and neutrons (solid lines) reach the
highest magnitude, then one finds the curves corresponding to a
major shell for the valence space of one species and a sub-shell
for the other species (dot-dashed and long-dashed lines), and
finally comes the curves obtained with small valence space for
both species, sub-shell or the single j-shell
(short-dashed and dotted lines). So, three different magnitudes
are reached in fig.3.
v) The order, in which the curves corresponding to different Z
values appear, depends only on the proton valence space. The
maximal proton contribution being obtained at the proton
mid-valence, the highest curve is obtained for Z=38 and 40 in
calculations performed with a proton major shell and at Z=34 for a
28-40 proton sub-shell. Moreover, and this will be used in the
following, one can note that in this latter case the Z=32,36
curves are under the Z=34 one.
Using these features as criteria determining the valence space size,
we propose, in the next section, to analyze the experimental B(E2) curves.
V Analysis of the experimental B(E2) curves
In fig.4 are reported as a function of N the experimental B(E2) values for nuclei with Z=36, 38 and 40. In fig.5 are reported the B(E2) measured in nuclei with 20Z34. In both figures, the most relevant theoretical curves of fig.3 are reported using a scale giving 100 e2fm4 per unit of . This scaling factor (the value at the origin is zero) has been chosen in order to reproduce the B(E2) curve of the Ca isotopes for which only the single j-shell plays a role in protons as well as in neutrons. Starting from this, we can only discuss relative magnitudes or relative amplitudes. In order to pass easier from one figure to the other which have different vertical scales, we have drawn in fig.4 and in fig.5, with solid and dot-dashed lines, the two highest Z=34 calculated curves .
Before going further, let us make a remark on the relative underestimation of some experimental values by the calculations in fig.4. The highest experimental values reported are well above the highest calculated ones obtained assuming the largest possible valence spaces for particle numbers around 40 (28-50 major shells). Nevertheless, for N42, in particular from N=44, the calculations have the good relative order of magnitude as compared to the experimental values. In most cases, the calculations are then in agreement with the experiment. In fact, these features (good agreement for the low experimental values and underestimation of the few highest values) reflect mainly a large difference of the shapes between the calculated curves and some of the experimental ones, and exclude a systematical effect which could come from the seniority. The shape difference will be detailed in the section.VIII. The tendency to the underestimation of the highest experimental values of an isotopic chain by the calculations can be used as a criteria to exclude some combinations of the proton and neutron valence spaces : those overestimating all the experimental values, or those underestimating all the experimental values.
We will now proceed to the analysis of the figures using: the order of magnitude, the position in N of the maxima, the existence or not of a minimum at N=38, the order of the curves corresponding to different Z values, the spacing between the curves, the underestimation of some experimental values and the shape of the curves.
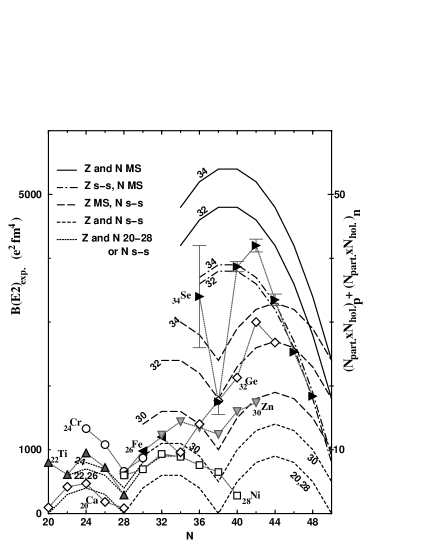
As the calculated curves, the experimental B(E2) curves reported in figs.4 and 5 present three orders of magnitude : the 36Kr, 38Sr and 40Zr isotopes reported in fig.4 exhibit the highest values; the Se, Ge, Zn isotopes reported in fig.5 reach the intermediate magnitude; the Ni, Fe, Ti and Ca isotopes lie at the lowest magnitude.
In fig.4, as obtained in calculations with a neutron major shell, the experimental curves have a maximum below N=44 : at N=38 for Kr, 40 or below for Sr and N42 for Zr, from which they decrease continuously up to N=50. On the contrary, in fig.5 experimentally there are two regions for a maximum : near N=42 for Se, Ge, and probably Zn; at N=32-34 for Ni, 34 for Zn and probably Se. Between these two regions there is, for nearly all the isotopic series, an increase between N=38-42 and even a minimum at N=38 in Se, Zn. The decrease between N=38-42 in the Ni isotopes appears to be nothing but only one exception. Except this decrease, the latter features of fig.5 are in agreement with the characteristics of the calculated curves assuming a neutron sub-shell closure. In the range N=20-28, the experimental curves have a maximum at N=24 in Ca, Ti and probably in Cr, in fact they follow pretty well the calculated curves.
In fig.4 for N44, the order of the
experimental curves as the spacings between them, are similar to
the ones obtained with the assumption of a proton major-shell
(solid lines). The 38Sr and 40Zr B(E2) curves are very
close together and above the 36Kr one. All these curves lie
above the ones of fig.5, in particular above the
34Se one. For N46 in fig.4, one can note
some inversions in the order of the experimental curves which
afterwards follow the order corresponding to a sub-shell closure
in protons (dot-dashed curves). In fig.5, the order
of the experimental Ca, Ti and Cr curves is in agrement with the
one obtain in the calculations. For the light nuclei of
fig.5, the calculated spacings between the Ca and
the Ti, and between the Cr and the Fe curves are in agreement with
the experimental ones. For the heavier nuclei reported in this
figure, the order between the curves is not anymore relevant
since, for Z=28,30,32 and 34, the calculated one is the same with
or without proton sub-shell closure (see fig.3).
The experimental B(E2) curves of the Zn and Ge isotopes cross at
N=36, one can only discuss their spacing for N38. From N=38,
it is much more larger than the one obtained with a proton
sub-shell, but very similar to the one obtained with a proton
major-shell (long dashed curves). Between the experimental curves
of Ge and Se isotopes, the spacing is also much more large than
obtained with a proton sub-shell (see fig.3).
Above N=44, when for the Se isotopes the agreement with the
dot-dashed curves is striking, the experimental values are missing
for the Ge isotopes and no comment on the spacing between their
curves can be made. The spacing between the Zn and Ni experimental
curves depends also on N. This will be discussed in the
section VI. However one can note that from N=30 up to
36, the spacing between the Zn and the Ni experimental curves is
not constant, it increases from smaller up to larger than the one
obtained assuming a proton sub-shell closure (see the 20,28 and
the 30 short dashed curves). At N=40 the spacing obtained with a
major shell for the proton valence space has the good order of
magnitude as compared to the experimental one. It seems difficult
to find in the Ni isotopes
the reason of the variation with N of this spacing :
i) from N = 30 up to 36, the distance between the Ni experimental
B(E2) curve and the surrounding short-dashed and dotted calculated
curves
remains rather constant.
ii) from N=28 up to N=38, the experimental B(E2) curve of the Ni
isotopes is nearly perfectly symmetrical with respect to N=32-34,
which is the middle of a sub-shell beginning at 28 and closed at
N=38. In the next section these two points will be detailed.
In fig.5, only few experimental values are underestimated by the calculations in the Ca and Ti isotopes. All the B(E2) values of the Cr, Fe and Ni isotopes are underestimated but moderately (not by an order of magnitude) and without shape distortion. In fact these experimental curves seem to be simply shifted up, the Cr and Ni ones are very regular and follow pretty well the shapes obtained in the calculations (dotted and short dashed lines) This will be discussed for the Ni isotopes in the next section. For the Zn and Ge isotopes, for N36, few experimental values are underestimated by the calculations performed with a major shell in protons (and sub-shell in neutrons) but, for N36, these calculations overestimate the Zn and Ge experimental values. For the Se isotopes, the change is at N38 : for N38, few experimental values are underestimated by the calculations performed with a sub-shell in protons and a major shell in neutrons, but below 38, these calculations overestimates the experimental values of the light isotopes.
The changes in the spacings and in the under-over estimations are accompanied by the change in the shape of the experimental curves of Zn, Ge and Se isotopes : it sharpens with Z. Above N=38, the progressive shape distortion from the nearly bell-shaped curve of the Zn isotopes, to the deformed curve of the Ge and then to the rather peaked Se one, heralds the very abrupt slope of the Kr, Sr and Zr experimental B(E2) curves reported in fig.4. For these isotopic chains the assumption of the largest valence space for neutrons (the 28-50 major shell), which leads to a perfect experiment-calculations agreement for the Se isotopes with N44, is not sufficient to obtain an agreement in the shapes.
It results form our analysis of the figs.4 and
5 that:
i) the assumption of the 20-28 shell for
valence in neutrons and in protons is in good agreement with the
experimental curves for the Ca, Ti and Cr isotopic series.
ii) the assumption of a sub-shell closure in the valence space of the neutrons and
of the protons is in good agreement with the experimental curves
of the Ni, and of the light isotopes of Zn.
iii) The combinations of valence spaces with one sub-shell closure and
one major shell (which the results are reported in long dashed and
dot-dashed lines) appear more appropriate for most of the Zn, Ge
and Se isotopes: sub-shell in neutrons and major shell in protons
for Zn (when N36), Ge (38N42) and Se (up to
N=42) isotopes, then major shell in neutron and proton sub-shell
for the Ge and Se isotopes with N42. This combination gives
also good agreement for the B(E2) values of the heavy (N44)
Kr, Sr and Zr isotopes.
iv) the assumption of a major shell for
the valence of the protons and of the neutrons appears to be the
most appropriate combination of the valence spaces, to describe
the B(E2) values of the light (N44) Kr, Sr and Zr isotopes.
In fact, several points in our analysis of the B(E2) curves of the Zn, Ge, Se, Kr, Sr and Zr isotopes reported in figs.4 and 5 lead to interpret the content of these figures in terms of the vanishing of the protons Z=40 and N=38 sub-shell closures.
The neutron sub-shell closure at N=38 allows to reproduce the features of all the Ni (apart from the case of 68Ni) and Zn isotopes. On the contrary, for the heavy Ge and Se isotopes (N42) and all the Kr, Sr and Zr ones, it has totally disappeared.
The proton sub-shell disappearance can explain that the contribution brought by the two protons is larger between the Ge and Zn isotopes than between the Zn and Ni ones, as observed in the B(E2) ratios curves of fig.2(see sec.III). It can also explain that the spacing between the B(E2) curves of Ni isotopes and the Zn ones increases. The distortion of the Zn and Ge experimental curves in the light isotopes (N36) is the illustration of the proton sub-shell disappearance. Around N=42, the Zn, Ge, Se, Kr, Sr and Zr B(E2) curves have a behavior in agreement with a proton major shell, the proton sub-shell closure has vanished. But for N34 and N44 these curves have a behavior in agreement with a proton sub-shell closure assumption. Transitional curves with distorted shapes are obtained in zones of vanishing. The closures appear to be correlated with some of N and Z values, calling to mind a proton-neutron interaction effect.
To summarize, between the low B(E2) values and the high ones in fig.4 the main phenomenon is the vanishing of the proton sub-shell closure, between the low B(E2) values and the intermediate ones in fig.5 the phenomenon is the vanishing of the proton sub-shell. Between the intermediate value and the highest ones in fig.5 there is a transitional regime, in which some of the B(E2) curves have a proton major shell and a neutron sub-shell behavior and some others (those of the heavier nuclei) have a behavior corresponding to the inverse combination, a neutron major shell and a proton sub-shell. Such an inversion could traduce a p-n interaction not strong enough in these nuclei to vanish simultaneously the both sub-shell closures.
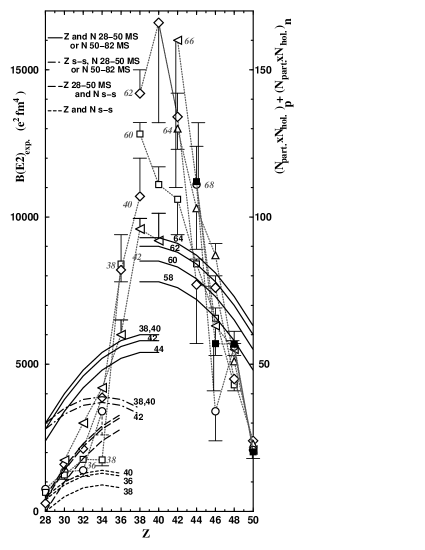
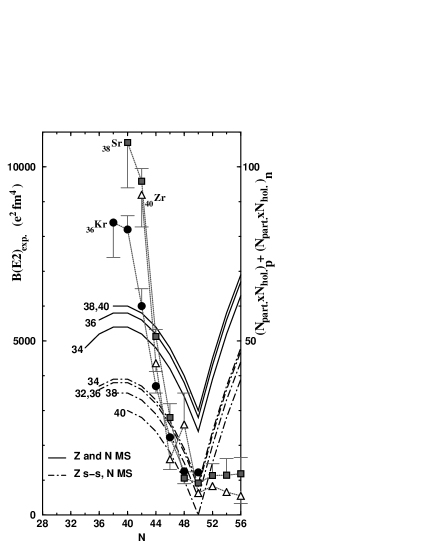
It is worth noting that the vanishing of the Z=40 sub-shell closure has already been put forward to explain the very high B(E2) values in the Zr, Mo and Ru isotopes with N60, as compared to the values reached for 50N60 Casten (1985); Erokhina et al. (1992). This vanishing has been interpreted as due to the p-n interaction Casten (1985); Erokhina et al. (1992), which was also involved in the onset of the deformation in this region Federman and Pittel (1977). In fig.6 we present, as a function of Z (28Z50), the experimental B(E2) curves of the N=60,62, 64 isotonic chains, which contain the Zr, Mo and Ru isotopes with the very high B(E2) values discussed in Casten (1985); Erokhina et al. (1992), and the corresponding calculated curves, assuming the 28-50 major shell for the valence of protons and the 50-82 major shell for the valence of the neutrons, since N is above 50. We have also reported, in the left part of fig.6, the experimental curves for the N=38,40 and 42 isotonic chains and the corresponding calculated curves obtained with a 28-50 major shell for the valence of each type of nucleon. This second group of isotones consists in nuclei the B(E2) of which have been already presented in fig.4 and 5. The impressive mirror symmetry with respect to Z=40 that one can observe in fig.6 between the experimental B(E2) curve (slopes and widthes) of one group as compared to the other one, confirms that a same mechanism operates in both parts of the figure. Following the interpretation given to the highest B(E2) values of the first group in Casten (1985); Erokhina et al. (1992), this mechanism is the vanishing of a proton sub-shell closure, which then takes place also in the second group (N=38,40, and 42) between Z=34 (Se) and 40. Moreover, the resemblance between this fig.6 and fig.7 confirms our interpretation, in terms of proton sub-shell closure vanishing, and the validity of the criteria we use to draw this interpretation for the fig.7, in particular the one related to the underestimation by the calculations. The similar underestimation of the highest experimental values made, in each group of isotones, by the corresponding calculations performed with major shells (28-50 or 50-82 for N50) for both nucleon species confirms that the N=38,40, and 42 isotones have, above Z=34, a 28-50 major shell for the valence of each nucleon species. This is in agreement with the scenario we can draw from the calculated curves reported in the left part of this figure. The B(E2) values at Z=28 are in agreement with the values of the curves obtained with a neutron sub-shell closure (short and long dashed lines), below the values obtained in the curves with a neutrons major shell. According to the curves reported below, the proton sub-shell closure vanishing between Z=34 and 42, is preceded by a neutron sub-shell closure vanishing between Z=28 and 34. The neutron sub-shell closure vanishing is not sharp, between Z=28 and 34 there is a transitional region in which the combinations of major shell for one type of nucleon and a sub-shell closure for the other nucleon species seem appropriate.
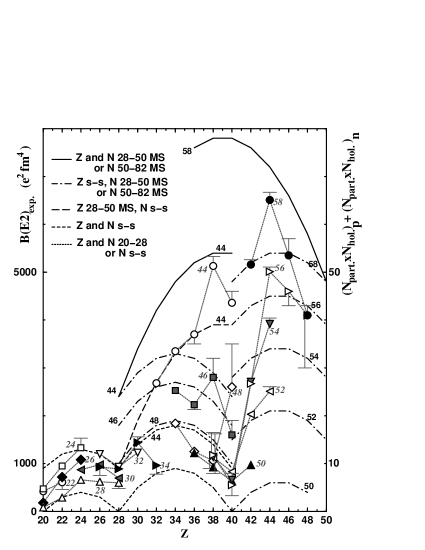
In fig.7, as a function of Z (20Z50), are reported the experimental B(E2) curves of isotonic chains for 44N58 and for N36. The experimental curves reported here as a function a Z appear in general more distorted than the ones reported as a function of N in fig.5. However one finds again some of the features analyzed in fig.5 : the different orders of magnitude, the changes in the spacing between the curves of two consecutive N values, the presence of a minimum at the sub-shell closure, followed by a corresponding maximum, the shapes distortion announcing the peaked shapes of fig.6. The similarities between the distortion of the N=44, 58, 56 curves as a function of Z in fig.7 and the Se, Ge ones as a function of N in the fig.5 is really impressive. Once again one can deduce that the same mechanisms operate in fig.7 and in fig.5: firstly the vanishing of one sub-shell closure leading from the low B(E2) values obtained with two sub-shell closures to the intermediate values corresponding to one of the two dissymmetrical combinations of valence spaces involving one major shell and one sub-shell closure; then an inversion of the proton and neutron valence space size leads to the second dissymmetrical combination and to the B(E2) highest values. In fig.5, the proton sub-shell closure vanishing explains the large spacing between the curves of the middle of the figure and in fig.7 it comes from the neutron sub-shell closure vanishing. But, as in the fig.5, the simultaneous vanishing of the two sub-shells closure cannot be obtained, this is either one or the other. And in fig.7, as in fig.5, the second dissymmetrical combinations of valence spaces leads to an impressive agreement between one calculated curve and the corresponding experimental one. It is between the N=44 experimental curve and the long dashed one (proton major shell and neutron sub-shell closure) in fig.7, and between the Z=34 experimental curve and the dot-dashed one (proton sub-shell closure and neutron major shell) in fig.5.
The interpretation in terms of the vanishing of the Z=40 sub-shell closure put forward to explain the very high B(E2) values in the Zr, Mo and Ru isotopes with N60 Casten (1985); Erokhina et al. (1992), confirms the conclusions we have drawn from our analysis of the different figures. The deviation of the Zn experimental B(E2) curve with respect to the Ni one, in fig.5, is explained by the proton sub-shell vanishing. However one feature in the Ni experimental B(E2) curve remains unexplained, its interpretation is the matter of the next section.
VI Interpretation of the opposite Ni and Zn B(E2) variations between N=38 and 40
Let us firstly comment the increase between N=38 and 40 in the B(E2) curve of the Zn isotopes. Our interpretation of this increase is
that it is, as for all the isotopic series with 30Z34,
due to the neutron sub-shell closure which imposes a minimum at
N=38 followed by an increase up to N=44. This interpretation is at
variance with the one given in Sorlin et al. (2002a). The previous
explanation was an increase of the deformation between N=38 and 40
allowing the Zn isotopes to escape from at the
contrary of the Ni isotopes, spherical, in which this
orbital hinders the quadrupole excitations.
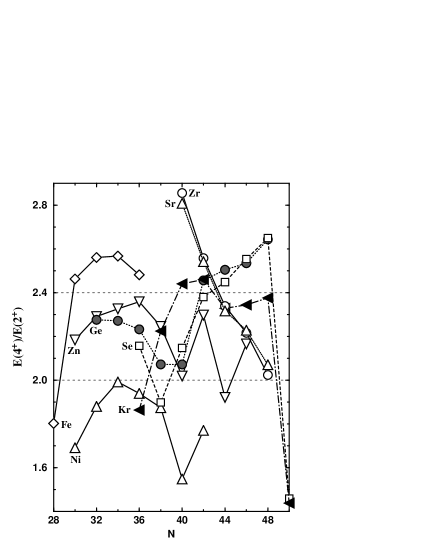
Although bringing into play 2 more units in spin than the B(E2) values, we will analyze the information provided by the ratios. According to the ref.Casten (1990) this ratio allows to separate nuclei in three ranges, the magic and near magic nuclei for 2.0, the vibrators between 2.0 and 2.4, the last limiting value being 3.3 for the rotors. It gives then indications on the deformation of nuclei nearly at the bottom of their ground state band. On fig.8 are reported the ) ratios as a function of N for the Fe up to the Zr isotopic series. The Kr and Sr nuclei – for which the isotope shift measurements previously mentioned in sec.III indicates a large change of deformation for N38 – exhibit also a large change of the ratio, and good signs of deformation with values above 2.4. But their evolve in opposition whereas the isotope shift measurements give similar evolution of their deformation. In the same way, the very low values of the ratio in 72,74Kr are inconsistent with the deformation parameters extracted from the isotope shift measurements Keim et al. (1995). All this is probably the consequence of the shape coexistence phenomenon, known to strongly perturb the low energy spectrum in the 72-78Kr Dejbakhsh et al. (1990). It is worth noting that, in Sr and Zr, the ratios evolve similarly as the isotope shifts do from N=50 up to 62 Campbell et al. (2002). On fig.8 one can note the parallelism of the Zn and Ni curves from N=30 up to 42, indicating that the difference of deformation stays constant between their isotopes, in particular during the decrease of the ratio between N=38 and 40. This appears in contradiction with an increase of deformation, between N=38 and 40, in the Zn isotopes as compared to the Ni ones. Moreover at N=40, end of the decrease, the Zn value is equal to 2.0, the near magic nuclei limit. No experimental evidence of deformation in the Zn isotopes at N=40 appears from fig.8.
Let us now come back to the particularity of the experimental B(E2) curve of the Ni isotopes reported in fig.5, the decrease between N=38 and 40. One can note that, in the Ni isotopes, the experimental B(E2) value at N=38 is equal to the one at N=28. This in agreement with a neutron sub-shell closure at N=38 since in this case the neutron contribution is null both at N=28 and at N=38. This B(E2) value, at N=40, smaller than the one measured at N=28 and 38 is then disconcerting. This exceeds the consequence of the simple change of parity in the neutron single-particle level scheme as the one coming from . At the very most, such a parity difference can annihilate only the odd neutron contribution such as the 1p-1h one Grawe and Lewitowicz (2001); Sorlin et al. (2002a); Langanke et al. (2003). Therefore, even with a total neutron contribution equals to zero, the B(E2) value at N=40 would be equal to those measured at N=28 and 38, not lower. The curve of Ni isotopes put then light on a proton effect. That can also be deduced from the Ca experimental B(E2) curve. Whereas the B(E2) values of the 40,48Ca isotopes are nearly equal to zero as expected with null contributions from neutrons (N=20,28) and from protons (Z=20), this is not the case in the 56,66Ni (N=28,38 and Z=28) isotopes although the experimental B(E2) curve increases between N=28 and 30 as expected after a neutron shell closure, and decreases between N=36 and 38 as expected before a neutron shell closure. It is worth noting that the experimental B(E2) curve of the Ni isotopes is closer to the Z=30 calculated curve than to the Z=28 one. Indeed (see fig.5) between N=30 and 36 the experimental curve is merged with the Z=26 calculated one assuming sub-shell closures for both neutrons and protons (at N=28, the experimental values of the Ni, Cr and Fe isotopes are all merged, near above the Z=30 calculated curve). This indicates in the Ni isotopes an additional, with respect to our formula, and constant (at least between N=30 and N=36) proton contribution in the B(E2) values between 28 and 38, which has disappeared for N=40. This is then all the isotopic chain which has to be taken into account in order to understand the decrease of the Ni B(E2) values between N=38 and 40, which is not only an effect between the 56Ni (N=Z nuclei) and 68Ni (N=40) isotopes has proposed in recent works Sorlin et al. (2002a); Langanke et al. (2003).
Moreover, at N=40, the experimental B(E2) value of the 68Ni is in rather good agreement with the one expected from calculations for Z=28 with two sub-shell closures (see fig.5), the agreement resembling the one obtained for the Ca isotopic series. If, at N=38, the additional proton contribution were null (as it is at N=40), one would assist to an increase between a low B(E2) value at N=38 and the B(E2) value at N=40 of the order of what is observed in the Zn and Ge isotopes. The decrease in the Ni isotopes between N=38 and 40 is really misleading, it dissimulates a N=38 neutron sub-shell closure behavior. In fact the 68Ni B(E2) value is in agreement with an increase following the minimum at N=38 as in the curves obtained with a neutron sub-shell closure at N=38.

The presence of a N=38 gap constrains the order of the neutron single-particle levels, as the Z=40 sub-shell closure constrains the order of the proton ones. A gap can appear for particle number equals to 38 only in the single-particle level scheme obtained in the reference Nazarewicz et al. (1985), the order of which is reported in fig.9a, between the and the orbitals. On the contrary the order of the single-particle levels taken from Ring and Schuck (1980) and reported in fig.9b allows only a gap for particle number equals to 40, between the and the orbitals. One will then assume in the following for the neutrons the order of the single-particle levels a) from ref.Nazarewicz et al. (1985) and for the protons the order of the single-particle levels b) from ref.Ring and Schuck (1980).
The N=38 sub-shell closure in the Ni isotopes is confirmed by the excitation energies of the first excited states observed in the odd Ni isotopes with N=39 and 41 as compared to the excitations energies in the odd N=39 and 41 Zn and Ge isotopes. The ground state and the two first of the observed excited states are reported in fig.10.

At N=39, the ground state in the Ni, Zn and Ge isotopes is a state as expected when arising from one particle (or one hole) in , the two excited states are and as expected from a hole in and a particle in . At N=41, in the Ni and Ge isotopes the ground state is a state as expected when arising from one particle (or one hole) in but in the Zn isotope it is a state.
At N=39 and 41, in the Ni isotopes the orbital is isolated from and from , confirming the N=38 gap and the order of the single-particle level scheme given in the figure. The gap at N=38 appears even stronger in the odd Ni isotopes with N=39 than in its isotones of Zn or Ge, this will be discussed in the next section. The spacing at N=40 between and is also apparent in the Ni isotope, illustrated by the spacing between the () and the () states. In the Zn and Ge isotopes these two excited states are very near in energy, and both have a decreasing excitation energy, giving a picture of the weakening of the N=38 sub-shell closure before it vanishes.
It is worth noting that the effect of the size of this energy spacing at N=40, on the B(E2) value of 68Ni has been discussed in terms of a N=40 gap counteracted by neutron pair scattering in 68Ni Sorlin et al. (2002a) and has been recently re-discussed in the frame of calculations involving a non null 2p-2h neutron contribution to the B(E2) value in this nucleus Langanke et al. (2003). Unfortunately the first calculations have been reported only for N34, and in the latter calculations the B(E2) value calculated at N=38 is greater than the one at N=28 and the B(E2) value calculated at N=40, where the gap is assumed, is equal to the one at N=28 Langanke et al. (2003). The striking B(E2) value lower in 68Ni than in 56Ni escapes to these calculations. They therefore demonstrate that to calculate in QRPA a same B(E2) value at N=38 and at N=28, a N=38 gap is needed as in our simple model calculations. The experimental B(E2) curve of the Ni isotopes implies a gap at N=38, but an energy spacing between the single-particle levels at N=40 appears from the spectrum of the odd Ni excited states and not from the Ge and Zn ones. It can also play a part in the explanation of the origin and the annihilation of the additional proton contribution at N=40 which will be discussed now.
VII Effects of the p-n interaction
It has been pointed out Federman and Pittel (1977); Casten et al. (1981) that the p-n interaction can be strong enough to reduce (and even to eradicate) subshell gaps. This reduction goes with the promotion of particles into orbitals which were above the gap and which can drive deformation Federman and Pittel (1977); Casten et al. (1981); Younes and Cizewski (1997). The p-n interaction is favored when there is a large overlap between the proton and the neutron active orbital. Taking ( ) to characterize the proton orbital and ( ) the neutron one, the angular overlap is maximized when 1, and the radial overlap is maximum for = and De-Shalit and Goldhaber (1953). Among the single-particle levels reported in fig.9a,b, the 1f7/2, 1f5/2 and 1g9/2 orbitals can realize these conditions.
If, as in sec.VI, one assumes for protons the order of single-particle levels displayed in fig.9b, the 1f5/2 orbital is occupied for Z=36, 38 and 40. These proton numbers correspond to the Kr, Sr and Zr nuclei which present the highest B(E2) values (i.e. the largest collectivity) reported in fig.4. These large B(E2) values are obtained for a restricted number of their isotopes, those with N=402. Assuming for neutrons, as in sec.VI, the order of single-particle levels reported in fig.9a, the neutron number N=38 corresponds to the occupation up to the last level of 1f5/2, N=40 to the occupation of 2p1/2, and N=42 to the occupation of one level of 1g9/2. This is nearly the situation described in Federman and Pittel (1977), protons in 1f5/2 and neutrons occupying, for N62, the 1g7/2. But the polarization effects Federman and Pittel (1977) induce, from N=60 so with an anticipation of four neutrons in these even-even nuclei, the promotion of neutrons into this high-j orbital. In the Kr, Sr and Zr isotopes with N=402, the protons occupy the 1f5/2 orbital, and in neutron this is the 1g9/2 orbital which the occupation is anticipated from N=38 when it is expected from N=42. Neutrons are promoted and the 1g9/2 orbital is lowered. The eradication of any gap between 1f5/2 and 1g9/2 can occur. This increases the number of levels Nh of the neutron valence space, and produce the gain of collectivity observed for N=402. This phenomenon is expected to be maximum at N=40, since at N=42, the 1g9/2 is naturally occupied. At N=40 the ratio of the cost in energy for promotion over the gain in valence space is maximal. It is worth noting that, among the high values of B(E2) observed in fig.6, those of Sr, Zr and Mo isotopes, for 60N64, have been previously interpreted not only by the anticipated promotion of neutrons into 1g7/2, but also by the promotion of protons from below the Z=40 sub-shell closure, nearly annihilated, into 1g9/2 Federman and Pittel (1977); Casten et al. (1981). In fig.6, one can observe that the same order of magnitude is reached by the highest B(E2) values of these previous Sr, Zr and Mo isotopes (with 60N64) and by those of the Kr36, Sr38 and Zr40 isotopes with 38N42. This implies, in agreement with our conclusions of the sec.V, that in these Kr36, Sr38 and Zr40 isotopes, as in the Sr, Zr and Mo ones, the proton sub-shell closure is certainly reduced or vanished. This comes in addition to, in the Kr, Sr an Zr isotopes, the vanishing of any neutron gap, or spacing, between 1f5/2 and 1g9/2. Starting from the occupation of 1f5/2, the N=38 gap and the N=40 spacing are annihilated, neutrons are promoted on 1g9/2. And as in Federman and Pittel (1977); Casten et al. (1981) the occupation of the 1g9/2 in the Kr, Sr, Zr isotopes allows the polarization effects to induce the promotion of protons in 1g9/2. In the Kr, Sr, Zr isotopes both types of particles are promoted, as in Federman and Pittel (1977). But here, both sub-shell gaps are vanished thanks to the mutual polarization effect induced by the p-n interaction.
In the Zn30, Ge32 and Se34 isotopes, protons have to be promoted from 2p3/2 and 2p1/2 into the 1f5/2 orbital, or better into the high-j 1g9/2 one, this is possible from N=34, thanks to the occupation of the 1f5/2 orbital allowing the p-n interaction and the polarization effect to take place. It appears that when the preliminary promotion concerns protons, it weakens the p-n interaction : as shown in fig.5, in the Zn, Ge and Se isotopes only the proton sub-shell closure is clearly vanished from N=34 up to N=40. Below N=38, the only B(E2) value giving sign of the neutron sub-shell vanishing is the Se one at N=36. For neutron numbers equal to 40, the p-n interaction must be strong enough to anticipate, as reported in Federman and Pittel (1977), the occupation of 1g9/2 by promoting neutrons, and to ignore the N=40 spacing of the single-particle level scheme. Indeed, at N=42 when the neutrons occupy “naturally” 1g9/2, the mutual polarization effects between 1f5/2 and 1g9/2, in the Ge and Se isotopes, are strong enough to lead to the vanishing of the neutron sub-shell closure : the Ge and Se B(E2) curves decrease between N=42 and 44, the Se one has, afterwards, a neutron major-shell behavior. Nevertheless, the gain in collectivity is always lower in the Zn, Ge and Se than in the Kr, Sr and Zr isotopes. At N=42 where the gain is maximal, the distance between the experimental values and the relevant calculated curve is considerably lower for the Ge and Se nuclei, than for the Kr, Sr and Zr. On the other hand , it is worth noting that the coupling of the pairing mode to other modes of excitation such as the proton-neutron coupling Kumar (1978) has been put forward, as well as pairing fluctuations Kumar (1978); Ardouin et al. (1978) to explain the particularities of the Ge isotopes. The p-n interaction can play the role of the pairing fluctuations, acting also on the size of the spacing between single-particle levels of one or both nucleon species.
Finally, in the Ni isotopes, the “natural” occupation of 1f7/2 make possible in all the isotopes, the polarization effects to take place, with the promotion of particles. As already discussed, the Ni experimental B(E2) curve puts light on an additional and nearly constant (between N=30 and 36) proton contribution as compared to the calculations. Indeed the agreement obtained by the Z=26 calculated values with a sub-shell closure for both nucleon species is an indication for the promotion of two protons above the Z=28 gap. It is worth noting that in 56Ni the promotion of protons over the Z=28 gap due to the strong p-n interaction in the N=Z nuclei has been reported in ref.Sorlin et al. (2002a). It was also reported that, in the 64-74Ni isotopes, 80 of the B(E2) values comes from the proton core excitation into 1f7/2.(Nevertheless in these shell model calculations the single-particle level scheme present only one gap at N=40, and not a N=38 gap and a spacing at N=40.) The promotion of protons can be the effect of a mutual polarization between the 1f7/2, 1f5/2 and 1f5/2 orbitals, into which neutrons are probably promoted. But this promotion has no strong effect on the shape of the experimental B(E2) curve. Indeed, the promotion of protons above the Z=28 gap seems to cost a great part of the gain in collectivity. In fig.7, the N=28 experimental B(E2) curve is, as a function of Z, flat from Z=24 up to Z=28, when it is expected to decrease due to the proximity of the Z=28 gap. The Z=28 gap seems to be very slightly diminished, but too large to be vanished, there is a flattening in the curve not an increase. The other picture of this flattening is in the fig.5, at N=28, the near equality of the experimental B(E2) values of the Cr, Fe and Ni isotopes. (The shift of the Cr and Fe experimental B(E2) curves can be then also explained by the proton promotion above the Z=28 gap and the slight weakening of it).
Therefore at N=28 in the Ni isotopes when 1f7/2 is filled, as at N=38 when it is 1f5/2 which is filled, the p-n interaction appears to be strong enough to promote some more particles, the experimental Z=28 curve in fig.5 is slightly deformed as a function of N at these two points. One can note the impressive symmetry of the slight deformation at these two points. The equality of the B(E2) values of 52Cr, 54Fe and 56Ni is in favor of an additional promotions of two protons above the Z=28 gap at these two points N=28 and N=38. The neutrons could also have here a part in the gain of collectivity, and be promoted over the N=38 gap slightly diminished, but maintained : the B(E2) curve is still increasing from N=28 up to N=30 and decreasing between N=36 and N=38. Nevertheless, the neutron promotion is less probable than the proton promotion, the decrease of the B(E2) value between 66Ni and 68Ni indicates that the gap resulting from the N=38 gap followed by the N=40 spacing is non negligible for the p-n interaction. Above N=38, the complete filling of 1f5/2, the next neutron orbital favoring the p-n interaction is 1g9/2. But the p-n interaction appears not strong enough to continue to promote protons from below the Z=28 gap when neutrons are as far as above the N=38 one, or even farther if one includes the spacing at N=40 of the single-particle level scheme. This explains the loss at N=40 of the additional proton contribution to the B(E2) values observed in the Ni isotopes. No promotion of neutron to 1g9/2, no lowering of 1g9/2, and no weakening of the N=38 sub-shell closure are observed at N=40, the 68Ni experimental B(E2) value is very near from the one calculated assuming sub-shell closure for both nucleon species.
The Z=40 and N=38 sub-shell closures appear to depend strongly on the proton and neutron high-j orbital occupation. In that sense, as they can be vanished, they may be not considered as inducing magicity.
VIII Probability calculations
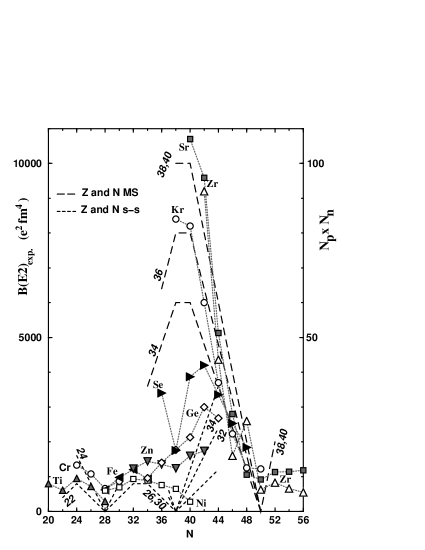
It results from the discussion presented in the sec.V that the seniority formula can reproduce neither the profile nor the magnitude of the B(E2) curves in case of very high collectivity. On the other hand, the B(E2) value is known to depend on the product Casten (1985) NpNn, of the number of protons (or protons holes above the mid-shell) by the number of neutrons (or neutrons holes above the mid-shell) in the valence shells. (This product is also equal to four times the product NπNν of the number of the proton bosons by the number of the neutron bosons Talmi (1993); Casten (1985).) As shown in fig.11, when normalized to the experiment using a scale giving 100 e2fm4 per unit of NpNn, the calculated NpNn curves present some similarities with the experimental ones. Firstly, the relative magnitude of the Sr, Zr and Kr, and Cr, Ti curves are very well reproduced. The agreement is only reasonable for the Fe, Zn, Ge and Se curves. (For the Ni isotopes, which have Np=0, no comparison with the experimental values can be drawn.) Secondly, the calculated curves for Se, Sr, Zr and Kr converge to a unique point at the end of the shell, as observed experimentally. However, these NpNn curves present a systematic disagreement with the experimental ones: the experimental slopes are larger than the calculated ones. In the well known correlation between B(E2) value and NπNν, the latter difference plays certainly an important part in the dispersion obtained in the B(E2) curve versus NpNn (or NπNν) of Casten (1985), as well as in the curves of the effective proton numbers Np or Nn versus Z or N Zhao and Chen (1995), this latter dispersion making difficult the sub-shell closure localization Zhao and Chen (1995).
Another type of bell-shaped curve is obtained by considering that the excitation probability is proportional to the number of ways of putting P pairs of particles on L levels, i.e proportional to .
Assuming a strong p-n interaction that mixes up protons and neutrons as well as the proton and neutron high-j shells, one can calculate the curves obtained involving a unique shell of L levels, and on which pairs (of protons as well as of neutrons) can be excited.
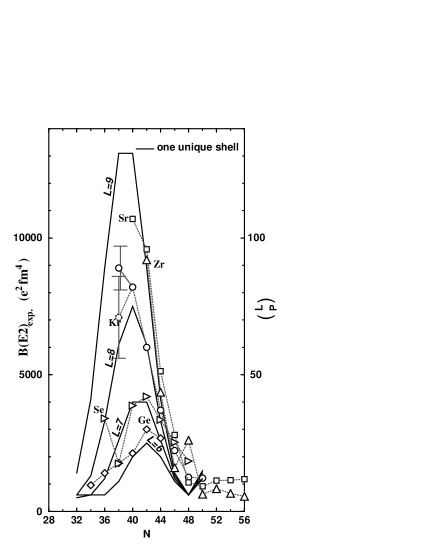
In fig.12 the calculated curves giving the best agreement with the experimental B(E2) values of Ge up to the Zr isotopes are reported in solid lines. The number of levels of the unique shell fitting with the experimental B(E2) values is L=9 for the Sr and Zr isotopes, L=8 for the Kr isotopes, L=7 for the Se isotopes and, finally, L=6 for the Ge isotopes. In addition to reasonable relative heights and slopes very near from the experimental ones –at least nearer to the ones obtained in the NpNn calculations see fig.11 – these curves point out the alternation in the number of points which appear at the maximum of the curves: one for Ge, two for Se. In the case of 74Kr we have reported the results from the two life time measurements using the recoil distance method Tabor et al. (1990); Roth et al. (1984) which are not consistent although they are not independent as mentioned in Tabor et al. (1990). The number of points at the maximum of the Kr curve remains uncertain, as for the Sr and Zr curves for which the values at low neutron number are missing. Moreover it is worth noting that a shell constituted by the gathering of 1f5/2 and 1g9/2, that the p-n interaction joins up, would have 8 levels, and 9 if one includes between them the 2p1/2 orbital.
IX Conclusion
Using the expression obtained within the seniority scheme the B(E2) features observed in the Z=28-40 with N=28-50 and 52-64 nuclei are interpreted on the basis of both N=38 and Z=40 sub-shell eradications due to the p-n interaction.
The low B(E2) value in 68Ni is explained by the N=38 sub-shell closure and the Z=28 gap, which prevent, for N above 38, the p-n interaction to act as it does in the lighter Ni isotopes, or in the heavier nuclei, from the Zn, Ge and Se up to the Zr isotopes. It would be interesting to measure the 70Ni B(E2) value. Indeed, the B(E2) value in 68Ni, as in 70Zn, indicates a behavior following the one expected with N=38 sub-shell closure. On another hand from N=42, the neutrons in 1g9/2 could, with the protons in 1f7/2, start the p-n interaction. In this case one could expect a proton contribution to appear as observed between N=28 and 38. A distortion of the B(E2) curves as observed in the Ge and Se isotopes could also appear, although improbable. Indeed, even at N=42 when neutrons are occupying 1g9/2, there is no distortion in the case of the Zn isotopes, due to the cost of promoting protons from 2p3/2 into 1f5/2, and, in the Ni isotopes, the Z=28 gap exhausts a large part of the gain in collectivity in the light isotopes. The distortion, due to the p-n interaction, of the Ge, Se curves and of the Kr, Sr and Zr isotope ones, is amazingly reproduced by the curves of the probabilities to excite P pairs of particles into the L levels of a unique valence shell.
Acknowledgements.
The authors want to thank R. Lombard for stimulating discussions.References
- Sorlin et al. (2002a) O. Sorlin, S. Leenhardt, C. Donzaud, J. Duprat, F. Azaiez, F. Nowacki, H. Grawe, Z. Dombrádi, F. Amorini, A. Astier, et al., Phys. Rev. Lett. 88, 092501 (2002a).
- Sorlin et al. (2002b) O. Sorlin, M.-G. Porquet, S. Leenhardt, F. Azaiez, M. Belléguic, C. Borcéa, C. Bourgeois, J.-M. Daugas, C. Donzaud, I. Deloncle, et al., E. P. J. p. in press (2002b).
- Grawe and Lewitowicz (2001) H. Grawe and M. Lewitowicz, Nucl. Phys. A 693, 116 (2001).
- Langanke et al. (2003) K. Langanke, J. Terasaki, F. Nowacki, D. Dean, and W. Nazarewicz, Phys. Rev. C 67, 044314 (2003).
- Sorlin (2002) O. Sorlin, Private Communication (2002).
- Mayet (2002) P. Mayet, Private Communication (2002).
- Talmi (1993) I. Talmi, Simple Models of Complex Nuclei, vol. 7 of Contemporary Concepts in Physics (Harwood Academic Publishers, 1993).
- Ring and Schuck (1980) P. Ring and P. Schuck, The nuclear many body problem (Springer-Verlag New York Inc, 1980).
- Casten (1990) R. Casten, Nuclear Structure from a Simple Perspective, Oxford Studies in Nuclear Physics (Oxford University Press, 1990).
- Raman et al. (2001) S. Raman, C. Nestor, JR., and P. Tikkanen, At. Data and Nucl. Data Tab. 78, 1 (2001).
- Iachello (1978) F. Iachello, ed., Interacting Bosons in Nuclear Physics, vol. 1 of Ettore Majorana Int. Sci. Series: Phys. Sci. (Plenum Press, New York and London, 1978).
- Keim et al. (1995) M. Keim, E. Arnold, W. Borchers, U. Georg, A. Klein, R. Neugart, L. Vermeeren, R. Silverans, and P. Lieven, Nucl. Phys. A 586, 219 (1995).
- Chuu et al. (1993) D. Chuu, S. Hsieh, and H. Chiang, Phys. Rev. C 47, 183 (1993), and references herein.
- Ardouin et al. (1975) D. Ardouin, R. Tamisier, M. Vergnes, G. Rotbard, J. Kalifa, G. Berrier, and B. Grammaticos, Phys. Rev. C 12, 1745 (1975).
- Ardouin et al. (1978) D. Ardouin, B. Remaud, K. Kumar, F. Guilbault, P. Avignon, R. Seltz, M. Vergnes, and G. Rotbard, Phys. Rev. C 18, 2739 (1978).
- Kumar (1978) K. Kumar, J. Phys. G 4, 849 (1978).
- de Lima et al. (1981) A. de Lima, A. Ramyya, B. V. Nooijen, R. Ronningen, H. Kawakami, R. Piercey, E. de Lima, R. Robinson, H. Kim, L. Peker, et al., Phys. Rev. C 23, 213 (1981).
- Chatuverdi et al. (1991) L. Chatuverdi, X. Zhao, A. Ramayya, J. Hamilton, J. Kormicki, S. Zhu, C. Girit, H. Xie, W.-B. Gao, Y.-R. Jiang, et al., Phys. Rev. C 43, 2541 (1991).
- Hermkens et al. (1992) U. Hermkens, F. Becker, J. Eberth, S. Freund, T. Mylaeus, S. Skoda, and W. T. ans A.V. d. Werth, Z. Phys. A 343, 371 (1992).
- Ronnigen et al. (1976) R. Ronnigen, A. Ramayya, J. Hamilton, W. Lourens, J. Lange, H. Carter, and R. Sayer, Nucl. Phys. 509, 170 (1976).
- Warburton et al. (1985) E. Warburton, C. Lister, J. Olness, P. Haupstein, S. Saha, D. Alburger, J. Becker, R. Dewberry, and R. Naumann, Phys. Rev. C 31, 1211 (1985).
- Kaye et al. (1998) R. Kaye, J. Adams, C. Smith, G. Solomon, S. Tabor, G. García-Bermúdez, M. Cardona, A. Filevich, and L. Szybisz, Phys. Rev. C 57, 2189 (1998).
- Lieb and Kolata (1977) K. Lieb and J. Kolata, Phys. Rev. C 15, 939 (1977).
- Heese et al. (1996) J. Heese, K. Lieb, L. Luehmann, F. Raether, B. Woermann, D. Alber, H. Grawe, J. Eberth, and T. Mylaeus, Z. Phys. A 325, 45 (1996).
- Hamilton et al. (1974) J. Hamilton, A. Ramayya, W. Pinkston, R. Ronningen, G. Garcia-Bermudez, H. Carter, R. Robinson, H. Kim, and R. Sayer, Phys. Rev. Lett. 32, 239 (1974).
- Chandler et al. (2000) C. Chandler, P. Regan, B. Blank, C. Pearson, A. Bruce, W. Cattford, N. Curtis, S. Czajkowski, P. Dessagne, A. Fleury, et al., Phys. Rev. C 61, 044309 (2000).
- Ragnarsson et al. (1978) I. Ragnarsson, S. Nilsson, and R. Sheline, Phys. Rep. 45, 1 (1978).
- Nazarewicz et al. (1985) W. Nazarewicz, J. Dudek, R. Bengstson, T. Bengstson, and I. Ragnarsson, Nucl. Phys. 443, 397 (1985).
- et al. (1985) P. B. et al., Nucl. Phys. A 443, 39 (1985).
- Casten (1985) R. F. Casten, Nucl. Phys. A 443, 1 (1985).
- Erokhina et al. (1992) K. Erokhina, V. Isakov, I. Lemberg, and I. Mitropolsky, Bull. of Russ. Acad. of Sci. Phys. 56, 104 (1992).
- Federman and Pittel (1977) P. Federman and S. Pittel, Phys. Lett. 69B, 385 (1977).
- (33) Evaluated nuclear structure data file, maintained by the National Nuclear Data Center, Brookhaven National Laboratory.
- Dejbakhsh et al. (1990) H. Dejbakhsh, T. M. Cormier, X. Zhao, A. V. Ramayya, L. Chaturvedi, S. Zhu, J. Kormicki, J. H. Hamilton, M. Satteson, I. Y. Lee, et al., Phys. Lett. B 249, 195 (1990).
- Campbell et al. (2002) P. Campbell, H. Thayer, J. Billowes, P. Dendooven, K. Flanagan, D. Forest, J. Griffith, J. Huikari, A. Jokinen, R. Moore, et al., Phys. Rev. Lett. 89, 82501 (2002).
- Casten et al. (1981) R. Casten, D. Warner, D. Brenner, and R. Gill, Phys. Rev. Lett. 47, 1433 (1981).
- Younes and Cizewski (1997) W. Younes and J. Cizewski, Phys. Rev. C 55, 1218 (1997).
- De-Shalit and Goldhaber (1953) A. De-Shalit and M. Goldhaber, Phys. Rev. 92, 458 (1953).
- Zhao and Chen (1995) Y. Zhao and Y. Chen, Phys. Rev. C 52, 1453 (1995).
- Tabor et al. (1990) S. Tabor, P. Cottle, J. Holcomb, T. Johnson, P. Womble, S. Buccino, and F. Durham, Phys. Rev. C 41, 2658 (1990).
- Roth et al. (1984) J. Roth, L. Cleemann, J. Eberth, T. Heck, W. Neumann, M. Nolte, R. Piercey, A. Ramayya, and J. Hamilton, J. Phys. G 10, L25 (1984).