Neutron Moderation in the Oklo Natural Reactor
and the Time Variation of
LA-UR 03-6686
Abstract
In previous analyses of the Oklo (Gabon) natural reactor to test for a possible time variation of the fine-structure constant , a Maxwell-Boltzmann low energy neutron spectrum was assumed. We present here an analysis where a more realistic spectrum is employed and show that the most recent isotopic analysis of samples implies a decrease in , over the last two billion years since the reactor was operating, of ( confidence). Issues regarding the interpretation of the shifts of the low energy neutron absorption resonances are discussed.
pacs:
06.20.Jr, 28.41.-i, 28.20.GdI Introduction
It was recognized by Shlyakhter 1 that isotopic ratios of fission products and secondary neutron absorption reactions that occurred with the Oklo natural reactor phenomenon some 2 billion years ago could be used to test whether the fine-structure constant varies with time. Specifically, if a neutron absorber (e.g., 149Sm) has a low-energy neutron absorption resonance, and the excited compound state can decay by gamma emission, the resonance energy will change in a predictable way if varies. The overlap of the resonance with the reactor neutron spectrum will subsequently change thereby altering the ratios of nearby isotopes.
In addition to 1 , two other detailed analyses of the Oklo phenomenon have been completed 2 ; 3 . The purpose of this note is to assess the validity of the assumption in these analyses that the neutron spectrum can be described by a Maxwell-Boltzmann (MB) distribution, and to determine the effects on the limit of the time variation of for different neutron spectra. The possibility of a non-MB spectrum was discussed in 2 (footnote 3), but was not considered to be important. However, for the high-accuracy results presented in 3 , the effects due to deviations from a MB spectrum become very important.
II The Oklo Phenomenon as a Homogeneous Reactor
The fact that the Oklo phenomenon occurred was indicated when uranium taken from this mine was found to be deficient in 235U; subsequent tests confirmed this discovery. From core samples and knowledge of reactor dynamics, the age of the Oklo phenomenon was determined to be about 2 billion years. The conditions necessary for the multiple reactor zones to exist can be used to place constraints upon many parameters such as concentrations of various elements, temperature, moderator type and concentration, etc. while the reactor was operating. For example, it can be shown that only hydrogen or deuterium could have served as moderators at Oklo and hydrogen present in water or as hydration of the uranium oxide appears to be the only plausible choice. As a first approximation to the reactor geometry, it seems reasonable to assume that the Oklo phenomenon was a homogeneous reactor of infinite extent. This simplifies the estimation of the multiplication factor and the neutron flux which we will see depends on the amount of hydrogen and neutron absorbing impurities in the ore.
With the present isotopic ratio of 235U/238U, the maximum that can be obtained in a homogeneous mixture of water and natural uranium is , which occurs where there are 2.43 molecules of water per atom of uranium 4 (see table 18.1, p. 612). The fractional isotopic abundance of 235U in natural U at present is 0.711%. Extrapolating this result implies a 235U relative isotopic concentration of about 1.2% to achieve . Two billion years ago, the relative concentration of 235U was about 3.7% (due to the different lifetimes of 235U and 238U). This implies that two billion years ago, for a system with 2.4 H2O molecules/U atom. If such a large fractional concentration of water was present, the Oklo reactor would have been highly divergent. Of the possible effects that can reduce , the two most likely are a low water (or hydrogen) concentration in the U deposit, and the presence of impurities. It is interesting to note that the reactor would have been somewhat self-stabilizing as a runaway to high temperatures would drive water out of the ore deposit.
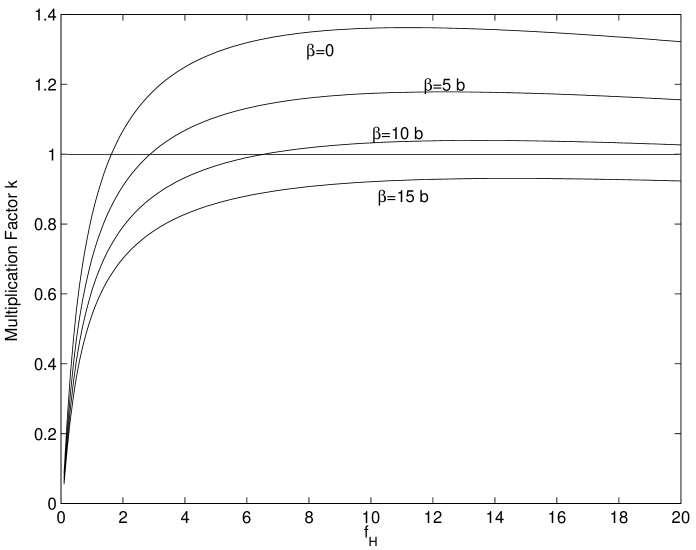
Precise knowledge of the nature and concentration of neutron-absorbing impurities at the time the Oklo reactor was running is lacking. However, we can make a reasonable estimate of the possible maximum absorption by impurities. The forgoing arguments can made rigorous by estimating as a function of the hydrogen atomic number density fraction, and the atomic fraction of absorbing impurities , relative to the number density of U atoms. With 235U isotopic fraction , for thermal neutrons:
| (1) | |||||
where is the number of neutrons released per 235U fission, is the resonance escape probability obtained from Eqs. (10.29) and (13.3) of 4 , b is the 235U fission cross section, b is the total 235U total neutron absorption cross section, b is the 238U total neutron absorption cross section, b is the hydrogen absorption cross section. The total impurity absorption can be parameterized by
| (2) |
Furthermore, the effects of oxygen have been neglected. For , as a function of , and as a function of impurity concentration parameterized by , is shown in Fig. 1. With no impurities, is achieved when . For a higher hydrogen concentration, the reactor would have run away and the resulting high temperatures would have driven water out of the ore; the system was likely self-stabilizing to . As the impurity concentration, parameterized by in Fig. 1, increases, required for increases also; at , to achieve . For b, it is not possible to achieve . It is also known that the reactor operated until which implies a more restrictive limit of b, for which . We note that criticality calculations at these high 235,238U concentrations are subject to a number of corrections (see 4 , pp. 463-468) so the figures derived here are to be considered as providing guidelines for the operation of the natural reactor which indicates that is about 3, with .
A ubiquitous substance that offers a significant thermal neutron absorption cross section is sodium chloride. The thermal absorption cross section for sodium is b, but for chlorine b which limits . The relative atomic concentrations of other impurities can be similarly estimated.
III Calculation of for a non-MB Neutron Spectrum
It is well-known that when neutrons are moderated in the presence of a absorber (such as U), the low-energy part of the spectrum becomes suppressed relative to a high-energy component of the flux. The relevant parameter that describes this suppression is (4 , pp. 335- 340)
| (3) |
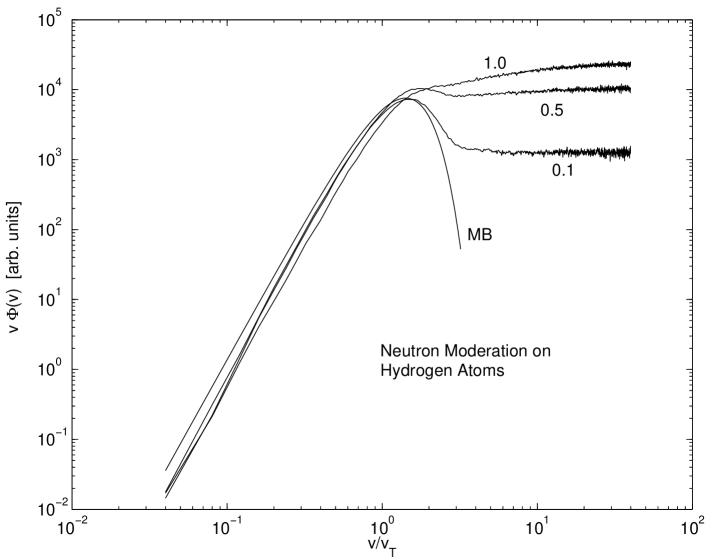
where is net absorption cross section of the homogeneous mixture for a neutron rms velocity corresponding to the moderator temperature, is the net scattering cross section of the moderating atoms, and is the atomic mass of the moderating atoms. In the present case, for neutron energies about 1 eV, the atomic mass for H which is responsible for most of the neutron moderation. When , the tail contains the bulk of the neutrons. This is illustrated in Fig. 2 where the flux as a function of as obtained from a Monte Carlo calculation following the procedure in 6 .
For the parameters derived in the last Section, that is , , and , . However, for neutron energies less than 1 eV, molecular effects become important; it is no longer a good approximation to assume that the neutron moderation occurs by scattering from free atoms. The chemical bonding effect can be estimated by setting , so in the low neutron energy region ( eV), at 300 K, and scales with temperature as
| (4) |
The elements 149Sm and 155Gd have low energy neutron resonances and are particularly interesting to test for possible time variation of . The formalism developed in 1 ; 2 ; 3 for the effective cross section of a substance with a low-energy neutron resonance can be understood as follows. The interaction of a neutron with a nucleus can be parameterized through the optical model, where the Hamiltonian is
| (5) |
where the absorption rate for neutrons with energy is . The absorption cross section can be expressed as
| (6) |
where is the neutron momentum, is a parameter that depends upon the spins of the neutron and interacting nuclei, is the resonance energy and are the rates for neutron and gamma ray absorption respectively. The parameters , , and for elements of interest here can be found in 2 ; 3 .
The absorption cross section at a particular energy can also be described as the product of the rate of absorption and the times spent in the material, normalized to the propagation length ,
| (7) |
Far away from , is nearly constant and , where is the velocity at which the cross section was measured. Nuclei whose cross sections can be described this way are know as “” absorbers. This is a more efficient representation for thermal neutron absorption of many nuclei such as U.
The net absorption cross section is given by the integral of the cross section time the neutron flux ,
| (8) |
In assessing the effects of a varying low-energy resonance, because all cross sections follow the same universal function which have exactly the same form up to a constant, it is useful to define an effective relative cross section for the nuclei with a varying as
| (9) |
where is the energy-dependent cross section, is the moderator temperature, and are the neutron flux and energy distributions, respectively, and is the velocity at which absorption cross sections are measured.
In this analysis and the others that have been performed so far, the finite temperature and motion of the absorbing nuclei is ignored. This is a small correction to the resonance width because for the nuclei being considered, so the absorber velocity is much lower than the neutron velocity. Assuming at 300 K, as a function of , . A procedure similar to that described in 3 (numerical integration) was used to calculate the change in as a function of change in resonance energy, but replacing the MB spectrum with spectra derived from Fig. 2. The same resonance parameters as employed in 3 were used, and the numerical integration was tested with a MB spectrum for which the same results as Fig. 1 of 3 were obtained.
It is possible to determine the value of the cross section for 149Sm, , from detailed isotopic analyses of core samples from Oklo and similarly for 155Gd to determine . Such an analysis was performed in 3 and indicates that
| (10) |
This result can be used subsequently to determine the ancient value of which can be compared to the present-day measured value.
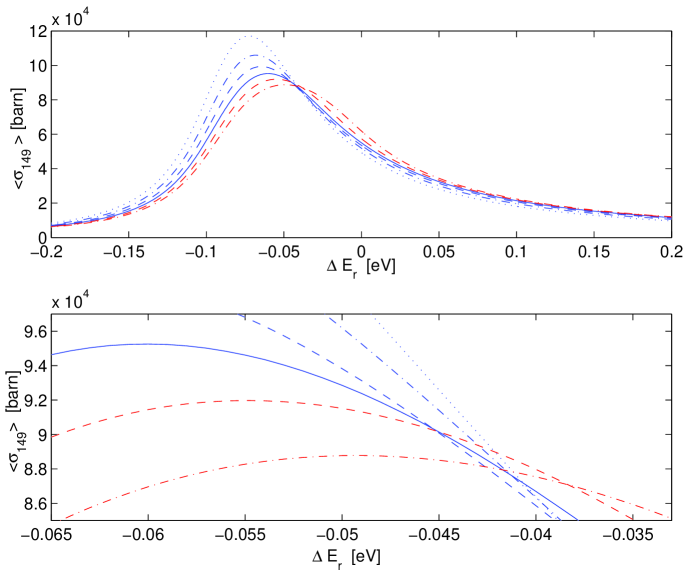
Results of the numerical integration for 149Sm are shown in Fig. 2 as a function of moderator temperature with at 300 K. In 3 , the mean temperature of the Oklo reactor was estimated to be about 600 K. From the curve for 600 K in Fig. 3 (expanded around the kb in the lower plot), we find that the change in resonance energy is
| (11) |
which indicates more than a deviation from zero. Note that the“two solution” problem does not really exist in this case, but the upper magnitude range is expanded.
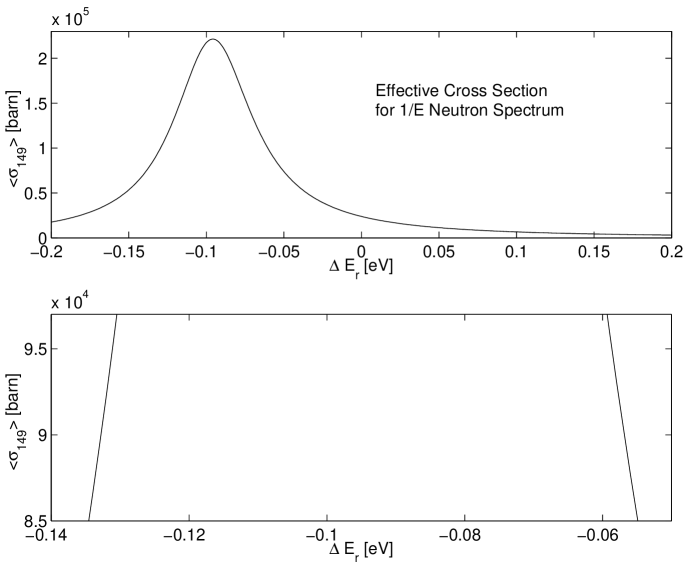
In the calculation of the moderated neutron spectrum, effects of chemical bonds (which suppress the low energy spectrum) have been approximately included. As the atoms become more tightly bound, so (), and in this limit the neutron flux spectrum becomes pure ; the result of a calculation for this case is shown in Fig. 4. In this case, for which two solutions exist,
| (12) |
This result is roughly consistent with the result; reality likely is somewhere between the 2 and results. However, the result for clearly indicates a non-zero change in at a level of more than .
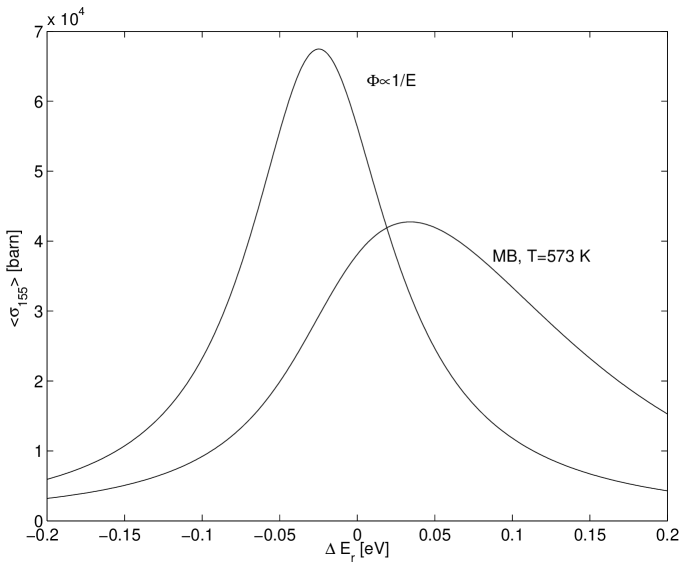
Results for a calculation of 155Gd are shown in Fig. 5. The interpretation of the 155Gd data is complicated by the presence of impurities, and an extensive analysis is given in 3 . The Oklo data imply kb, which, from Fig. 5, indicates, for the left-hand solution,
| (13) |
This is consistent with the 149Sm result because impurities shift slightly, and the simple spectrum overestimates .
IV Interpretation of the Results
A shift in resonance energy can be related to a shift in by
| (14) |
A reasonable estimate of MeV was presented in 2 , and is roughly the same for 149Sm and 155Gd. Taking the result Eq. (11) determines
| (15) |
which is non-zero by more than . The central value plus twice the upper uncertainty can be used to set a 95% confidence limit on the magnitude of the integrated rate of change over the last two billion years
| (16) |
By assuming higher temperatures, this limit decreases slightly. However, a significant modification of this result requires temperatures beyond physically reasonable values as assumed in 3 .
It is expected that the neutron absorption resonance parameters (e.g., the neutron and gamma widths), other than , do not change significantly with . In estimating it was assumed that represents a fixed energy above the ground states of nuclei with and , and is approximately the difference in the Coulomb energies of the ground states. This result is in agreement with a more sophisticated analysis 7 .
V Conclusion
If a absorber is present in the moderator of a neutron chain reactor, the neutron energy spectrum can deviate significantly from the a Maxwell-Boltzmann distribution. The Oklo phenomenon was rich in uranium which is a strong absorber. By considering realistic deviations from a Maxwell-Boltzmann low-energy neutron spectrum, we have shown that a recent analysis of the Oklo natural reactor phenomenon implies an non-zero () variation of over the last 2 billion years. The result is of opposite sign and an order of magnitude smaller than a recent astrophysical determination of the change in 8 , which is non-zero, but over a different time scale. It has been suggested that the time variation of is not monotonic 8a . Our results are probably accurate to within 20%; a full MCNP model of the reactor, assuming reasonable estimates of the temperature and impurities are possible, would be useful in light of the importance and interest in the possibility of a varying . Finally, these results might be interpreted more efficiently in terms of for which the sensitivity is about two orders of magnitude higher than the sensitivity to variation 9 .
We thank Tuan Nguyen for critical comments and in particular for clarifying the issues with the sign of the effect.
References
- (1) A.I. Shlyakhter, Nature 264, 340 (1976).
- (2) T. Damour and F. Dyson, Nucl. Phys. B 480, 37 (1996).
- (3) Y. Fujii et al., Nucl. Phys. B 573, 377 (2000).
- (4) Alvin M. Weinberg and Eugene P. Wigner, The Physical Theory of Neutron Chain Reactors (Univ. of Chicago Press, Chicago, 1958).
- (5) R.R. Coveyou, R.R. Bate, and R.K. Osborn, J. Nuclear Energy 2, 153 (1956).
- (6) O. Sushkov, private communication (2003).
- (7) M.T. Murphy et al., Monthly Not. Roy. Astro. Soc. 327, 1208 (2001).
- (8) David F. Mota and John D. Barrow, Arxiv:astro-ph/0309273. To be published, Mon. Not. R. Astron. Soc.
- (9) V.V. Flambaum and E.V. Shuryak Phys. Rev. D67, 083507 (2002); hep-ph/0212403.