LA-UR-03-4509-Rev
nucl-th/0309018
Detection of Antineutrinos for Non-Proliferation
Michael Martin Nieto,a A. C. Hayes,b William B. Wilson,c Corinne M. Teeter,d
and William D. Stanbroe
a,b,cTheoretical, dPhysics,
and eNuclear Nonproliferation Divisions,
Los Alamos National Laboratory,
University of California, Los Alamos, New Mexico 87545,
U.S.A.‡
Abstract
We discuss the feasibility of using the detection of electron antineutrinos produced in fission to monitor the time dependence of the plutonium content of nuclear power reactors. If practical such a scheme would allow world-wide, automated monitoring of reactors and, thereby, the detection of certain proliferation scenarios. For GWe power reactors the count rates and the sensitivity of the antineutrino spectrum (to the core burn-up) suggest that monitoring of the gross operational status of the reactor from outside the containment vessel is feasible. As the plutonium content builds up in a given burn cycle the total number of antineutrinos steadily drops and this variation is quite detectable, assuming fixed reactor power. The average antineutrino energy also steadily drops, and a measurement of this variation would be very useful to help off set uncertainties in the total reactor power. However, the expected change in the antineutrino signal from the diversion of a significant quantity (SQ) of plutonium, which would typically require the diversion of as little as a single fuel assemblies in a GWe reactor, would be very difficult to detect.
‡Mail stops and email addresses:
aB285, mmn@lanl.gov;
bB227, anna hayes@lanl.gov;
cB243, wbw@lanl.gov;
dD454, cteeter@lanl.gov;
eE541, wstanbro@lanl.gov
1 Background
It is widely reported that India obtained its weapons-grade plutonium by running its un-safeguarded CANDU reactors to produce Pu [1]–[3]. Prevention of the illicit production of Pu in most countries is through the imposition of an intrusive inspection regime by the International Atomic Energy Agency. This approach has proven to be quite resource intensive. More preferable would be a method to monitor continually the nuclear fuel content of reactors, thus ensuring that weapons material is not being diverted. Ideally, one wants to do this not only continuously, but also cheaply, unobtrusively, and with minimal manpower.
Related (but somewhat independent) concerns are the difficulty of determining the isotopic fuel content, for attribution, of a rogue nuclear device and the difficulty of detecting a small nuclear explosion of order 1 kton. Such a small explosion, done underground, can be concealed because of the lack of any definitive signal; for example, microseisems would mask any acoustic signature.
For all these problems electron antineutrino111 The term “neutrino” is often generically used to describe both neutrinos and their antiparticle antineutrinos, especially with respect to a “neutrino detector.” We will do the same for a detector or beam, but will try to make the distinction clear for particle processes. detection in principle offers a solution. The feasibility of using antineutrino detection has been examined in the past. In fact, the original reactor experiment which discovered the antineutrino (by Fred Reines and Clyde Cowan) was done at a reactor only after a first idea had been considered, to detect antineutrinos from a nuclear explosion at the Nevada Test Site [4]-[6].
Indeed, the technologies developed for particle physics experiments that use large neutrino detectors have added further interest in such a solution. For example, in recent times large water- [7]-[10], ice- [11]-[13], and mineral-oil-based [14, 15] neutrino detectors have become practical and relatively efficient. In fact, Supernova 1987A was seen by the Kamiokande detector in Japan [16] and the IMB detector in the USA [17]. Each detecting about 10 events, as shown together in Ref. [18].
There have been large and significant experiments on the antineutrino spectra from reactors [19, 20]. Also a well-known, ongoing neutrino oscillation experiment detects reactors from distances on the order of 100 km [21]. The idea of using a mobile nuclear submarine to do a similar experiment has been discussed [22] and the detection of radioactive antineutrinos from the Earth’s core is now feasible [23].
Further, at present there already is an ongoing experimental study [24] on the feasibility of building an antineutrino detector for reactor monitoring, a subject with its own history [25, 26]. The aim is to determine the class of safeguards problems that might be addressed. In this paper we examine some of the theoretical issues involved in trying to monitor reactor core fuel with antineutrinos.
2 Physics motivation
When a nucleus undergoes fission the unstable fission products pre-dominantly beta-decay, thus emitting antineutrinos. Fission processes mostly emit antineutrinos (as opposed to neutrinos) because the vast majority of the beta decays are from neutron rich nuclei where the underlying process is the conversion of a neutron into a proton, electron, and antineutrino:
| (1) |
On average, about 5 antineutrinos are emitted per fission. These antineutrinos are not emitted instantaneously because of the finite life-time of the fission products. However, the fact that reactor monitoring is a steady-state measurement means that time variation is not an issue. The energy spectrum of the antineutrinos ranges from zero to about 15 MeV, with an average energy of about 3 MeV. Only a very small fraction of the antineutrinos emitted have energies above 8 MeV. As an example, in Figure 1 we show the relative energy spectra of the antineutrinos from the fission of 235U and 239Pu.
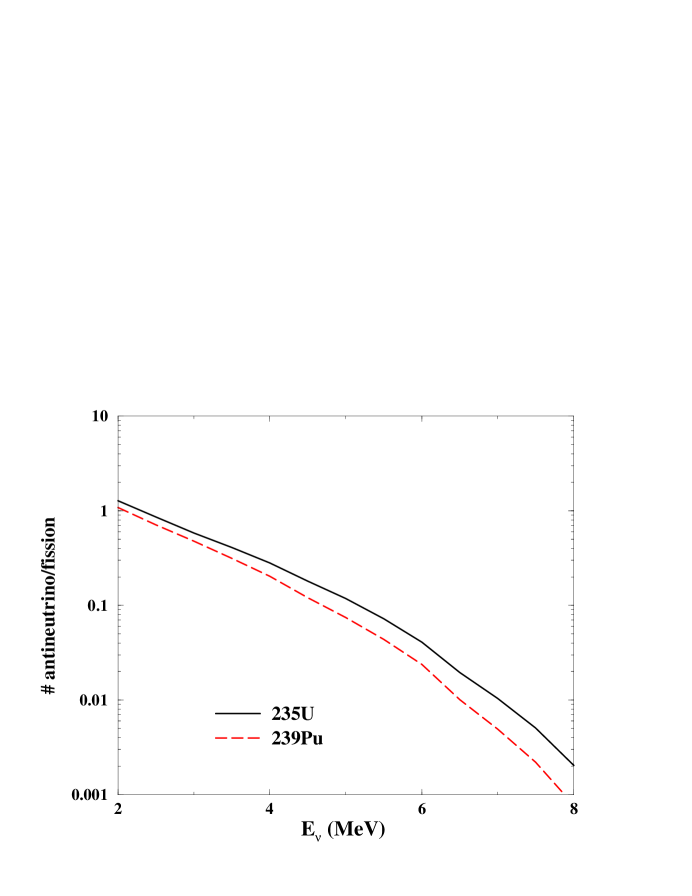
This and the other fission spectra used in this paper were calculated assuming thermal neutron induced fission for 235U, 239,241Pu and fast neutron induced fission for 238U. To obtain these results we used the England and Rider [27] evaluated cumulative fission product yields and the beta decay branching ratios and end-point energies from ENDF/B-VI [28].
The cumulative spectrum for a given nuclide involves contributions from thousands of beta decays, each associated with an unique end point energy. This cumulative spectrum is given by
| (2) |
where the are the fission product cumulative yields, are the branching fractions for the decays of nucleus (A,Z) with end-point energies , each described by an individual beta decay spectrum .
The differences in the fission products produced in the differing fissioning systems leads to a significant difference in the magnitude and shape of the respective antineutrino spectra. These differences, and the fact that the emitted antineutrinos cannot be shielded, are key to the concept of monitoring the core fuel.
Antineutrino detection occurs mainly through the antineutrino-proton charge-current reaction222 Contrariwise, neutrino detection is mainly via the opposite reaction, (3) since neutrinos tend to result from a fusion process, such as in the Sun.
| (4) |
The threshold for this reaction is 1.8 MeV and the cross section at the mean fission antineutrino energy is about cm2. When folded with the energy-dependent detection cross section (4) the detected antineutrino spectrum peaks at about 3.8 MeV. Because the interaction of neutrinos with matter is so extremely weak, the detector sizes that would be needed for projects of the type we are considering need to be either very large or able to have long measurement times, or both.333Antineutrinos can also interact with the electrons in the detector via antineutrino-electron scattering. But the event rate is orders of magnitude smaller [29], essentially because the mass factor in the cross-section equation is that of the electron [30].
3 The principles of antineutrino monitoring
We now turn to the feasibility of detecting the antineutrinos produced in fission to monitor fuel content of a functioning nuclear reactor [31], from outside the containment building. There are several classes of power reactors that need to be considered [32, 33]. But in the present work we restrict our discussion to a Pressurized Water Reactor (PWR) similar to the San Onofrie444Throughout this paper we distinguish the thermal from the electric power of a reactor using the subscripts and , respectively. For example, GWt refers to a GW of thermal power, while GWe refers to a GW of electric power. Typically, GW GWt. 3.4 GWt reactor in California, where antineutrino monitoring is presently being studied[24] (see below). We examine the predicted time-dependent antineutrino spectra for a 2.7% enriched PWR reactor. To test the sensitivity of the expected signals to the initial uranium enrichment we also examine a 4.2% enriched PWR.
A 3.4 GWt power reactor emits about antineutrinos per day. The absolute magnitude of the detected antineutrino spectrum differs for each of the actinides contributing to the total fission rate. So, the total number of antineutrinos detected changes with the relative fissioning fraction of the these isotopes in the reactor core. Thus, for a fixed reactor power, the number of detected antineutrinos is a reflection of the core burn-up.
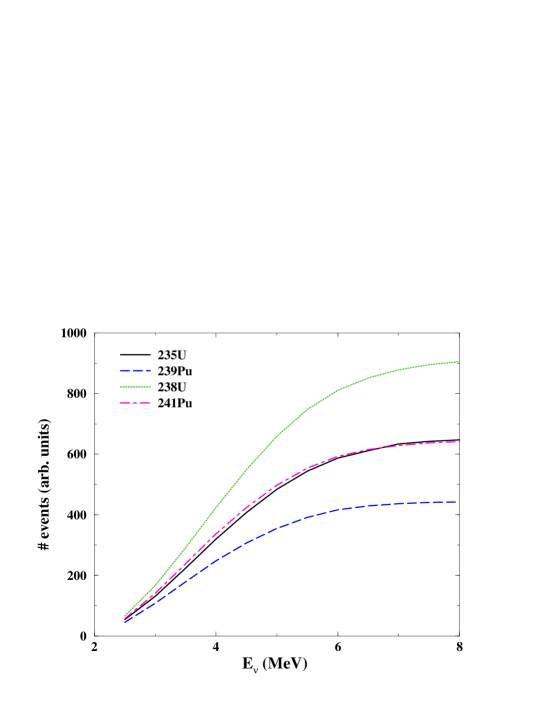
The shape of the spectrum is also a measure of the core burn-up. As shown in Figure 2, the cumulative number of antineutrinos (when folded over the detection cross section) as a function of antineutrino energy is different for each species. By comparing the number of antineutrinos with energies up to 3 MeV with the number up to 6 MeV, pure 235U and 239Pu are easily distinguishable.
The variation in the number of antineutrinos emitted with burn-up could be masked by uncertainties in the total thermal reactor power (total fission rate). Thus, if feasible, a measurement of the time-dependent shape of the spectrum or of the average antineutrino energy would provide an important independent variable for monitoring the reactor core.
A type of detector that could be used would be a portable version of the mineral-oil based liquid scintillator used in, for example, the 100 ton LSND neutrino oscillation experiment [14] and the follow-up MiniBooNE experiment [15]. The Sandia/Livermore collaboration [24] is currently testing a prototype neutrino detector of this type. For a 1 cubic meter liquid scintillator detector situated 24 m from the core of a 3.4 GWt reactor, Bernstein et al. [24] expect a healthy signal of 2740 antineutrino events per day.
The questions that we attempt to address here are:
-
•
What are the expected isotopic contributions to the fission rate as a function of time?
-
•
what are the corresponding antineutrino spectra and how well do they reflect the fuel burn-up?
-
•
what are the expected changes in the antineutrino spectra for different fuel diversion scenarios?
-
•
and what detection accuracy is required to safeguard against these?
To address these questions we examined a 2.7% and a 4.2% enriched uranium PWR. The 2.7% PWR corresponds to a 3 year discharge neutron exposure of 30 GW days per metric ton of uranium (GWd/MTU), whereas, the 4.2% enriched fuel corresponds to a neutron exposure of twice that in its lifetime. The temporal results were taken from earlier coupled calculations with the ERPI/CELL and CINDER-2 codes [34, 35].
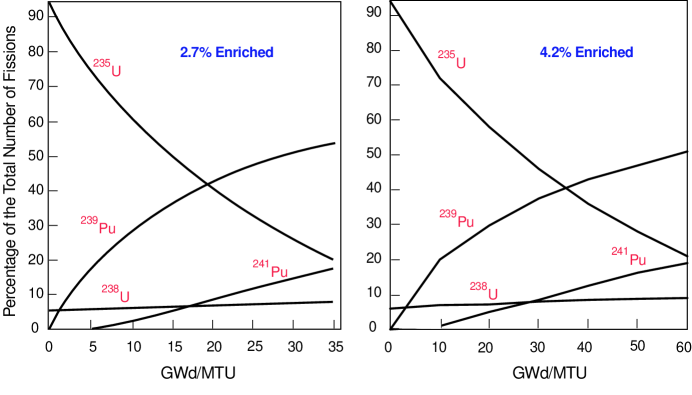
In Figure 3 we show the fission history for the 2.7% enriched (97.3% 238U, 2.7% 235U) and the 4.2% enriched (95.8% 238U, 4.2% 235U) reactors. As can be seen, the percentage of the total fission from 235U steadily drops as a function of time while that from 239Pu steadily increases. Apart from the factor of two difference in the exposure times, the fission histories for the two different enrichments are very similar.
The results of all our other calculations for the antineutrino spectra for the two different fuel enrichments are also very similar. Therefore, for the remainder of this paper we will show only those results obtained for the 2.7% enriched case. So, for example, our conclusions on antineutrino monitoring apply equally well to the 4.2% enriched fuel, with the understanding that exposure times should be approximately doubled.
After about 3 years burning (30 GWd/MTU) the fuel has an actinide isotopic composition of (95% 238U, 1% 235U, 1% 239Pu, 3% heavier actinides including 240,241Pu), with the fission fuel contributing to the total fraction of fissions as shown in Fig. 3.
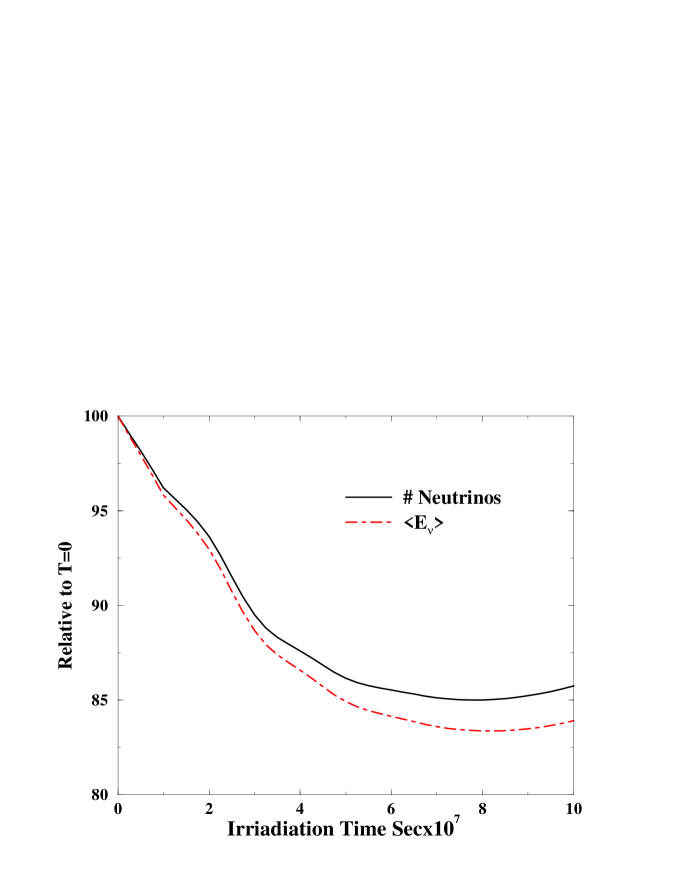
As the 239Pu accumulates in the reactor, it also captures neutrons to produce 240Pu, which in turn captures neutrons to produce 241Pu. The optimum time for clandestine extraction would therefore depend on the plutonium isotopic ratios desired. The maximum plutonium content is after 3 years exposure. However, 240Pu has some undesirable nuclear properties from a weapons point of view, and better grade plutonium is obtained by removing the plutonium before a cycle is completed. Over the fuel life-time the steady increase in the fission fraction from 239Pu translates into a steady decease in the number of antineutrinos emitted and in the average antineutrino energy, Fig 4. The spectrum of emitted antineutrinos by fissioning 241Pu does not differ significantly from 235U. Thus, after about 1.5 years the number of antineutrino emitted begins to level off as the 241Pu starts to build up.
4 Monitoring fuel content of a running reactor
The situation described in Fig 4 is for fresh enriched uranium irradiated over a three year period. This differs from the actual situation for a normal PWR burning in equilibrium, where the fuel is cycled annually. A large pressurized light water reactor has about 240 fuel assemblies, of which 80 are replaced at the end of each cycle, and the assemblies are then shuffled in their location. When the reactor is running in equilibrium at the beginning of each fuel cycle, one third of the fuel is fresh enriched uranium, one-third has been irradiated for one cycle and one-third for two cycles. At the end of the cycle one-third of the fuel has been irradiated for three cycles and is removed and replaced with fresh fuel. Each fuel assembly typically contains one-half ton of fuel. Therefore, in three years about 5 kg of plutonium will be produced in each assembly of normal fuel.
As the reactor operates in equilibrium, from the beginning of a cycle to the end of a cycle. the change in the antineutrino spectrum is a steady (but less steep) drop in the number of antineutrinos emitted as the 239Pu builds up. For a 2.7% enriched uranium PWR the drop in the number of antineutrinos is about 5% in one cycle. When the discharged fuel is replaced with fresh fuel, the antineutrino event rate jumps to its ‘start of cycle’ value. However, it is important to note that monitoring the reactor core fuel burn-up through the time-dependent change in the antineutrino spectrum requires independent knowledge of the reactor power. Otherwise the expected 5% change in the antineutrino spectrum might be masked by unrecorded fluctuations in the total power.
Typical diversion scenarios would likely involve the diversion of an entire fuel assembly and replacement with fresh fuel. In principle, a single assembly would contain enough plutonium to make a nuclear weapon. An unannounced removal of 1-2 additional fuel assemblies at the same time that other scheduled work was being carried out would require an accuracy in the antineutrino detection rate of better than 1%. The detection of this type of change would be a much more difficult task than observing the 5% change in the magnitude of the spectrum over one fuel cycle.
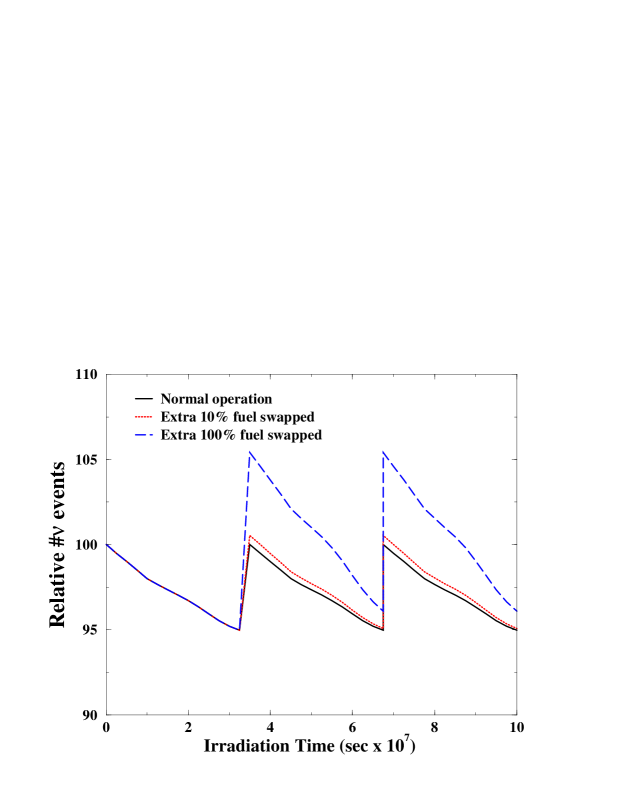
In Fig. 5 we compare the expected time-dependent antineutrino count rate under normal operation of a 2.7% PWR with that expected for a significant fuel diversion. In this latter case we have assumed that an additional unannounced 10% of the fuel was replaced during a scheduled fuel cycle management. The solid curve shows the relative change in the number of events on normal fuel management, i.e., at the end of the fuel cycle the discharged fuel is removed and at the start of the next cycle the core consists of 1/3 fresh 2.7% uranium fuel, 1/3 fuel irradiated for 1 cycle, and 1/3 irradiated for 2 cycles. The dotted curve shows a realistic and significant violation of their safeguards obligations in which an additional unreported 10% of the 2 cycle-irradiated fuel has been replace with fresh fuel. In this case the start of the new cycle involves a core with 37% fresh 2.7% enriched uranium, 33% 1 cycle irradiated fuel, and 30% 2 cycle irradiated fuel. We note, that the typical shutdown time of 1 month during fuel management is not included in Fig. 5.
In contrast to the above 10% diversion of the fuel scenario, gross diversions of fuel or gross deviations in the reactor operation from that announced would likely lead to quite detectable changes from the expected antineutrino spectrum. The long-dashed curve in Fig. 5 represents the expected number of antineutrino in the case that 2/3 (as opposed to the regular 1/3) of the irradiated fuel is replaced at the end of a cycle. In this scenario, at the start of the new cycle the core would consist of 2/3 fresh 2.7% uranium and 1/3 1 cycle irradiated fuel. This gross misuse of the reactor would lead to a 10% shift in the antineutrino count rate, to be compared with the 5% change expected under normal fuel-cycle management.
All the calculations presented above for the expected changes in antineutrino spectra assume that our reactor burn-up and antineutrino spectra calculations assume no uncertainties. This, of course, is not the case. Uncertainties in the calculated inventories of the four important fissioning materials (235,238U, 239,241Pu) compared with the inventories measured [35] for a range of fuels indicate that these inventory calculations are accurate to better than a few percent.
However, the inventories of total core radionuclides is of limited extent and the uncertainties large. This precludes a determination of the uncertainties on inventories of the important fission products that contribute to the aggregate beta and antineutrino spectrum. For these, inventories calculated by CINDER and ORIGEN can deviate by more than 10% in several cases. The accuracy with which reactor core burn-up and the corresponding antineutrino spectrum can be monitored is best determined by a comparison between calculated expectations and experimental observations of the time-dependent change antineutrino spectrum for a known reactor.
The ongoing work at the San Onofrie reactor [24] could provide ideal data for a comparison between theory and experiment. However, even though large reactor detectors for neutrino oscillation experiments, such as CHOOZ [19], have measured the energy dependence of the antineutrino spectrum quite well, small detectors of the San Onofrie size ( m3) will be unlikely to provide the desired information on the antineutrino spectral shape. Since, as discussed, the difference in the detected antineutrino energy spectral shape for 235U and 239Pu is quite significant, such information would be very important in monitoring the fuel content of a reactor.
For smaller reactors ( 10 MW) a greater fraction of the fuel would need to be diverted at one time. In assessing the feasibility of using antineutrino detection for such reactors there is a trade off between the smaller number of fissions per day (and hence the number of detectable antineutrinos) and the larger change in the spectrum. Antineutrino detection also presents itself as a possibly useful means of monitoring hot spent fuel [36].
5 conclusions
Antineutrino monitoring of reactors can provide unique information on the burn-up in the core from outside the containment vessel. If accurate knowledge of the reactor power is known through an independent measurement, the variation of the number of detected antineutrino events reflects the build-up of plutonium. Thus, antineutrino monitoring could be used to detect gross deviations from the declared operational mode of a reactor. A measurement of the average anti-neutrino energy or of the shape of the spectrum would provide valuable additional information and would greatly reduce uncertainties in relating the antineutrino spectrum to core burn-up. However, the magnitude of the expected change in the antineutrino count rate of less than 1% in the case of the diversion of a critical mass of plutonium suggests that antineutrino monitoring is unlikely to be sensitive to this class of safeguards.
Acknowledgments
We thank Adam Bernstein, James E. Cahalan, Stacey Eaton, Jim Friar, Giorgio Gratta, Tom Kunkle, John Learned, Chris Morris, Vern Sandberg, and Steve Sterbenz for helpful comments and questions. This work was supported by the United States Department of Energy.
References
- [1] D. Albright and M. Hibbs, “India’s Silent Bomb,” Bull. Atomic Scientists 48 (1992) 27-31.
- [2] G. S. Bhargava, “Nuclear Power in India,” Energy Policy 20 (1992) 735-743.
- [3] http://www.globalsecurity.org/wmd/world/india/trombay.htm
- [4] F. Reines and C. Cowan, Jr., compilation of papers as “The Reines-Cowan Experiments – Detecting the Poltergeist,” Los Alamos Science, No. 25 (1997) 4-27. http://lib-www.lanl.gov/documents/g/00326606.pdf
- [5] C. Sutton, Spaceship Neutrino (Cambridge University Press, Cambridge, 1992) p. 38 ff.
- [6] The Reines-Cowan experiment was actually approved and funded out of the Theoretical Division at Los Alamos.
- [7] S. Fukuda et al., “Constraints on Neutrino Oscillations Using 1258 Days of Super-Kamiokande Solar Neutrino Data,” Phys. Rev. Lett 86 (2001) 5656-5660.
- [8] Y. Gando. et al., “Search for from the Sun at Super-Kamiokande-I,” Phys. Rev. Lett. 90 (20030 171302/1-5.
- [9] Q. R. Ahmad et al., “Measurement of the Rate of Interactions Produced by Solar Neutrinos at the Sudbury Neutrino Observatory,” Phys. Rev. Lett. 87 (2001) 071301-1/6.
- [10] Q. R. Ahmad et al., “Direct Evidence for Neutrino Flavor Transformation from Neutral-Current Interactions in the Sudbury Neutrino Observatory,” Phys. Rev. Lett. 89,(2002) 011301/1-6.
- [11] C. Wiebusch et al., “Results from AMANDA,” Mod. Phys. Lett. A 17 (2002) 2019-2037.
-
[12]
The upgrade AMANDA II neutrino telescope has just
produced the first high-energy-neutrino map of the sky. Go to
http://www.news.wisc.edu/newsphotos/amanda.html - [13] A. Goldschmidt et al., “Scientific Goals of the IceCube Neutrino Detector at the South Pole,” Nucl. Phys. B, Proc. Suppl. 110 (2002) 516-518.
-
[14]
W. Louis, V. Sandberg, H. White, and D. Kestenbaum,
“A Thousand Eyes – The Story of LSND,”
Los Alamos Science, No. 25 (19997) 92-115.
http://lib-www.lanl.gov/documents/g/00326610.pdf - [15] B. T. Fleming, L. Bugel, E. Hawker, S. Koutsoliotas, S. McKenney, V. Sandberg, and D. Smith, “Photomultiplier Tube Testing for the MiniBooNE Experiment,” IEEE Trans. Nucl. Sci. 49, no. 3, pt. 2 (2002) 957-62.
- [16] K Hirata et al., “Observation of a Neutrino Burst from the Supernova SN1987A,” Phys. Rev. Lett. 58 (1987) 1490-1493.
- [17] R. M. Bionta et. al., “Observation of a Neutrino Burst in Coincidence with Supernova 1987A in the Large Magellanic Cloud,” Phys. Rev. Lett. 58 (1987) 1494-1496.
- [18] S. E. Woosley and M. M. Phillips, “Supernova 1987A!” Science 240 (1988) 750-759.
- [19] M. Apollonio et al., “Limits on Neutrino Oscillations from the CHOOZ Experiment,” Phys. Lett. B 466 (1999) 415-430.
- [20] F. Boehm et al., “Final Results from the Palo Verde Neutrino Oscillation Experiment,” Phys. Rev. D 64 (2001) 112001/1-10.
- [21] K. Eguchi et al., “First Results from KamLAND: Evidence for Reactor Antineutrino Disappearance,” Phys. Rev. Lett. 90 (2003) 021802-1/6.
- [22] J. Detwiler, G. Gratta, N. Tolich, and Y. Uchida, “Nuclear Propelled Vessels and Neutrino Oscillation Experiments,” Phys. Rev. Lett. 89 (2002) 191802/1-4.
- [23] G. Fiorentini and A. Pasclini, “Journey to the Centre of the Earth,” CERN Courier 43, No. 8 (2003) 20-22. http://www.cerncourier.com/main/article/43/8/12
- [24] A. Bernstein, Y. Wang, G. Gratta, and T. West, “Nuclear Reactor Safeguards and Monitoring with Antineutrino Detectors,” J. Appl. Phys. 91 (2002) 4672-4676.
- [25] S. Ketov, Yu. Konnov, V. Kopeikin, L. Mikaelyan, and V. Sinev, “Remote Monitoring of a Reactor’s Power Output by Its Neutrino Radiation as a Possible Means of Safeguarding Nuclear Materials at Power Plants,” in: Proc. Int. Symp. on Nucl. Mater. Safeguard., IAEA, VIENNA 10-14 Nov. 1986. IAEA-SM-293/62, Vol. 2 (1987) 139.
- [26] V. Kopeikin, L. Mikaelyan, and V. Sinev, “Spectrum of Electronic Reactor Neurinos,” Phys. Atomic Nuc. 60 (1997) 172-176.
- [27] T. R. England and B. F. Rider, “Evaluation and Compilation of Fission Product Yields”, Los Alamos report LA-UR-94-3106 (1994), 173 pp. Evaluated Nuclear Data File [28] document ENDF-349.
-
[28]
ENDF is the Evaluated Nuclear Data File data base and, in particular,
“Contains nuclear reaction data (neutron cross-sections and others) from
main regional and national evaluated data libraries (ENDF/B-6, USA; JEF-2,
NEA; CENDL-2, China; JENDL-3, Japan; and BROND-2, Russia).” Go to:
http://www.iaea.or.at/databases/dbdir/db12.htm - [29] J. N. Bahcall, M. Kamionkowski, and A. Sirlin, “Solar Neutrinos: Radiative Corrections in Neutrino-Electron Scattering Experiments,” Phys. Rev. D 51, (1995) 6146-6158.
- [30] G. ’t Hooft, “Prediction for Neutrino-Electron Cross-Sections in Weinberg’s Model of Weak Interactions,” Phys. Lett. B 37 (1971) 195-196.
- [31] S. Glasstone and A. Sesonske “Nuclear Reactor Engineering,” 4th ed., 2 Vols. (Chapman & Hall, New York, 1994).
-
[32]
The International Nuclear Safety
Center at Argonne (INSC) has a reactor database
available on-line, via registered use, at http://www.insc.anl.gov/
There is also a map showing the locations
of power reactors. Go to
http://www.insc.anl.gov/pwrmaps/map/world map.php - [33] The Nuclear Energy Institute (NEI) has information on power plants all over the world. Go to http://www.nei.org/ and click on Nuclear Data. Power plant links are from there.
- [34] W.B. Wilson, T.R. England, O.Ozer, and D.E. Wesson, “Actinide decay Power,” Trans. Am. Nucl. Soc. 32 (1979) 737.
- [35] W. B. Wilson, T.R. England, R.J. LaBauve, J.A. Mitchell, “calculated Radionuclide Inventories of High-Exposure LWR Fuels”, Nuclear Safety, 29 91988) 177.
- [36] S. Eaton, A. Nichols, and S. Voss, “Nuclear Diversion Database: Summary of Statistical Trends,” Los Alamos report LA-CP-01-508.