Description of the particle ratios and transverse-momentum spectra for various centralities at RHIC in a single-freeze-out model
The single-freeze-out model of hadron production is used to describe the particle ratios and the transverse-momentum spectra from RHIC. The emphasis is put on the new measurements done at the highest beam energy of =200 GeV. An overall very good agreement is found between the data and the model predictions. The data for different centrality windows are analyzed separately. A simple scaling of the two expansion parameters of the model with the centrality is found. Interestingly, this scaling turns out to be equivalent to the scaling of hadron production with the number of wounded nucleons.
keywords:
ultra-relativistic heavy-ion collisions, statistical models, hadron gas, , and
a The H. Niewodniczański Institute of Nuclear Physics, ul. Radzikowskiego 152, PL-31342 Kraków, Poland
b Institute of Physics, Świȩtokrzyska Academy, ul. Świȩtokrzyska 15, PL-25406 Kielce, Poland
PACS: 25.75.Dw, 21.65.+f, 14.40.-n
1 Introduction
Ultra-relativistic heavy-ion collisions offer a unique possibility to produce hot and dense hadronic matter in laboratory conditions. With the new results presently coming from RHIC [1, 2, 3] we have entered an exciting era when various model predictions and theoretical ideas may be confronted directly with the large amount of diverse and accurate data. One of the key issues in the field is the question of the degree of thermalization of the hadronic matter produced in heavy-ion collisions. From the outset of the heavy-ion physics the thermal models have been useful and successful to a large degree in the description of data [4, 5, 6, 7, 8, 9, 10, 11, 12, 13, 14, 15, 16, 17] (for a recent review see [18]).
In this paper we analyze the hadron production at mid-rapidity measured at RHIC at the full beam energy of =200 GeV within the single-freeze-out model of Ref. [19, 20, 21]. The new element of this work is the application of the approach to data at various values of the centrality parameter, (or the impact parameter, ), which allows us for a closer look at the geometry and flow of the hadronic system formed in non-central collisions. The obtained systematics for the geometric parameters as functions of is very interesting, as it conforms to the wounded-nucleon scaling [22, 23, 24]. We find that the invariant time at freezeout, , and the transverse size, , behave in a very systematic way for not-too-large values of . In particular , and .
The single-freeze-out model was formulated in Ref. [19, 20, 21] where it was successfully used to describe the transverse-momentum spectra of hadrons measured at the then-available lower beam energy of =130 GeV. The model combines a typical thermal approach, used to study the ratios of hadron abundances [4, 5, 6, 7, 8, 9, 10, 11] with a hydrodynamic expansion including in a natural way the longitudinal and transverse flow. A characteristic and important feature of the model is the complete treatment of the resonances in both the calculation of the ratios of hadron yields and the analysis of the spectra. The model and the data at =130 GeV, including strange-quark particles such as , , , , as well as , have been found to be in a surprising agreement [20]. A comparison of the model predictions with the data for particle abundances and transverse-momentum spectra, collected at the maximum RHIC energy of 200 GeV and presented in detail in this paper, bring further evidence for rapid thermalization, or a statistical nature, of the hadronic matter produced at mid-rapidity in heavy-ion collisions. Moreover, with our simple approach we form a basis for the explanation of most of the soft features of the hadron production observed at RHIC.
The paper is organized as follows: In the next Section we outline the main assumptions of the model, bringing up for completeness some of the basic material of Refs. [19, 20, 21]. In Sect. 3 we study the ratios of hadron yields at GeV and find the thermodynamic parameters characterizing the freeze-out. In Sect. 4 we calculate the transverse-momentum spectra. The calculations are done for different centrality windows, such as defined by the experiment. Naturally, since the geometry of the hot system formed in the collision depends on the centrality, we find a dependence of the geometric/expansion parameters on . Interestingly, this dependence reflects quite accurately, for not too large , the scaling of hadron production with the number of wounded nucleons.
2 The single-freeze-out model
In our previous work [12, 19, 20, 21] we have shown that with the complete treatment of hadronic resonances, the distinction between the traditionally considered two freeze-outs, the chemical and the thermal (or kinetic) one (see the following discussion), is not necessary. At least for the RHIC energies one can achieve a very good explanation of the soft part of the hadronic data by assuming a single freeze-out which takes place at the universal temperature
| (1) |
Clearly, a theoretical description of the whole duration of the collision process of the two ultra-relativistic heavy ions is difficult, since different degrees of freedom are important at various stages of the evolution. Consequently, one is forced to describe each stage within a different theoretical framework. In our approach we use only hadronic degrees of freedom and thus concentrate on the latest stages of the evolution of the system, namely when the hadrons, at some instant, cease to interact and stream freely to the detectors. This moment is called the freeze-out. Admittedly, this is a far-reaching simplification. Generally speaking, the freeze-out in itself may be a complicated process, involving duration in time, and a hierarchy where different kinds of particles and different reactions switch off at different times. In general, by kinetic arguments, one expects that reactions with lower cross sections switch off at higher densities/temperatures, while those with larger cross sections last longer. Since, in most cases, the elastic cross sections are larger than the inelastic ones (a counter example, though, is the interaction), one expects that the inelastic (or chemical) freeze-out occurs earlier than the thermal freeze-out. On these grounds one may also argue that strange (or charmed [25]) particles decouple earlier than other hadrons. With such a picture in mind one may “separate” the freeze-out process into a series of more specific freeze-outs associated to particular reaction channels. In fact, the works of Heinz and collaborators [26] introduced the concept of the chemical and the thermal (or kinetic) freeze-outs, with . At the chemical freeze-out the inelastic interactions between the hadrons cease, and the chemical composition of the system is fixed. Later, only the elastic interactions are effective, leading to further cooling of the system. At the thermal freeze-out even the elastic interactions become ineffective and the hadrons are completely decoupled from each other.
One should bare in mind, however, that the scales in the system responsible for the thermalization and expansion are of similar order. To be more precise, for expanding systems the criterion for the thermal freeze-out to occur is [27]
| (2) |
with
| (3) |
With our parameterization for the expansion profile we obtain , while Ref. [27] gives at . Thus the discussion on the validity of our approach (early thermal freeze-out) as opposed to approaches having later thermal freeze-out becomes a discussion concerning the precise value of the factor in the criterion of Eq. (2). It is possible that already at the moment of hadronization the system is so dilute and possesses such a strong flow that not only inelastic, but even the elastic processes can be neglected. Thus our main assumption of Eq. (1) may be, in the least, a good starting point. At any case, assumptions of a phenomenological model like ours are verified a posteriori by the experiment. As we have shown in Refs. [19, 20, 21] and will also demonstrate in this work for the full RHIC energy of GeV, we are in a rather comfortable situation. The single-freeze-out hypothesis, when combined with expansion, offers a very economic description of the data, with very few parameters (two universal thermal parameters and two geometric parameters for each centrality bin).
An experimental argument in favor of a short time between the chemical and kinetic freeze-outs has been provided by the observation of resonances, such as the or , by the STAR Collaboration [28, 29, 30], in the invariant-mass spectra. In the thermal approach the abundance of these resonances is compatible with a high freeze-out temperature, around 160 MeV. On the other hand, if the elastic scattering processes ( for the or for the ) took place for a much longer time, such that the system would cool off significantly, the abundance of the resonances would be much lower. We should point out that the scenario of a single freeze-out, put forward in Ref. [19], is compatible with the sudden hadronization scenario of Ref. [31].
Thus, our starting point is the hypothesis (1). Similarly to other thermal models of hadron production, we fix the value of , and also the value of the baryon chemical potential , by fitting the ratios of hadron abundances. The results of such an analysis will be presented in the next Section.
The assumption of the single freezeout allows us to calculate uniformly, i.e. within the same model, both the ratios of hadron abundances and the transverse-momentum spectra. In order to do this, however, we need to make a choice of the freeze-out hypersurface (i.e. a three-dimensional volume in the four-dimensional space-time) and of the four-velocity field of expansion at the freeze-out. A priori, since we do not consider dynamics of the earlier stages here and only make an educated guess, many choices are possible and for each particular case one may check the validity of the proposed form of the hypersurface and flow by confronting the output of the model calculations to the data. Our choice has been made in the spirit of the hydrodynamic calculations of Ref. [32, 33, 34, 35, 36, 37, 38, 39, 40, 41], and is defined by the condition
| (4) |
To make the transverse size of the fire-cylinder,
| (5) |
finite, we impose the condition
| (6) |
In addition, we assume that the four-velocity of the hydrodynamic expansion at freeze-out is proportional to the coordinate (Hubble-like expansion),
| (7) |
Such a form of the flow at freeze-out, as well as the fact that and coordinates are not limited and appear in the boost-invariant combination in Eq. (4), imply that our model is boost-invariant. In view of the recent data delivered by BRAHMS [42], this assumption turns out to be justified for the description of particle production in the rapidity range , where the variation of the observed particle multiplicities is moderate.
We note that the freeze-out hypersurface and the flow are jointly controlled by the parameters and . Hence, our model has altogether only four parameters (dependent on the colliding energy and the centrality parameter), namely, the two thermodynamic parameters, and , and the two expansion (geometric) parameters, and . The thermodynamic parameters turn out to depend on the centrality bin very weakly, reflecting the very weak observed dependence of the particle ratios. On the other hand, the geometric parameters do depend on and their dependence, obtained from independent fitting, assumes a very intuitive form (cf. Sect. 6).
Other choices for the freezeout hypersurface and expansion have been investigated in the literature [43], with a recent study made in Ref. [44], where a class of parameterizations has been tested with a limited number of resonances included.
| Model | Experiment | ||||
| Fitted thermal parameters | |||||
| [MeV] | 165.6 | ||||
| [MeV] | 28.5 | ||||
| [MeV] | 6.9 | ||||
| [MeV] | -0.9 | ||||
| 0.2 | |||||
| Ratios used in the thermal analysis | |||||
|
|||||
|
|||||
|
|||||
| [53] (0 - 5%) | |||||
| [53] (0 - 5%) | |||||
| [54] (0 - 10%) | |||||
| [54] (0 - 10%) | |||||
All resonances from the Particle Data Tables [45] have been included in our study. The method and necessary formulas that describe the decays in cascades can be found in Ref. [21]. We stress the important role of including the high-lying states, which although thermally suppressed, are increasingly numerous according to the Hagedorn hypothesis [46, 47, 48, 49]. Moreover, the inclusion of resonances is crucial for the description of the -spectra, as it increases the logarithmic slope as if lowering the temperature [12]. This observation works in favor of the hypothesis (1).
3 Particle ratios
For boost-invariant systems the ratios of hadron abundances at mid-rapidity are equal to the ratios of hadron densities (for a more detailed discussion of this point, which includes the effects of the resonance decays, see Ref. [21]). Using this property, we can determine thermodynamic parameters of our model directly from the study of the ratios of hadron abundances. We stress that we have only two independent thermodynamic parameters in our model: the temperature, , and the baryon chemical potential, . The other two chemical potentials () are fixed by the conditions that the initial strangeness of the system is zero and that the ratio of the baryon number to the electric charge is the same as in the colliding nuclei. This assumption could be lifted at the expense of carrying an extra parameter. However, in practice this is irrelevant, since the value of turns out to be very small and the effects of the isospin violation can be neglected.
In Table 1 we show the results of our fit to the RHIC data collected at = 200 GeV. We include here only the stable hadrons (with respect to strong interactions) and use the most central data. The values of and shown in Table 1 have been fitted with the method to the experimental data listed in the third column. We stress a very good quality of the fit, reflected by the low value of per degree of freedom. An interesting feature of our fit is the stable value of the temperature, when compared to other fits done at lower energies. The optimum value of is practically the same as that found in the analysis of the RHIC data at = 130 GeV, and (within errors) it is the same as the temperature found at the top-energy collisions at CERN SPS [55].333The similarities of the SPS and RHIC spectra are discussed in Ref. [56]. On the other hand we observe a clear drop of the baryon chemical potential, from 41 MeV found at = 130 GeV down to 29 MeV found in the present calculation. A smaller value of the baryon chemical potential is a simple consequence of the observed increase of the ratio with the beam energy. At mid-rapidity, the ratio asymptotes to unity with the increasing beam energy. We note the values of parameters shown in Table 1 are compatible within the statistical errors wit the results of Braun-Munzinger, Redlich, and Stachel [18], who obtain MeV and MeV.
4 Spectra
Let us turn now to the study of the transverse-momentum spectra of hadrons. They are calculated with the help of the Cooper-Frye [57, 58] formula,
| (8) |
where the distribution function includes the products of the resonance decays (more details on the construction of in the presence of the resonance decays have been given in Refs. [20, 21]). The element of the hypersurface, , is defined as
| (9) |
where , , , , and is the Levi-Civita tensor. Introducing a convenient parameterization [37]:
| (10) |
one finds
| (11) |
hence the four-vectors and are parallel. This feature is special for our modeling of the freeze-out, see Eqs. (4) and (7), and allows us to represent the spectra in a compact form given by Eq. (8). With the use of the parameterization (10) we further rewrite Eq. (8) in the form
| (12) |
where
| (13) |
We note that is the rapidity of the fluid element, , and describes the transverse size of the system, .
The maximum and average transverse-flow parameter is given in our model by the equations
| (14) |
Since the ratios of hadron abundances depend very weakly on the centrality of the collision, we regard our thermodynamic parameters and as universal. On the other hand, the two geometric parameters may be different for each centrality class. From the obvious reasons we expect that and are larger for more central events or, in other words, they are decreasing functions of the centrality, , defined by the formula
| (15) |
where is the impact parameter and is the total inelastic cross section for the colliding gold nuclei (for a discussion of the validity of this simple geometric relation see Ref. [65]). For various centrality bins we fit the geometric parameters with the help of the method, i.e. we minimize the expression
| (16) |
where is the n-th measured value of the transverse-momentum spectrum, is the corresponding value calculated in our model, and is the error. Observing the differences between the points measured by different experimental groups we conclude that the systematic errors are much larger than the statistical errors. Therefore, we assume that is determined by the systematic uncertainties and take .444 We note that the method was also used to determine the values of the two thermodynamic parameters in Sect. 3. Since the thermodynamic parameters are sensitive only to the ratios of hadron abundances our fitting of the four parameters , , , and can be done in two steps: first we determine and , and having fixed these two values we determine later and . One could follow also a different path by fitting simultaneously the four parameters to the experimental spectra.
5 Most central events
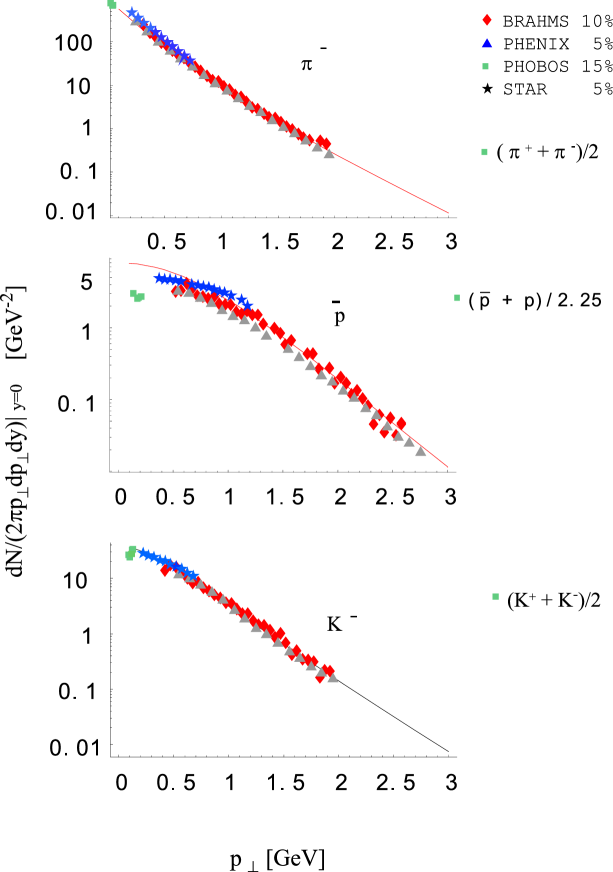
In Fig 1 we show the result of our fit to the transverse-momentum spectra of and , for the most central events measured by the four RHIC experiments 555Most of the data shown in our figures were digitized from the available plots with preliminary experimental results. (exceptionally, the data of PHOBOS are for the mixtures of negative and positive hadrons). In this case, the centrality class of the BRAHMS and PHOBOS data is 10%, whereas the centrality class of the PHENIX and STAR data is 5%. Our model curves for and , shown in Fig. 1, are simultaneous fits to the four experimental spectra available for each hadron species. The fitted values of the geometric parameters are in this case = 7.58 fm and = 7.27 fm (see Table 2 for a complete list of the values of the geometric parameters found for different experimental situations). We observe that these numbers are similar to those found in our previous study of the RHIC data collected at a lower energy of = 130 GeV, = 7.66 fm and = 6.69 fm [19, 20]. This weak dependence of our geometric parameters on the energy of the colliding ions is reminiscent of the very weak energy dependence of the measured transverse HBT radii and [61, 62, 63, 64].
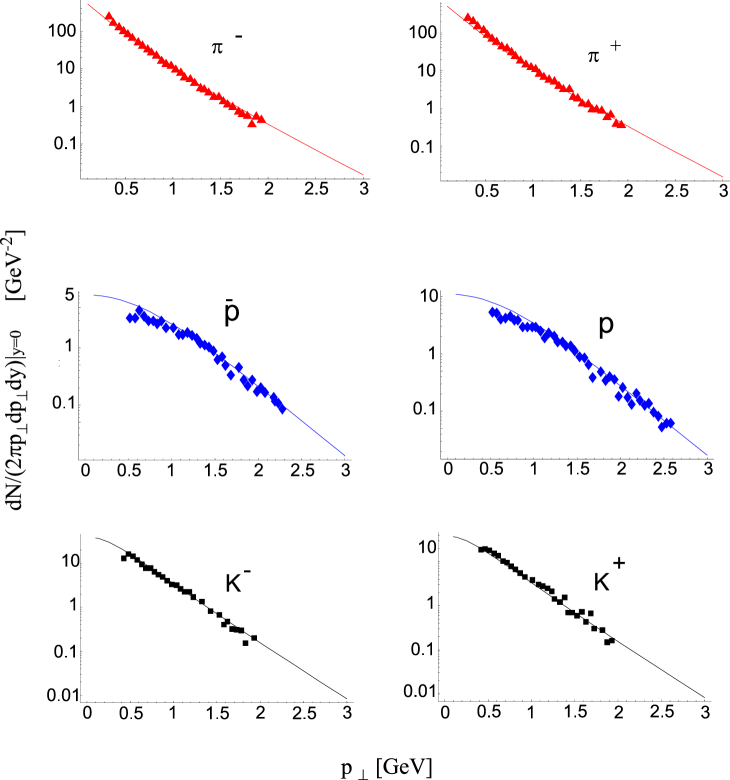
In Fig. 2 we show our fit to the most central BRAHMS data only [42]. In this case the fitted values of the geometric parameters are fm and fm. These values are consistent with the previous values obtained from the “mixed” input. In Figs. 1 and 2 we can see that our model curves describe the data very well in the large range of stretching up to about 2 GeV.
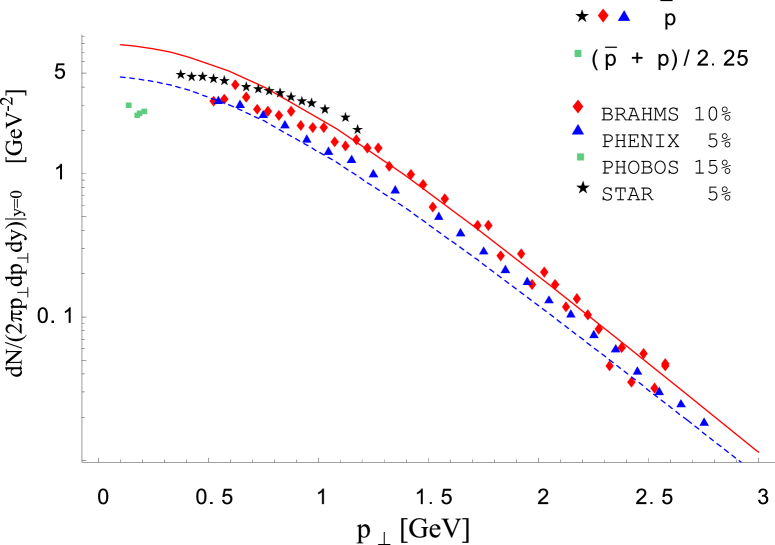
A closer inspection of Figs. 1 and 2 shows that our model curve tends to overestimate the spectra of antiprotons at small values of . To study the possible origin of this effect, in Fig. 3 we show in detail the antiproton spectra measured by different experimental groups. One can see that the experimental spectra differ substantially from each other and, in practice, one cannot fit all four groups of the experimental points simultaneously. The most likely reason for such differences are difficulties connected with the correct estimate of the role of the weak decays, or with fixing the normalization. Our model calculations shown in Fig. 3 indicate that the effect of the weak decays on the antiproton spectrum is indeed important. The solid line represents our result obtained in the case where the antiprotons are fed by the weak decays. This curve may be treated as the upper limit for the spectrum. On the other hand, the dashed line represents our result with no feeding included, and may be treated as the lower limit. We can see that most of the experimental points, except for those of PHOBOS, lie in the band enclosed with our two curves.
| [%] | [fm] | [fm] | |||
| PHENIX + | |||||
| STAR + | |||||
| PHOBOS + | |||||
| BRAHMS | |||||
| BRAHMS | |||||
| STAR | |||||
| PHENIX | |||||
| PHENIX + STAR | |||||
6 Centrality dependence of the geometric parameters
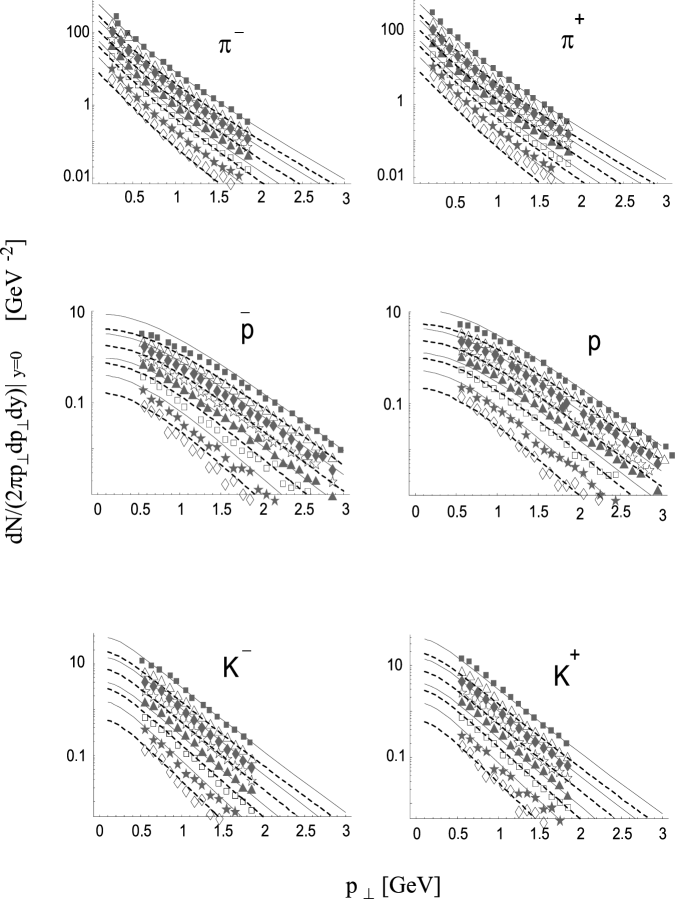
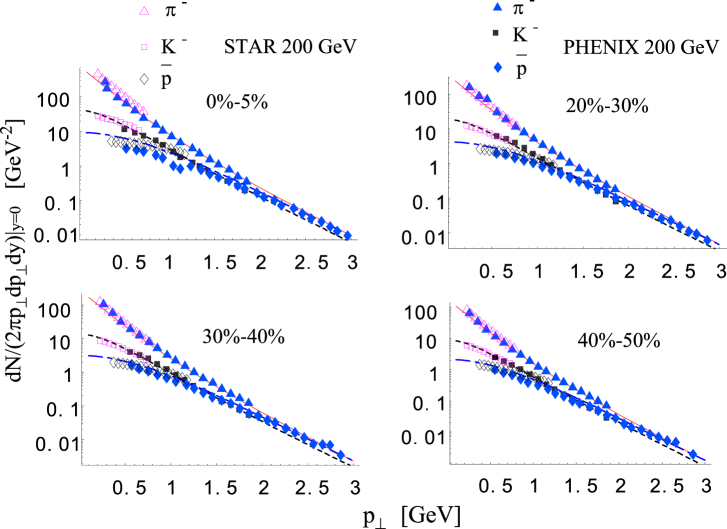
Having at our disposal the data collected in different centrality windows we may determine the dependence of the expansion parameters on , or, equivalently, on the impact parameter . In Fig. 4 we show the PHENIX data together with our model curves. Both the data and the model spectra are plotted for eight different centrality classes. The most central collision correspond to the centrality class 0-5%, whereas the most peripheral collisions included in Fig. 4 are for the centrality class 80-91%. The values of the fitted expansion parameters for all eight cases are given in Table 2.
The geometric parameters obtained from the fit to the STAR data turn out to be noticeably larger compared to the parameters obtained from the analysis of the PHENIX data. In order to see the origin of this effect, in Fig. 5 we superimpose the spectra from STAR and PHENIX for four centrality classes common for the two experiments. We can see that the spectra measured by STAR (open symbols) are lying slightly above the spectra measured by PHENIX (filled symbols). As a consequence of this behavior, our normalization-controlling parameter, , turns out to be larger for STAR. We have performed a simultaneous fit to the PHENIX and STAR data. The model curves for this case are also shown in Fig. 5 (solid, dashed, and long-dashed curves, respectively for pions, kaons, and antiprotons). The fitted values of the expansion parameters and are listed in the lowest entry of Table 2.
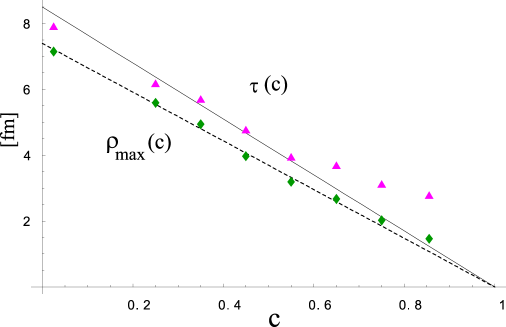
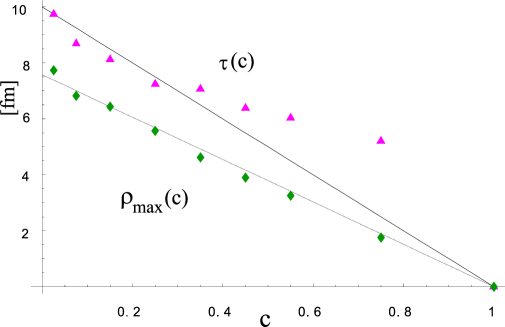
An interesting behavior can be found when the values of and are plotted versus (see Figs. 6 and 7). The parameter exhibits almost ideal linear dependence on in the full range . Similarly, the parameter decreases linearly with growing in the range . For larger values of the drop of is slightly weaker, although the data of PHENIX show a rather strong tendency to line up. The approximate linear scaling of both and with has an important physical significance. The hadron multiplicities in our model are functions of and , see Eq. (12), hence the linear dependence of and on means that the ratio is independent of and we are left with the dependence on only. Consequently, using Eq. (15) we find that the total multiplicity in the central region (mid-rapidity) obtained in our model should, to a good approximation, scales in the following way
| (17) |
This type of the behavior may be compared to the -dependence of hadron production following from the wounded nucleon model [22]. For the symmetric case, i.e. when two identical nuclei collide, the number of the wounded nucleons is given by the formula
| (18) |
where is the mass number, is the inelastic nucleon-nucleon cross section, and is the nucleon-nucleus thickness function. Similarly, the total inelastic cross section is given by the formula
| (19) |
where is the nucleus-nucleus thickness function. Using the values and =40 mb, and assuming the Woods-Saxon distribution for the nuclear densities (with the standard choice of the parameters) we find
| (20) |
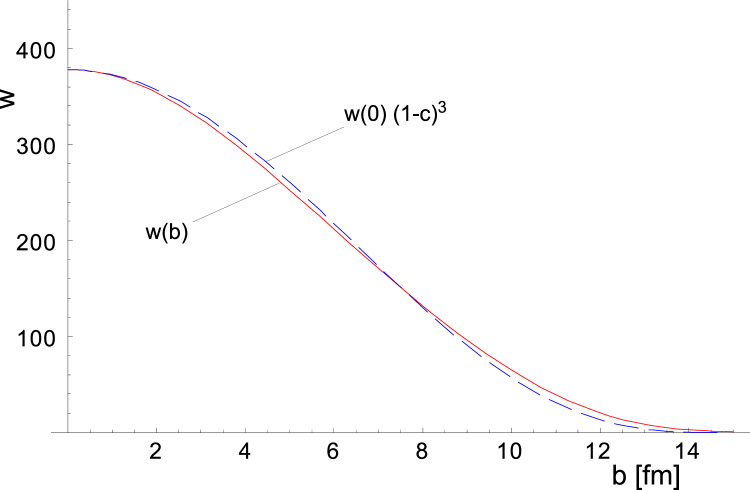
Since the wounded-nucleon model assumes the scaling of hadron production with the number of the wounded nucleons, the total multiplicity of hadrons considered in this model scales also as , hence it is compatible with the scaling obtained in our approach, cf. Figs. 6 and 7. The quality of the simple approximation (20) is shown in Fig. 8. This result means that our model, with the geometric parameters fit to reproduce the data at various centralities, conforms with high accuracy to the wounded-nucleon scaling for not-too-large values of (say, ).
We end this Section with a technical remark. In the analysis of this Section we have ignored any possible effects of the azimuthal deformation. Clearly, the emitting source formed in a non-central collision will not be azimuthally-symmetric, which, by the way, is seen in the HBT measurements [66]. However, it turns out that the effects of this deformation are tiny for the -spectra averaged over the azimuthal angle [67], thus can be dropped in the analysis of the present paper.
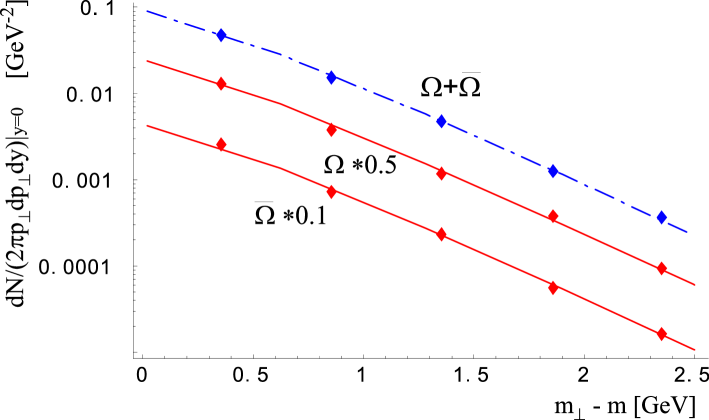
7 Spectrum of the baryons
Finally, we wish to present the spectra for the and . Similarly to the case of the lower energy of GeV [20], our model is in full agreement with the preliminary data of Ref. [54], which can be seen in Fig. 9. In the model calculation we have used the thermal parameters from Table 1 and the geometric parameters fm and fm, which roughly corresponds to centrality % in the STAR experiment (cf. Table 2).
8 Conclusions
It is clear from the results presented in this paper that the single freeze-out model works well for the particle ratios and the transverse-momentum spectra for the full RHIC energy of GeV. This confirms our results published previously for GeV [19, 20, 21]. The model provides an economic framework to parameterize the data, and supports the use of the thermal approach to heavy-ion physics. In addition, we have shown that the model works equally well for the central, as well as for the non-central collisions. The transverse-size parameter, , drops linearly practically for all values of , while the ratio of to remains almost constant for not-too-large values of . The systematics of the dependence of the geometric/flow parameters on the centrality is most interesting. For moderate values of the parameter , say , the analysis of the non-central collisions displays scaling in accordance to the wounded-nucleon model.
Acknowledgements
We are grateful to Fuqiang Wang and Patricia Fachini for many helpful remarks concerning the data.
References
- [1] Proceedings of the 15th Int. Conference on Ultrarelativistic Nucleus-Nucleus Collisions (Quark Matter 2001), Stony Brook, New York, 15-20 Jan 2001, Nucl. Phys. A698 (2002).
- [2] Proceedings of the 16th Int. Conference on Ultrarelativistic Nucleus-Nucleus Collisions (Quark Matter 2002), Nantes, France, 18-24 July 2002, Nucl. Phys. A715 (2003).
- [3] Proceedings of the 30th Int. Workshop on Gross Properties of Nuclei and Nuclear Excitation: Ultrarelativistic Heavy Ion Collisions, Hirschegg, Austria, 13-19 Jan 2002.
- [4] J. Rafelski, J. Letessier, and A. Tounsi, Acta Phys. Pol. B27, 1037 (1996).
- [5] P. Braun-Munzinger, J. Stachel, J.P. Wessels, and N. Xu, Phys. Lett. B344 (1995) 43; Phys. Lett. B365, 1 (1996).
- [6] J. Cleymans, D. Elliott, H. Satz, and R. L. Thews, Z. Phys. 74, 319 (1997).
- [7] P. Braun-Munzinger, I. Heppe, and J. Stachel, Phys. Lett. B465, 15 (1999).
- [8] M. Gaździcki and M. Gorenstein, Acta Phys. Pol. B30, 2705 (1999).
- [9] G. D. Yen and M. I. Gorenstein, Phys. Rev. C59, 2788 (1999).
- [10] F. Becattini, J. Cleymans, A. Keranen, E. Suhonen, and K. Redlich, Phys. Rev. C64, 024901 (2001).
- [11] P. Braun-Munzinger, D. Magestro, K. Redlich, and J. Stachel, Phys. Lett. B518, 41 (2001).
- [12] W. Florkowski, W. Broniowski, and M. Michalec, Acta Phys. Pol. B33, 761 (2002).
- [13] A. Bialas, Nucl. Phys. A715, 95c (2003).
- [14] J. Rafelski and J. Letessier, Nucl. Phys. A715, 98c (2003).
- [15] V. Koch, Nucl. Phys. A715, 108c (2003).
- [16] D. Prorok, hep-ph/0212103.
- [17] P. Huovinen, nucl-th/0305064.
- [18] P. Braun-Munzinger, K. Redlich, and J. Stachel, nucl-th/0304013.
- [19] W. Broniowski and W. Florkowski, Phys. Rev. Lett. 87, 272302 (2001).
- [20] W. Broniowski and W. Florkowski, Phys. Rev. C65, 064905 (2002).
- [21] W. Broniowski, A. Baran, and W. Florkowski, Acta. Phys. Pol. B33, 4235 (2002).
- [22] A. Bialas, M. Błeszyński, and W. Czyż, Nucl. Phys. B111, 461 (1976).
- [23] A. Budzanowski, Acta Phys. Pol. B33, 33 (2002).
- [24] B. B. Back et al., PHOBOS Collaboration, nucl-ex/0302015.
- [25] M. I. Gorenstein, K. A. Bugaev, and M. Gaździcki, Phys. Rev. Lett. 88 132301 (2002); K. A. Bugaev, M. Gaździcki, and M. I. Gorenstein, Phys. Lett. B544, 127 (2002).
- [26] U. Heinz, Nucl. Phys. A661, 140c (1999), and references therein.
- [27] C. M. Hung and E. V. Shuryak, Phys. Rev. C57, 1891 (1998).
- [28] P. Fachini, STAR Collaboration, Nucl. Phys. A715, 462c (2003).
- [29] P. Fachini, STAR Collaboration, J. Phys. G28, 1599 (2002).
- [30] C. Adler et al., STAR Collaboration, Phys. Rev. C66, 061901 (2002).
- [31] J. Rafelski and J. Letessier, Phys. Rev. Lett. 85, 4695 (2000).
- [32] J. D. Bjorken, Phys. Rev. D27, 140 (1983).
- [33] G. Baym, B. Friman, J.-P. Blaizot, M. Soyeur, and W. Czyż, Nucl. Phys. A407, 541 (1983).
- [34] P. Milyutin and N. N. Nikolaev, Heavy Ion Phys 8, 333 (1998); V. Fortov, P. Milyutin, and N. N. Nikolaev, JETP Lett. 68, 191 (1998).
- [35] P. J. Siemens and J. Rasmussen, Phys. Rev. Lett. 42, 880 (1979); P. J. Siemens and J. I. Kapusta, Phys. Rev. Lett. 43, 1486 (1979).
- [36] E. Schnedermann, J. Sollfrank, and U. Heinz, Phys. Rev. C48, 2462 (1993).
- [37] T. Csörgő and B. Lörstad, Phys. Rev. C54, 1390 (1996).
- [38] T. Csörgő, Heavy Ion Phys. 15, 1 (2002).
- [39] D. H. Rischke and M. Gyulassy, Nucl. Phys. A697, 701 (1996); Nucl. Phys. A608, 479 (1996).
- [40] R. Scheibl and U. Heinz, Phys. Rev. C59, 1585 (1999).
- [41] T. Csörgő, F. Grassi, Y. Hama, and T. Kodama, nucl-th/0305059.
- [42] D. Ouerdane, BRAHMS Collaboration, Nucl. Phys. A715, 478c (2003); I. G. Bearden et al., BRAHMS Collaboration, Phys. Rev. Lett. 90, 102301 (2003).
- [43] K. S. Lee, U. Heinz, and E. Schnedermann Z. Phys. C48, 525 (1990).
- [44] G. Torrieri and J. Rafelski, nucl-th/0212091.
- [45] Particle Data Group, Eur. Phys. J. C15 (2000) 1.
- [46] R. Hagedorn, Suppl. Nuovo Cim. 3, 147 (1965); preprint CERN 71-12 (1971), preprint CERN-TH. 7190/94 (1994) and references therein.
- [47] W. Broniowski and W. Florkowski, Phys. Lett. B490, 223 (2000).
- [48] W. Broniowski, in Proc. of Few-Quark Problems, Bled, Slovenia, July 8-15, 2000, eds. B. Golli, M. Rosina, and S. Širca, p. 14, hep-ph/0008112.
- [49] A. Tounsi, J. Letessier, and J. Rafelski, contribution to the NATO Advanced Study Workshop on Hot Hadronic Matter: Theory and Experiment, Divonne-les-Bains, France, 27 Jun - 1 Jul 1994, p. 105.
- [50] B. Wosiek, PHOBOS Collaboration, Nucl. Phys. A715, 510c (2003).
- [51] T. Chujo, PHENIX Collaboration, Nucl. Phys. A715, 151c (2003).
- [52] G. Van Buren, STAR Collaboration, Nucl. Phys. A715, 129c (2003).
- [53] O. Barannikova and F. Wang, STAR Collaboration, Nucl. Phys. A715, 458c (2003).
- [54] C. Suire, STAR Collaboration, Nucl. Phys. A715, 470c (2003).
- [55] M. Michalec, PhD Thesis, nucl-th/0112044.
- [56] W. Broniowski and W. Florkowski, Acta Phys. Pol. B33, 1935 (2002).
- [57] F. Cooper and G. Frye, Phys. Rev. D10, 186 (1974).
- [58] F. Cooper, G. Frye, and E. Schonberg, Phys. Rev. D11, 192 (1975).
- [59] T. S. Ullrich, Nucl. Phys. A715, 399c (2003).
- [60] T. Chujo, talk presented at Quark Matter 2003.
- [61] K. Adcox et al., PHENIX Collaboration, Phys. Rev. Lett. 88, 192302 (2002).
- [62] C. Adler et al., STAR Collaboration, Phys. Rev. Lett. 87, 082301 (2001).
- [63] L. Ahle et al., E-802 Collaboration, Phys. Rev. C66, 054906 (2002).
- [64] W. Broniowski, A. Baran, W. Florkowski, in Proc. of the Second Int. Workshop on Hadron Physics, Effective Theories of Low-Energy QCD, AIP Conf. Proc., vol. 660, p. 185 (Melville, New York, 2003), nucl-th/0212053.
- [65] W. Broniowski and W. Florkowski, Phys. Rev. C65, 024905 (2002).
- [66] M. López Noriega, STAR Collaboration, Nucl. Phys. A715, 623c (2003).
- [67] A. Baran, in preparation.