Limitation of energy deposition in Classical N Body Dynamics.
Abstract
Energy transfers in collisions between classical clusters are studied with Classical N Body Dynamics calculations for different entrance channels. It is shown that the energy per particle transferred to thermalised classical clusters does not exceed the energy of the least bound particle in the cluster in its “ground state”. This limitation is observed during the whole time of the collision, except for the heaviest system.
pacs:
24.10.Cn, 25.70.-zThe question of energy deposition in nuclei during nucleus-nucleus collisions is of great importance for nuclear matter studies. The maximum amount of energy which can be stored in hot equilibrated nuclei has been studied both experimentally Jiang89 ; Vient94 ; Nato2002 ; Schmidt2002 ; Galin94 ; Steck2000 and theoretically BonLevVaut84 ; BonLevVaut86 . Such studies have mainly been motivated by the determination of a plateau in the so called caloric curve (the evolution of the temperature with the excitation energy) which could be a signature of a first order liquid-gas phase transition Ma98 ; Poch95 .
Experimentally, a lot of work has been done to determine the amount of thermal energy stored in nuclei. For central collisions, large energy deposits up to 22.5 A.MeV have been determined Borderie96 ; Ma98 . Other studies have shown that the excitation energy in primary products in multifragmenting systems is around 3-4 A.MeV Schmidt2002 ; Hudan ; Marie98 ; Nato2002 , far below the total available energy in the center of mass frame. This energy does not seem to evolve strongly with the incident energy. These two measurements seem to be in contradiction. Possible limitations of energy deposition could result from prompt emission of energetic light charged particles at early times in the reaction Lefort2000 ; Dore2000a ; Dore2000b .
Theoretically, the maximum energy that a equilibrated nucleus can withstand corresponds to the energy (or temperature) at which the surface tension vanishes. This is often characterised by a critical temperature whose value is around 16 MeV BonLevVaut84 ; BonLevVaut86 . This temperature is linked to the equation of state of nuclear matter. The main drawback of such studies is that they assume that the system is fully equilibrated and hence do not take into account possible limitations coming from the reaction mechanism.
The aim of the present article is to study energy deposition during collisions between finite size systems in a well controlled framework. Results from the Classical N Body Dynamics code CNBD2002 will be shown and the mechanism of energy deposition in classical clusters will be studied. We will be interested in this paper by the energy transfered to thermally equilibrated clusters which corresponds to the energy that long-lived clusters can withstand. The paper is organised as follows. In a first section, the Classical N Body Dynamics will be briefly described. The excitation energy in clusters will be shown for various systems and incident energies in the second section. The third section will be devoted to the mechanism of energy deposition in clusters. Conclusions will be drawn in the last section
| fused | fused | fused | number of events | |||
|---|---|---|---|---|---|---|
| (E.S.U.) | (E.S.U.) | (E.S.U.) | (E.S.U.) | |||
| 13 | 13 | 25 | -73.30 | -50.86 | 35.17 | 1,000 |
| 45 | 55.17 | 1,000 | ||||
| 65 | 75.17 | 1,000 | ||||
| 85 | 85.17 | 1,000 | ||||
| 18 | 50 | 30 | -93.60 | -54.64 | 41.55 | 1,000 |
| 60 | 71.55 | 1,000 | ||||
| 90 | 101.55 | 1,000 | ||||
| 120 | 131.55 | 1,000 | ||||
| 34 | 34 | 30 | -93.60 | -54.64 | 42.04 | 1,000 |
| 60 | 72.04 | 1,000 | ||||
| 90 | 102.04 | 1,000 | ||||
| 120 | 132.04 | 1,000 | ||||
| 50 | 50 | 30 | -98.93 | -62.46 | 41.50 | 1,000 |
| 60 | 71.50 | 1,000 | ||||
| 90 | 101.50 | 1,000 | ||||
| 120 | 131.50 | 1,000 | ||||
| 100 | 100 | 30 | -107.97 (*) | -65.00 (*) | 39.03 (*) | 100 |
| 60 | 69.03 (*) | 100 | ||||
| 90 | 99.03 (*) | 100 | ||||
| 120 | 129.03 (*) | 100 |
I Description of the code.
Let us start by describing the Classical N-Body Dynamics code (labeled CNBD) used in this article. The basic ingredients of such a code are very simple. The dynamical evolution of each particle of the system is driven by the classical Newtonian equations of motion. The two-body potential used in the present work is a third degree polynomial whose derivatives are null at the range and at the distance of maximum depth . The depth value is and the value at is finite and equal to . This potential has the basic properties of the Lennard-Jones potential used in other works Dorso99 ; Sator2001 : a finite range attractive part and a repulsive short range part. To follow the dynamical evolution of the system an adaptative stepsize fourth-order Runge-Kutta algorithm is used NumRec . The main difference with other works is that the time step can vary: if the potential varies strongly, is small and when the potential varies gently, becomes larger. This allows a very high accuracy with shorter CPU time than for fixed time step algorithms. It requires an additional simulation parameter which is adjusted to ensure the verification of conservation laws (energy, momentum, angular momentum) with a reasonable simulation time. The energy difference between the beginning and the ending simulation time is lower than 0.001%. This simulation has five free parameters: four linked to the physics (the interaction) and one linked to the numerical algorithm.
Since one wants to study the simplest case, neither long range repulsive interaction nor quantum corrections like a Pauli potential have been introduced Dorso87 . Additionally, no statistical decay code is applied to the excited fragments formed during the collision. The final products have to be regarded as “primary” products which would decay afterwards. Although most of the ingredients necessary for a correct description of atomic nuclei are missing from this simulation, it should be noted that the reaction mechanisms observed in nucleus-nucleus collisions are seen, and the properties of the “ground states” of such clusters are qualitatively close to those of nuclei CNBD2002 .
In order to avoid any confusion with nuclear physics, the units used here are arbitrary and called Simulation Units (). The distance will then be in Distance Simulation Units (), the energies in Energy Simulation Units (), the velocities in Velocity Simulation Units () and the reaction time in Time Simulation Units ().
For this study, 16,400 events have been generated. For a fixed projectile size , a fixed target size and a fixed available energy in the center of mass , the impact parameter is randomly chosen assuming a flat distribution between 0 and , where is the mean square radius of the projectile, is the mean square radius of the target and the range of the potential. In the analyses, each event is weighted by its impact parameter value (). The systems and the energies studied here are summarized in table 1. As it can be seen in table 1, the available energies in the center of mass frame have been chosen in such a way that the excitation energy of the fused cluster is close to the binding energy of the fused cluster (), close to the energy of the least bound particle in the fused cluster (), far below () or far above () the binding energy of the fused cluster. The stars for the 100 + 100 system mean that these energies were estimated from the liquid-drop parametrisation of the binding energies of the clusters CNBD2002 . In that case, the energy of the least bound particle is taken equal to . For each system, the excitation energy of the fused cluster is determined by:
| (1) |
where is the binding energy of the cluster of size .
In this unit system, the parameters of the reaction are the following: , , and . Typical mean square radii are around 10 for and around 15 for (for more information, see CNBD2002 ). The time for a particle to go through a cluster ranges from 7 to 10 at the lowest available energies () and ranges from 3 to 5 at the highest available energies (). As seen in CNBD2002 , fusion-like mechanisms and particle transfer mechanisms are observed at low values (), while multi-fragment production and neck formation and break-up is dominant at high values (). As it will be seen in section III, typical thermalisation times for such systems ranges from 15 to 20 .
II Energy deposition in final clusters.
In this section, we will be interested in the energy deposition in clusters at the simulation time . At this stage, the clusters are well separated from each other in configuration space. As it will be seen later, these clusters are thermally equilibrated. They can be viewed as primary clusters. For this first simple analysis, the clusters have been identified by using the Minimum Spanning Tree method (labeled MST) which assumes that two particles belong to the same cluster if they are in potential interaction, i.e. if their relative distance is below the range of the potential.


II.1 Variations of the energy deposition with the velocity of the cluster
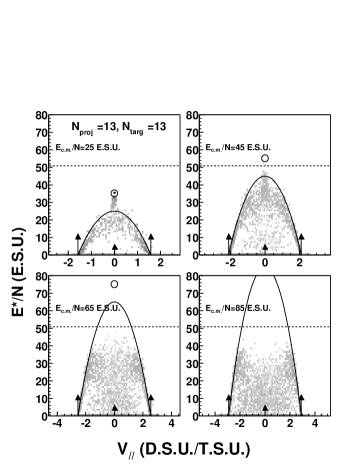
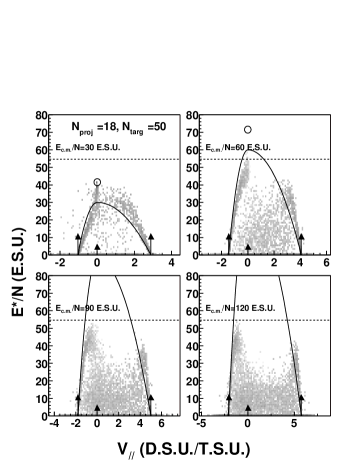
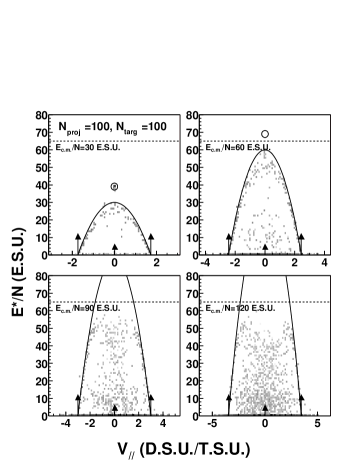
On figures 1, 2, 3, 4, and 5 are plotted the evolution of the excitation energy of the cluster with its parallel velocity for the whole impact parameter range and for different available energies in the center of mass. The excitation energy of each cluster is simply the difference between the total energy (potential plus kinetic) and the “ground state” energy of the cluster:
| (2) |
where is the kinetic energy of the particle in the cluster’s centre of mass, the potential energy between the particles and , the binding energy of the cluster and its number of particles. This excitation energy is determined at the end of the calculation corresponding to . As it will be seen in the next section, this energy is very close to the one obtained at the separation time of the clusters (the smallest time at which clusters can be identified), since in this time range the emission of monomers or small clusters by the primary clusters (evaporation) is very weak and the clusters have no time to cool down significantly Dorso99 . On each panel of the figures, the full line corresponds to the expected correlation between and for a pure binary scenario, i.e. the excitation energy is only due to the velocity damping of each partner, without any particle exchange between them. This excitation energy is then determined by:
| (3) |
where and are the projectile and the target mass respectively, the initial relative velocity between the projectile and the target and is the relative velocity between the projectile and the target after interaction. The mass of each cluster is proportional to the number of particles where . The initial relative velocity is given by:
| (4) |
The small circle displayed on each panel is centered around the expected values of velocity and excitation energy for the fused system. The horizontal dashed line corresponds to the energy of the least bound particle for the fused system . This energy is determined for the stable clusters (“ground state”) and is defined as follows:
| (5) |
where is the relative distance between the particles and and is the value of the two-body potential. As it has been shown in CNBD2002 , this energy varies dramatically with . In their “ground states” the clusters are small crystals and the value is mainly due to geometrical effects (number of neighbors of a particle at the surface). Such variations are well known in cluster physics WALES97 .
At low values ( for the 13+13 system and for the others), the points are slightly below the full line. This means that the excitation energy is strongly linked to the velocity damping. In that case, the collisions leads to the formation of excited projectile-like and target-like clusters. The small shift is due to mass transfers between the projectile and the target, and to promptly emitted clusters. The area corresponding to the fused system is well populated showing that a complete fusion process occurs. At intermediate energies ( for the 13+13 system and for the others), the distribution of points is roughly compatible with the pure binary process hypothesis (formation of excited projectile-like and target-like clusters) except for cluster velocities which lead to excitation energies per particle higher than (where ) in the pure binary process picture. For these clusters, is always smaller than . The complete fusion process area, located above , is empty. In that case, as it will be seen in the next section, incomplete fusion process occurs. For the two highest energies, this trend is enhanced. Around the projectile and the target velocity the projectile-like and target-like clusters have an excitation energy compatible with the pure binary process hypothesis. Around the centre of mass velocity, when this picture would give excitation energies per particle higher than , one finds clusters at small excitation energies. The energy of the least bound particle seems to be a limit to the excitation energy which can be stored in these classical clusters.
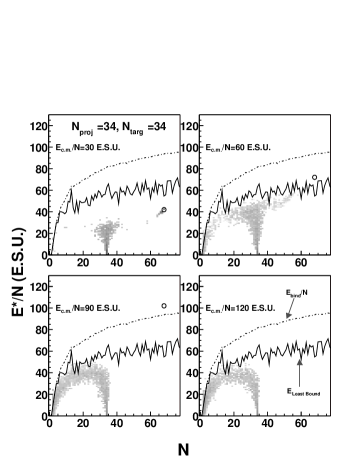
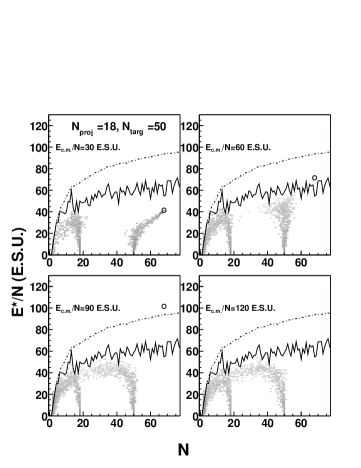
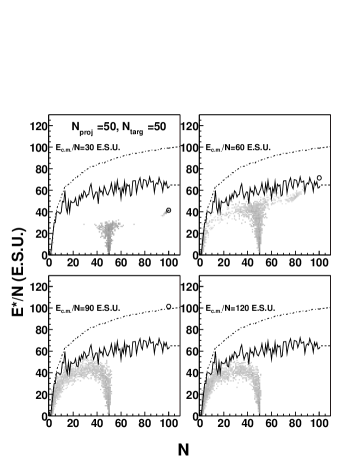
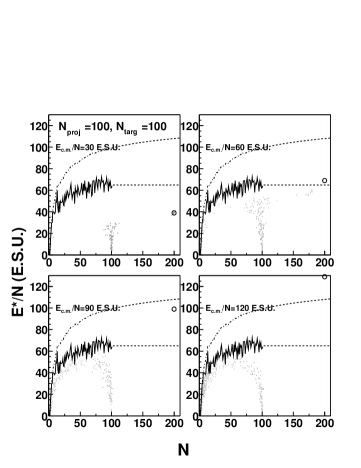
II.2 Variations of the energy deposition with the size of the cluster
This limitation can be more clearly seen when the excitation energy is plotted as a function of , as in figures 6, 7, 8, 9 and 10. On each panel, the full line corresponds to the energy of the least bound particle in the cluster and the dashed line to the binding energy per particle . As in figures 1, 2, 3, 4, and 5, the small circle corresponds to the expected values for the fused system. At low energy, the area corresponding to complete fusion is filled and all the available energy can be stored as excitation energy. But for higher energies, one can clearly see that for each fragment size, never overcomes . At intermediate energy, clusters with sizes higher than the projectile size and the target size can be seen. This area corresponds to an incomplete fusion process. For the two highest energies, the plots are almost identical: there is no more fusion (the small circle area is empty) and the clusters are smaller than the target and than the projectile. One can notice that never reaches the binding energy except for small clusters where and are equal. The energy of the least bound particle in the cluster is an upper limit for the energy per particle which can be stored in the cluster, whatever the system size, the available energy in the center of mass and the asymmetry of the entrance channel.

II.3 Variations of the energy deposition with the impact parameter and the available energy in the center of mass.
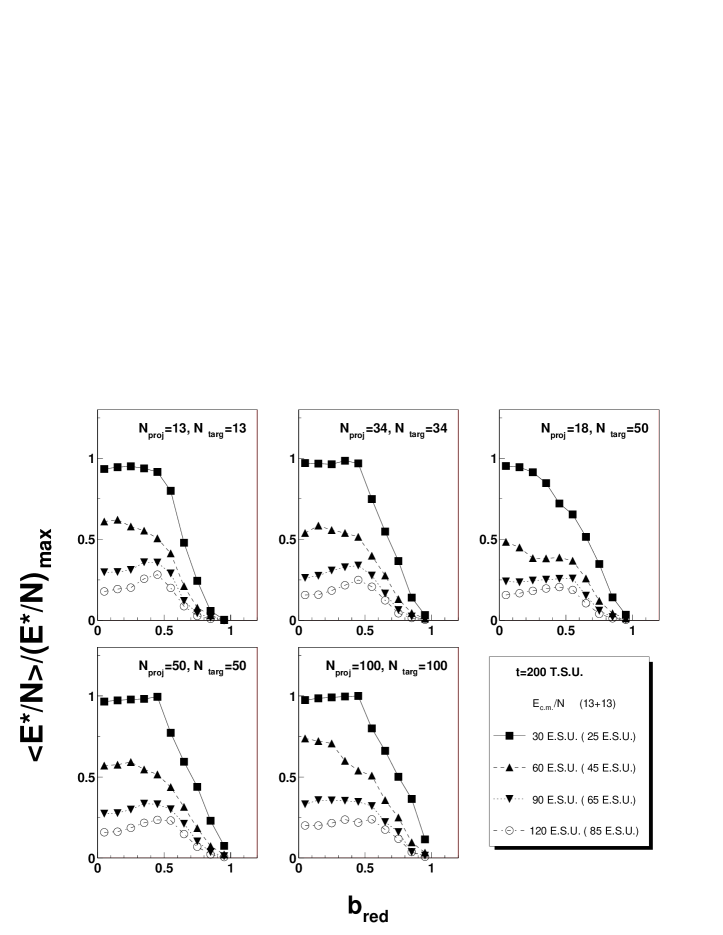
Figure 11 shows the variations of the average excitation energy per particle with the reduced impact parameter for different available energies in the center of mass frame . The average is calculated for clusters with greater or equal to 3. Each panel corresponds to a system. The squares correspond to the lowest values, the triangles to values close to , the diamond to values close to and the circles to the highest values. As in the previous figures, the average excitation energy is limited around except for the 100 + 100 system for which the maximum energy reached is at .
At the lowest energy, for symmetric systems, increases when decreases down to , and then is constant at below. This saturation is due to the occurrence of fusion: the maximum excitation energy is reached by the fused system. For the asymmetric system 18 + 50, saturation occurs at smaller impact parameters. For intermediate energies, the picture is roughly the same. But although the available energy is higher, the maximum value is almost the same as for the lowest available energy. In that case, an incomplete fusion process occurs and the excitation energy of the heaviest cluster is limited by the energy of its least bound particle, which is well below the expected excitation energy of the fused system. For the two highest energies, increases when decreases down to and then decreases when decreases. This effect results from the lower cluster sizes for the most central collisions, which at these energies produce several clusters of intermediate sizes. Indeed, the smaller is the cluster size, the lower is the upper limit in energy storage. Since clusters have a smaller size for central collisions, the decreases consequently. This evolution does not seem to depend strongly on the total system size or on the entrance channel asymmetry.
The same evolution is seen on figure 12 which shows the evolution of the ratio where corresponds to the maximum excitation energy expected for the fused systems. For low energies, this ratio continuously increases when decreases and is close to 1 below : this corresponds to the occurrence of the fusion process. This value of 1 is reached for below 0.2 for the 18 + 50 system. This difference can be understood quite easily: for a fixed value, the relative velocity between the projectile and the target is higher for an asymmetric system than for a symmetric one (see equation 4). This leads to an interaction time smaller for the asymmetric system than for a symmetric one and then to less efficient energy deposition in the clusters. For higher energies, this value of 1 is never reached. The maximum value even decreases when increases: the relative amount of energy stored in clusters is lower and lower when the available energy increases.
II.4 Discussion
These studies show that in classical systems, the energy storage in clusters is limited. Such a saturation was observed for two-dimensional classical systems Strachan98 . This limitation is only linked to the intrinsic properties of the cluster: the energy deposition cannot be higher than the energy of the least bound particle in the cluster.
This limitation of excitation energy can be understood quite easily. The least bound particle remains bound to the cluster only if its total energy is negative, i.e. its kinetic energy due to the excitation is below its potential one. If one assumes that the excitation energy is roughly equally shared over all particles in the cluster, when the kinetic energy balances the potential energy of the least bound particle, this particle is no longer bound to the cluster and quickly escapes. To be observed for a long time (greater than the thermalisation time), the excited cluster must have an excitation energy per particle below the energy of the least bound particle.
The mechanism of energy deposition in classical N-body clusters seems to be the following one: the excitation is mainly driven by the velocity damping of the two partners and to a lesser extent by exchanges of particles between them. Once the energy of the least bound particle is reached, unbound particles and/or clusters escape quickly and keep an excitation energy per particle below the energy of the least bound one. As a consequence, the highest energy deposition per particle can only be obtained at energies close to . For higher available energies, the system fragments quickly, leaving rather “cold” clusters around the center of mass velocity. The energy in excess is stored in the kinetic energies of the clusters. A similar mechanism could be an explanation of the apparent saturation of primary fragments excitation energies observed for central collisions of the Xe + Sn system when the incident energy increases from 32 to 50 A.MeV Marie98 ; Hudan . This could also be an explanation for the limitation of temperature values around 5 MeV by using isotope ratios methods or population ratios methods Ma98 ; Poch95 . Such a limitation has been observed in the fragmentation of Uranium projectiles at relativistic energies Schmidt2002 . This limitation was also suggested by the observation of the saturation of the evaporated neutron multiplicity when the incident energy increases Galin94 .
Providing this conclusion can be applied in nuclear physics, i.e. if quantum effects and Coulomb interaction do not modify strongly the above picture, this means that the maximum energy per nucleon which can be stored in thermalised hot nuclear fragments would never exceed the energy of the least bound nucleon. This energy would correspond to the energy of the last populated level. If this assertion is true, that would be in contradiction with several experimental works in which high energy depositions (up to 20 A.MeV) were measured Borderie96 ; Ma98 ; Nato2002 . This discrepancy may result from the calorimetry analyses used in these articles, whereas is directly extracted in this work.
One has to be careful because the observations made here are for a fixed simulation time. At the early stages of the collision higher energy deposition could be reached for short times. The next section will be devoted to the evolution of this energy deposition with the reaction time.
III Evolution of the energy deposition with time.
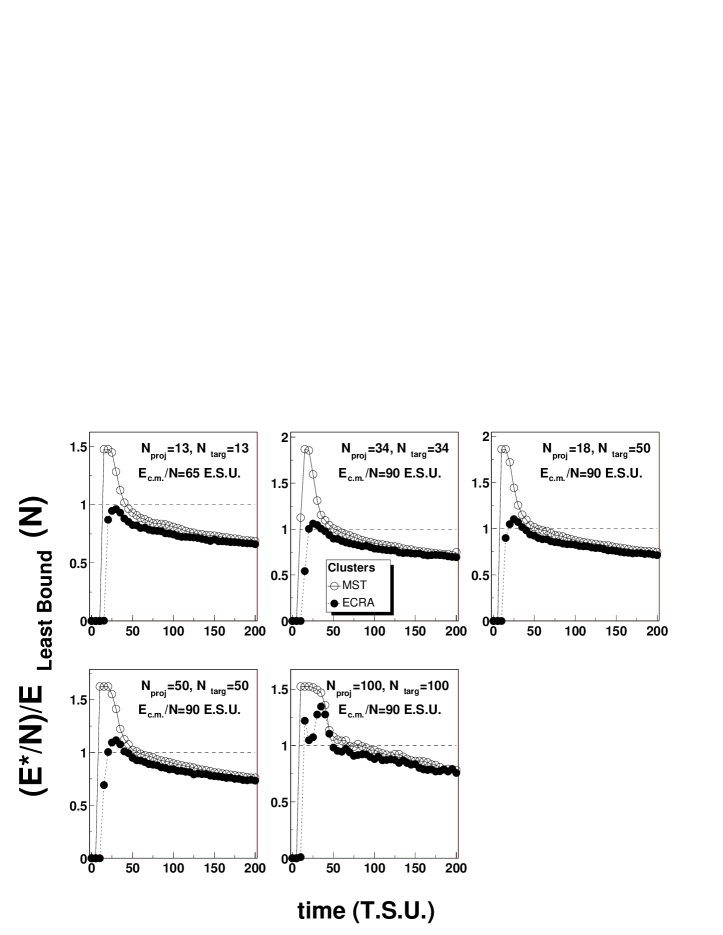
The aim of the present section is to check to which extent the limitation of the energy deposition observed for final (long simulation times) thermally equilibrated clusters is true during the collision. Since the limitation is linked to the energy of the least bound particle in the cluster, we will follow the ratio of the excitation energy per particle to the energy of the least bound particle with collision time.
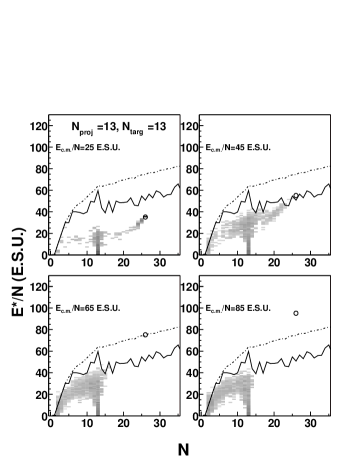
Such an evolution is shown in figure 13 for MST clusters for central collisions () for all systems at ( for the 13 + 13 system). It is seen that for MST clusters (open circles) very high energies can be found, up to the maximum excitation energy. This means that very excited systems could be formed at the early stages of the collision. But one has to check first if this transfered energy is equally shared between all degrees of freedom and hence if these intermediate clusters are thermalised.
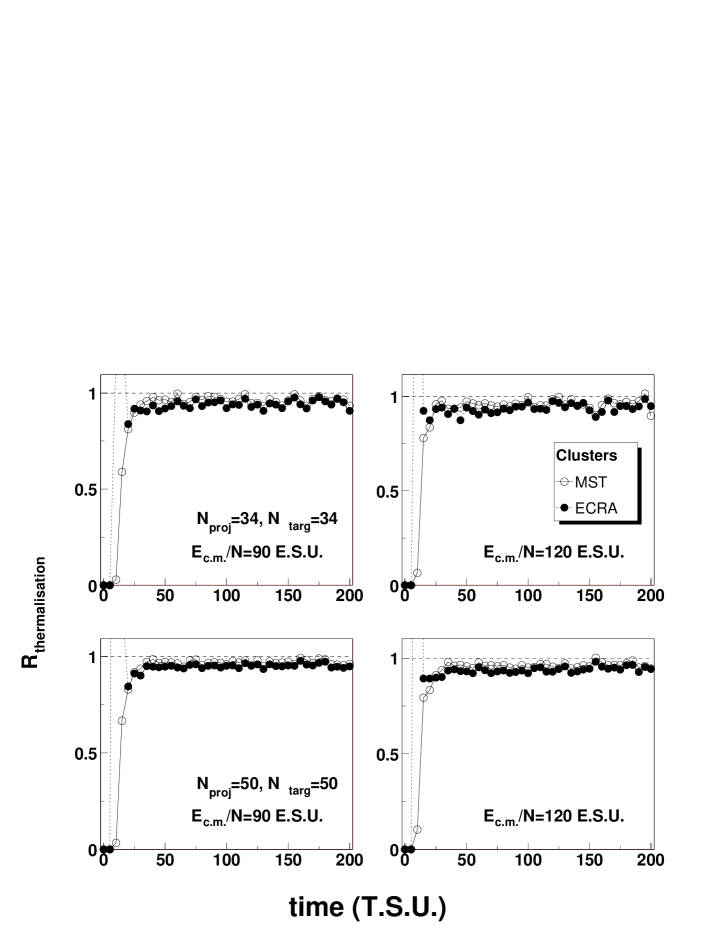
One way to check this thermalisation is to follow the ratio between the dispersion of the distribution of the kinetic energy of particles in the cluster and its average value . For a thermalised system, the value of this ratio is well defined: it is equal to in the canonical ensemble, and equal to in the micro-canonical ensemble Lopez89 , where is the number of particles in the cluster. The time evolution of is displayed on figure 14 for the 34+34 system (first row) and the 50+50 system (second row) at the two highest values (90 left column and 120 right column). A value close to 1 indicates that the cluster is thermalised. Let us first follow the evolution of the ratio for MST clusters (open circles). The thermalisation of clusters is reached at for both systems at =90 . The excitation energy per particle of the MST clusters at this time (see figure 13, open circles) is close to or below the energy of the least bound particle in the cluster. For later times, the ratio slightly varies around 1, showing that clusters stay thermalised even if evaporation of light clusters occurs. The same conclusion can be drawn at =120 for which the thermalisation is reached at when the excitation energy per particle is very close to . From this simple study, one can conclude that the highly excited intermediate cluster is not thermalised, and that thermalised clusters have an excitation energy per particle close to or below .
It has been found in earlier works that such systems are indeed composed of several small clusters at early times Aichelin ; Dorso97 ; Sator2001 . The size distributions of these clusters have been found to be almost identical to those identified after their separation Sator2001 . The problem is how to identify these clusters. In that respect, the MST algorithm is no longer suited since particles close to each other at these early stages are not necessarily bound at later times. Different methods have been developed to identify clusters. One is to assume that two particles are belong to the same cluster if they are bound, i.e. if their relative energy is negative. These clusters have been labeled Coniglio-Klein clusters (CK clusters) or MSTE clusters in other works. Another way to define clusters is to find at each time step the most bound partition of particles in clusters. This algorithm is described in detail in ECRA and is called Early Cluster Recognition Algorithm (ECRA). The latter will be used in the present work.
On figure 13 the evolution of with the collision time is shown for ECRA (filled circles) clusters. Above both algorithms (MST and ECRA) give the same results: clusters are well separated in the configuration space. At this time, clusters do not interact anymore with each other: this corresponds to the “freeze-out” configuration assumed in statistical multifragmentation models SMM ; MMMC . One has to notice that this time coincides with the thermalisation time found in the previous paragraph. The thermalisation of ECRA clusters (see figure 14, filled circles) is also reached at the “freeze-out” time. After this time, clusters have an excitation energy which is below (ratio below 1). But for earlier times, the configuration is more complex. While MST clusters reach very high excitation energies per particle, the ratio for ECRA clusters is always around or below 1, except for the 100+100 system. Apart for the latter system, the limitation observed in the previous section seems to be still true all along the collision time. But what leads to the difference observed for the 100+100 system?
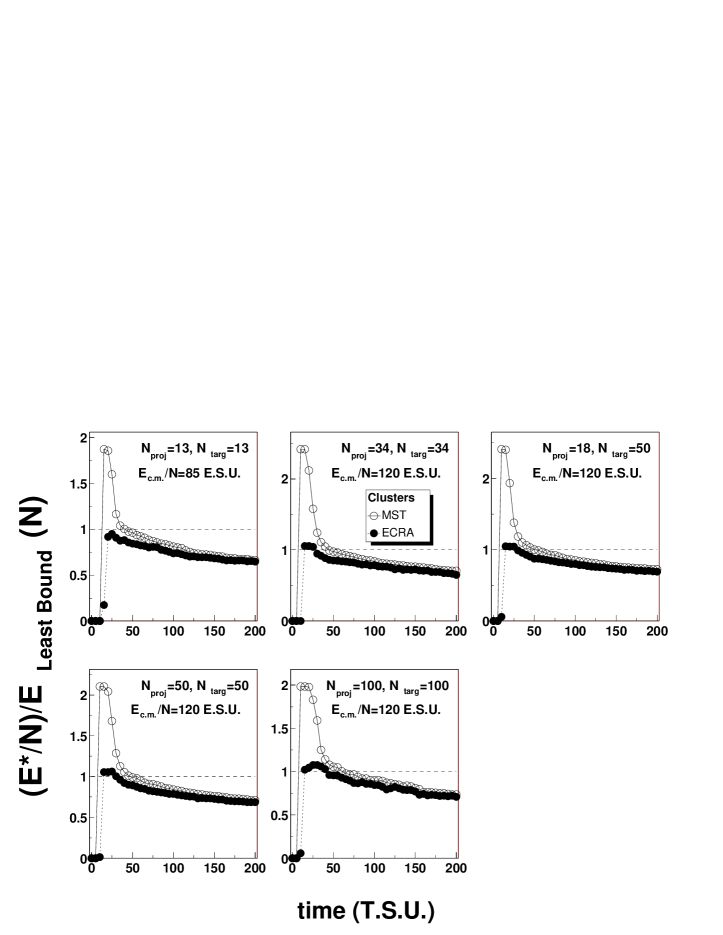
Indeed, for such a heavy system, pre-formed clusters remain long enough together to interact strongly. If one of the particles escapes from one of these clusters, the probability that it is captured by another cluster is high. In that respect the clusters are acting as a confining wall and inhibiting quick escapes of the most energetic particles. These interactions between pre-formed clusters prevent their thermalisation before the “freeze-out” time. It can be seen in figure 13 that the maximum value of the ratio is higher for heavier systems. This effect should be reduced when the time during which clusters interact is reduced,i.e. when the available energy increases. This is observed in figure 15 which shows the evolution of the ratio with time for ( for the 13 + 13 system). At this energy, the reaction times are smaller and the ratio is always close to or below 1.
It could be argued that the observed evolution of ECRA clusters is only due to the algorithm of cluster recognition used. Since one tries to find the most bound partition, this could minimize the energies of clusters. It is indeed observed that ECRA clusters have an excitation energy below the MST clusters. One can make two remarks. The first one is that the has not been used to determine the ECRA clusters. There is hence no reason to find as an upper limit for the excitation energy for ECRA clusters. The second remark is that ECRA clusters with energies higher than can be found in some specific cases (see figure 13 for the 100 + 100 system) when particles cannot easily escape from clusters. The evolutions seen for ECRA clusters are then more likely due to the physics of the collision rather than to the definition of these clusters.
As in section II, the energy which can be stored in a thermalised cluster seems to be limited almost throughout the collision time. The detailed analysis shows that the exact value of this limitation may depend on reaction time and on the system size. Before the “freeze-out” time, this limit can be higher than if clusters are close enough together for a long time. This has been observed for the heaviest systems and for an value close to the binding energy of the fused system. After the “freeze-out” time, all clusters have an excitation energy per particle below .
If clusters are excited in a confining ”box” (wall, neighboring clusters) which prevents quick emission of monomers and small clusters, very high excitation energies can be deposited in these clusters: they are artificially bound by the confining wall or the neighboring clusters. If clusters are ”free” (no confining wall, no neighboring clusters), the energy deposition per particle can not exceed .
IV Conclusions
The energy deposition in clusters in cluster-cluster collisions has been studied in the framework of Classical N Body Dynamics. The mechanism of energy deposition seems to be the following: the excitation energy of clusters is mainly due to the relative velocity damping between the projectile and the target, and to a lesser extent to particle exchanges between them. The excitation per particle of thermalised clusters is limited by the energy of the least bound particle in the cluster. In the low energy regime (), the excitation energy increases when the impact parameter decreases and reaches its maximum value for the most central collisions (). For the intermediate energy regime () the picture is almost the same except that for central collisions the incomplete fusion system has an excitation energy per particle close to . For high energy regimes (), the maximum energy deposition is found for intermediate impact parameters () whereas for central collisions clusters are less excited and is always lower than .
This limitation of energy deposition is almost verified throughout the collision. High energy deposits () have been found for ECRA clusters and for heavy systems before the “freeze-out” time, which coincides with the thermalisation time of the clusters. This effect is mainly due to the times scales of the reaction. Above the “freeze-out” (thermalisation) time the excitation energy per particle of free clusters is below .
This limitation of energy deposition in thermalised clusters could be an explanation for rather low excitation energies found in primary fragments in nucleus-nucleus collisions. If this limitation is also true for nuclei, this would be in contradiction with many experimental works in which excitation energies well above the binding energy have been determined. This could shed new light on caloric curve analyses and on phase transitions studies.
Acknowledgments
I would like to warmly thank J.D.Frankland for his careful reading of this article and for valuable suggestions.
References
- (1) D.Jiang et al., Nucl. Phys. 503 , 560 (1989).
- (2) E.Vient et al., Nucl. Phys. A571 , 588 (1994).
- (3) J.B.Natowitz, R.Wada, T.Keutgen, A.Makeev, L.Qin, P.Smith and C.Hamilton, Phys. Rev. C65 , 034618 (2002).
- (4) K.H.Schmidt, M. V. Ricciardi, A. Botvina and T. Enqvist, in preparation , (2002).
- (5) J.Galin and U.Jahnke, J.Phys.G: Nucl. Part. Phys. 20 , 1105 (1994).
- (6) J.C.Steckmeyer et al. (INDRA Collaboration), Nucl. Phys. A686 , 537 (2001).
- (7) S.Levit P.Bonche and D.Vautherin, Nucl. Phys. A427 , 278 (1984).
- (8) S.Levit P.Bonche and D.Vautherin, Nucl. Phys. A436 , 265 (1986).
- (9) Y.G.Ma et al. (INDRA Collaboration), Phys. Let. B390 , 41 (1998).
- (10) J.Pochodzalla et al., Phys. Rev. Let. 75 , 1040 (1995).
- (11) B.Borderie et al. (INDRA Collaboration), Phys. Let. B388 , 224 (1996).
- (12) S.Hudan et al. (INDRA Collaboration), Proceedings of the XXXVIII International Winter Meeting on Nuclear Physics, Edited by I.Iori and A.Moroni, (2000).
- (13) N.Marie et al. (INDRA Collaboration), Phys. Rev. C58 , 256 (1998).
- (14) T.Lefort et al. (INDRA Collaboration), Nucl. Phys. , 397 (2000).
- (15) D.Doré et al. (INDRA Collaboration), Phys. Let. B491 , 15 (2000).
- (16) D.Doré et al. (INDRA Collaboration), Phys. Rev. C63 , 034612 (2001).
- (17) D.Cussol, Phys. Rev. C65 , 054614 (2002).
- (18) A.Strachan and C.Dorso, Phys. Rev. C59 , 285 (1999).
- (19) X.Campi, H.Krivine and N.Sator, Nucl. Phys. A681 , (2000).
- (20) W.H.Press, B.P.Flannery, S.A.Teukolsky and W.T.Vetterling. Numerical Recipes. Cambridge University Press (1989).
- (21) C.Dorso, S.Duarte and J.Randrup, Phys. Let. B188 , 287 (1987).
- (22) D.J.Wales and J.P.K.Doye, J. Phys. Chem. A101 , 5111 (1997).
- (23) A.Strachan and C.O.Dorso, Phys. Rev. C58 , R632 (1998).
- (24) J.A.Lopez and J.Randrup, Nucl. Phys. A503 , 183 (1989).
- (25) R.Nebauer et al. (INDRA Collaboration), Nucl. Phys. A658 , 67 (1999).
- (26) A.Strachan and C.O.Dorso, Phys. Rev. C55 , 775 (1997).
- (27) C.Dorso and J.Randrup, Phys. Let. B301 , 328 (1993).
- (28) J.Bondorf et al., Phys. Rep. 257 , 133 (1995).
- (29) D.H.E.Gross, Rep. Prog. Phys. 53 , 605 (1990).