Prediction and formation mechanism of triaxial superdeformed nuclei for
Abstract
The three dimensional Total Routhian Surface (TRS) calculations are carried out for 64 nuclei between to find triaxial superdeformed nuclei. Total of 12 nuclei were predicted to have triaxial superdeformation in which the neutron rotational energy plays a key role and the neutron shell energy plays additional role in the formation of triaxial superdeformed nuclei.
pacs:
PACS numbers: 21.60.Ev, 21.10.Pc, 27.50.+eI Introduction
Usually, the shape of a deformed nucleus is supposed as a ellipsoid with small hexadecapole deformation. In nilsson model, the frequency of harmonic oscillator is described as
| (1) |
where is the quadrupole deformation parameter and is the triaxial deformation parameter. Let the half axis of , , are , , , respectively, then from , we get the relations between , , and , :
| (2) | |||||
| (3) |
and
| (4) | |||||
here and is the radius of a sphere whose volume is equal to the ellipsoid volume. For example, when (axial ellipsoid), the and will take the volume of and , respectively. Such nuclei, i.e., and , is called axial superdeformed nuclei. While , the triaxial deformation will not be zero. For instance, if , then will be . Such nuclei which has large deformation and large quadrupole deformation is called triaxial superdeformed (TSD) nuclei. From Eq.(3) we can see that is sensitive to the difference of and .
Until now, many data for axial superdeformed nuclei are accumulated but the data for triaxial superdeformed nuclei are quite few. Only five nuclei, 163Lu, 165Lu, 167Lu, 171Ta, 86Zr[1-5] were identified experimently to have triaxial superdeformation. the triaxial behavior of 163Lu has been further confirmed experimentally by the discovery of the wobbling mode od01 . However, the triaxiality of most these TSD nuclei can only be explained by the theoretical calculations. Among these five discovered TSD nuclei, four are located in region and only one is in the region. The prediction of triaxial superdeformed nuclei in region has been done[6]. From that work several other nuclei besides the four discovered, were predicted to have triaxial superdeformation for proton configuration . It is also pointed out that the shapes may co-existences for other curtain configurations and a nucleus may have triaxial superdeformation in different q.p. configurations.
The TSD nuclei in , 86Zr, was discovered in 1998. It does not seems like that TSD 86Zr is a accident appeared in the region. Other TSD nuclei must exist in this region. In this paper, we attempt to give the prediction of the TSD nuclei near by TRS (Total Routhian Surface) calculations and their formation mechanism . Section 2 includes brief description of the three-dimensional TRS theory which is used to determine the nuclear deformation; Section 3 includes the prediction of TSD nuclei in region; Section 4 includes the discussion of the formation mechanism of the TSD nuclei; Section 5 gives a summary.
II A brief description of the TRS model
The hamiltonian of quasi-particles moving in a quadrupole deformed potential rotating around the -axis with a frequency may be written as
| (5) |
where denotes the deformed hamiltonian of single particle motion, the second term on the right hand side is the chemical potential, the third term is the pairing interaction and the last term stands for the Coriolis forces. The modified-harmonic-oscillator (MHO) potential with the parameters and for the mass region taken from Ref.[7] is employed in the present calculation. The pairing-gap parameter is determined empirically by , and is taken from experimental odd-even mass difference [8]. As an approximation, we did not take the deformation and rotation dependence of pairing into account.
The total routhian surface, namely the total energy in the rotating frame as a function of the , , and , of a nucleus for a fixed quasi-particle configuration c.f. may be calculated by
| (6) | |||||
Where is the liquid-drop model energy[9], is the quantal-effect correction to the energy, which includes both the shell[10] and pairing corrections[11]. The collective rotational energy may be calculated microscopically as the energy difference between the expectation values of with and without rotation, by using the wave function for the quasi-particle vacuum configuration[12]. The last term of Eq.(2) is the sum of quasi-particle energies belonging to the configuration c.f., which generates the deformation drive. All of the term in Eq.(2) depend on the numbers which are not written explicitly. The equilibrium deformations of nucleus may be calculated by minimizing the total routhian energy of Eq.(2) with respect to , , and . Here we put the hexadicapole deformation as a free parameter in order to get better results.
In the real process of minimizing the total routhian, we minimize the total routhian as a function of for each point and get two surface and first. Then from the surface of we can find the minimum and the corresponding and . From the , and , we may determine the value of . From these steps above, we may find the equilibrium deformation , and which possibly exists in the nucleus.
III The prediction of the triaxial superdeformed nuclei
Before the calculation of nuclei, the TRS method was checked and compared with the discovered TSD nuclei, 86Zr. Our calculated result, , is very coincident with the result in Ref.[5] , indicating the reliability of the method for the mass region.
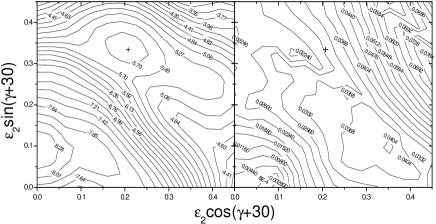
In the following, the progress that used to determine the deformation of a nuclei will be described detailly with the example of 80Kr. From the fact that the -ray energy within a superdeformed bands in is much higher than that in , we get that the superdeformed nuclei in rotates much faster than that in because the rotational frequency, , is approximately the half of the -ray energy. Thus, when we predict the shape of a nucleus in , the must be larger. In this paper, we fixed the as , where the MeV. In the three-dimensional calculation, the from to is divided to 11 points. The total routhian energy in each point will be minimized with respect to the corresponding 11 points. Fig.1(a) shows a contour plot of the total routhian surface in which each point corresponds to the same but different . In the Fig.1(a), there is a local minimum marked by “+” which has the deformation . The hexadecapole parameter , corresponding to the local minimum in Fig.1(a), is determined by Fig.1(b) which is the counter plot of . The in each grid point in Fig.1(b) is got from the minimization of the total routhian against . The symbol + in Fig.1(b) which corresponds to the minimum in Fig.1(a) has the as 0.030. Thus, the deformation of 80Kr at has been determined as . During the calculation, we do not add the quasi-particle energy (the last item in Eq.(6)) to the total routhian energy because for so high rotational frequency, one or two pairs of particle has been broken and it has been automatically included in the rotational energy part (see Sec.IV for details).
| Nuclei | Nuclei | ||||||
|---|---|---|---|---|---|---|---|
| 72Ni | 0.448 | 12.6∘ | 0.048 | 80Kr | 0.394 | 28.6∘ | 0.030 |
| 74Ni | 0.393 | 21.3∘ | 0.023 | 86Zr | 0.471 | 19.0∘ | 0.043 |
| 76Zn | 0.404 | 21.3∘ | 0.029 | 88Mo | 0.500 | 14.7∘ | 0.055 |
| 76Ge | 0.403 | 30.7∘ | 0.027 | 90Mo | 0.375 | 40.0∘ | 0.037 |
| 78Se | 0.396 | 32.7∘ | 0.027 | 90Ru | 0.483 | 23.1∘ | 0.045 |
| 80Se | 0.351 | 36.1∘ | 0.022 |
Following the step described above, we analyzed all of the stable even-even nuclei between , totally 64 nuclei. The predicted TSD nuclei are listed on Table I. In this paper, we call the deformation with and as triaxial superdeformation. So, in Table 1, only the TSD nuclei under the deformation condition, and , are listed.

The location of the predicted nuclei among the nuclei between is shown in Fig.2. In this figure, solid circles represent the predicted TSD nuclei, open circles axial SD nuclei, cross symbols the nuclei in which we did not find superdeformation. A obvious regular in this figure is that when , most of the nuclei have superdeformation. Especially, for nuclei of , most of them have triaxial superdeformation. Apparently, the neutron properties control the formation of axial superdeformation and triaxial superdeformation. How and why do the neutron properties control the formation mechanism of TSD nuclei?
IV Formation mechanism of TSD nuclei in
In Fig.2, it is obvious that the neutron numbers of the most predicted TSD nuclei are 44 and 46. Only 90Mo is an exception. This phenomenon indicates that the neutron property governs the formation of TSD nuclei.
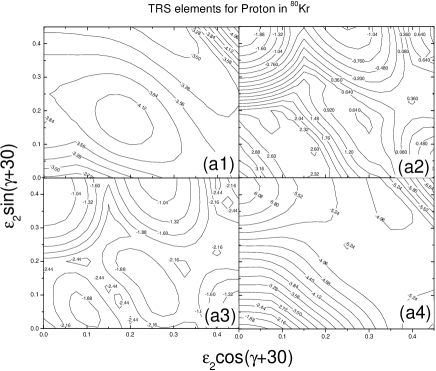
In order to discuss the mechanism detailly, the 80Kr, predicted to have triaxial superdeformation, is selected. According to the Eq.(6), most part of the total routhian energy, , , and ( ) are plotted in Fig.3. Fig.3(a) and Fig.3(b) show the TRS elements of proton and neutron in 80Kr, respectively. The energy scale of the contour lines is 0.28MeV.
In Fig.3(a1), the surface of proton rotational energy is flat and the deformation of the local minimum is small. Therefore, the proton rotating energy cannot affect the formation of TSD shape. In Fig.3(a2), although the proton shell correction energy has two deep minimums, the proton pairing correction energy, shown in Fig.3(a3), has two high peeks near the minimum in Fig.3(a) and canceled the minimum of shell correction energy. The sum of the three type of energy, , shown in Fig.3(a4), is flat in the center part of the surface. This means that the proton properties in 80Kr is helpless to form TSD nuclei.
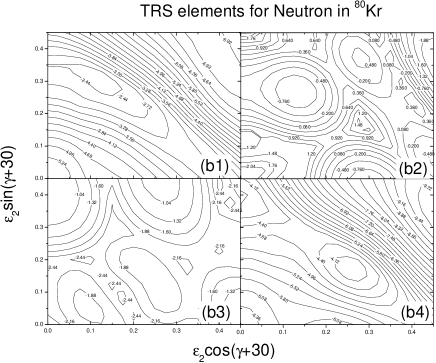
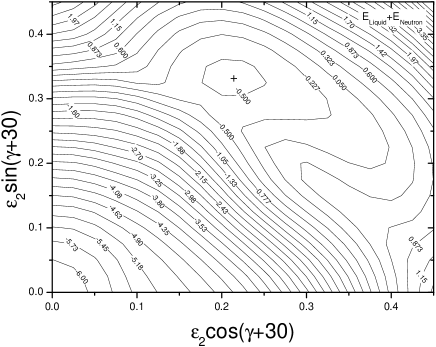
However, the neutron properties, shown in Fig.3(b), is different from Fig.3(a). The neutron rotational energy, shown in Fig.3(b1) decreases sharply with increasing large deformation and therefore has a strong driving effect towards large elongation deformation. In Fig.3(b2), the neutron shell correction has two minimums but were canceled by the pairing energy shown in Fig.3(b3). Thus, the driving force in large quadrupole deformation is remained. Summing the three neutron parts of total routhian energy, , we obtain Fig.3(b4). This figure is most similar to Fig.3(b1), having small driving effect to spherical deformation and large driving effect to large quadrupole deformation. This is very important for 80Kr to form TSD shape. Fig.4 shows the sum of liquid drop energy and . A large quadrupole and triaxial minimum appeared on this surface. Since the is flat in this region, the minimum shown in Fig.4 exists also in the total routhian surface, see Fig.1. In the formation of TSD shape, the rotational energy plays a crucial role. Because the neutron shell correction energy also decreases sharply in large deformation, it also has the additional role to form TSD shape.
To confirm that the reason is also effective for other nuclei in region, we also analyzed 78Se which is predicted to have TSD shape and 86Kr which is predicted to have no TSD shape. The results supported our analysis of the formation mechanism of TSD nuclei that the rotational energy plays a key role and neutron shell energy plays an additional role in the formation of TSD nuclei.
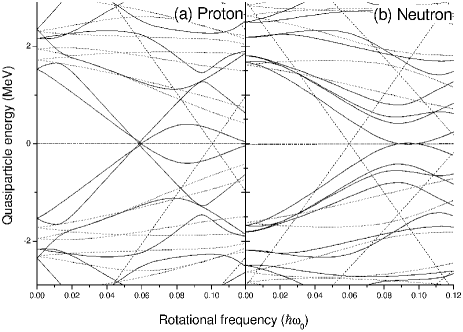
It has been pointed out that the rotational energy is the difference between the expectation value of (Eq.(5)) with and without rotation. When the rotational frequency is high, the pair of protons and/or neutrons will be broken and their angular momentum alignment will affect the rotational energy. In order to see the broken pair of protons and neutrons, the calculated q.p. routhians are presented in Fig.5(a) for protons and Fig.5(b) for neutrons. In Fig.5(a), [431]3/2 orbit crosses with the [440]1/2 orbit at for protons, while in Fig.5(b), [420]1/2 orbit crosses with the [413]7/2 orbit for both in for neutrons. Therefore, When 80Kr rotates at , there is one proton pair and two neutron pairs are broken and this will take effect on the rotational energy.
Compared with the analysis of TSD nuclei in region, the quadrupole deformation parameters of predicted TSD nuclei in region are larger than those in region. And also, the formation mechanism is different between the two regions. In region, the neutron shell correction energy controls the formation of TSD nuclei, while in region, rotating energy, which include the effect of q.p. angular momentum alignments, controls the formation of TSD nuclei.
V Summary
In summary, fixing the rotational frequency as ,11 nuclei are predicted to have triaxial superdeformation under the condition of and by the three dimensional TRS calculation in region. Most of these TSD nuclei are located in the region, only 90Mo is a exceptional. By analyzing the formation mechanism of TSD nuclei in the region, we find that the neutron rotational energy which includes the contribution of quasiparticle angular momentum alignment plays a key role to form TSD nuclei and the neutron shell energy plays additional role.
Acknowledgements
This work is supported by the NNSF of China under Grant No.s 10075078, 19935030 and 10004701, and the MSBRDP of China under Grant No. G20000774.
References
- (1) S. W. Odegard et al., Phys. Rev. Lett. 86 (2001) 5866
- (2) W. Schmitz, C. X. Yang, H. Hubel, et. al., Nucl. Phys. A539(1992)112
- (3) H. Schnack-Petersen, R. Bengtsson, R. A. Bark, et. al., Nucl. Phys. A594(1995)175
- (4) Wu Xiao-guang, Yang Chun-xiang, Zheng Hua, et. al., Chin. Phys. Lett. 14(1997)17
- (5) C. X. Yang, X. G. Wu, H. Zheng, et. al., Phys. J. A1, (1998)237
- (6) D. G. Sarantites, D. R. Lafosse, M. Devlin, Phys. Rev. C57, (1998)R1
- (7) C. W. Shen, to be published
- (8) I. Ragnarsson and R. K. Sheline, Phys. Scr. 29(1984)385
- (9) A. H. Wapstra and G. Audi, Nucl. Phys. A432(1985)1
- (10) W. D. Myers and W. Swiatecki, Ark. Fys. 361(1967)343
- (11) V. M. Strutinsky, Nucl. Phys. A122(1968)1; A95(1967)420
- (12) R. Wyss, J. Nyberg, A. Johnson, R. Bengtsson and W. Nazarewicz, Phys. Lett. B215(1988)211
- (13) Y. S. Chen, S. Fraundorf and L. L. Riedinger, Phys. Lett. B171(1986)7