Possible Origin of RHIC HBT Results
Abstract
The effects of opacity of the nuclei together with a blackbody type of emission along the system history are considered as a means to explain the ratio observed by STAR and PHENIX collaborations at RHIC. Within our model, no flow is required to explain the data trend of this ratio for large surface emissivities.
BNL-69354
FERMILAB-Conf-02/227-T
IFT-P.070/02
The unexpected results presented by STAR[1] in the previous Quark Matter meeting on HBT, later confirmed by PHENIX[2], regarding the decrease of the ratio for increasing , has been challenging explanations since that time. Hydrodynamic models and microscopic-based simulations usually predicted the opposite behavior for increasing pair momentum.
Motivated by this challenge we proposed a simple model (see [3] for details) to try and understand the unforseen decrease of the outwards radius (along the direction of the average transverse momentum of the pair of pions, ) relative to the sidewards one (i.e., orthogonal to ). Two were the main ingredients of this attempt. The first was to consider the particle emission of a blackbody type, radiating from the external surface of the system during its entire evolution. The second was to treat this system as an opaque source. The other basic ingredients were not unusual. The system produced in a heavy ion collision is supposed to be formed above the critical temperature, , at the time , in a Quark-Gluon Plasma (QGP) phase. Its temperature gradually decreases while it expands and for the sake of simplicity, the expansion is considered to be only along the longitudinal direction. After this initial stage, lasting about (), where correspond to the on-set of the phase-transition at the temperature , the mixed phase begins, during which the temperature remains constant with time. The mixed phase continues for a longer period, ending after an elapsed interval (). Then, the system converted into a gas of pions (no resonances are included) expands further, until the decoupling temperature, , is reached. At this point, the system is quite dilute, since most of the particles have already been evaporated from its surface. Thus, at the time , the system is supposed to decouple in an instantaneous volumetric emission. No complex mechanism for the hadronization of quarks and gluons is considered in detail at this point, although hadronization must take place. In other word, in first approximation, the evaporation of “gluons” and “quarks” (as hadronized pions) from the external surface of the system is considered in the same way as emission of pions, except for the number of degrees of freedom.
The Bjorken hydrodynamical model[4] is assumed to describe the system during its entire evolution, i.e., since it is formed and until it breaks up. This is supplemented with a blackbody type of radiation from the surface of the matter from its formation. The emitting source is supposed to be opaque, in a generalized version of opacity proposed by Heiselberg and Vischer[5] at CERN energies, later followed by Heinz and Tomás̆ik [6].
To compute the emitted spectrum and the two particle distribution function, the Covariant Current Ensemble formalism, [7], is adopted. In this formalism, the two particle correlation function can be written as , where and are, respectively, the single particle distribution and the probability for simultaneous observation of two particles with momenta and . The average and the relative momentum of the pair are defined as and .
The emitted energy as well as the total entropy associated to each stage of the system evolution can be estimated. Just for a brief illustration, I write down the emitted energy as a function of time in the initial stage by considering the emission by an expanding cylinder of transverse radius and length , in the time interval and , as , where the first term comes from the blackbody type of energy radiated from the external surface of the cylinder, and the second term results from the mechanical work due to its expansion. The factor was introduced to take into account that the system has some opacity to surface emission. The constant is the Stefan-Boltzmann constant and is proportional to the number of degrees of freedom in the system. By integrating this expression the energy density can be obtained as . From this expression it can be seen that the multiplicative factor, , appears in addition to that coming from the Bjorken picture. The variation of the temperature in the initial stage, i.e., prior to the beginning of the phase transition, follows immediately as . The instant corresponding to the beginning of the mixed phase, , when MeV is reached, that one corresponding to its end, at , as well as and the decoupling time, , at MeV, are given by .
Finally, the initial values of the temperature, and the formation time, , are related to the initial entropy, and to the input number of particles, (chosen to match the average experimental pion multiplicity per unit of rapidity at RHIC, ), by , where , as estimated by the entropy per particle () of a pion gas at freeze-out. Then, MeV and fm. The degeneracy factors, , account for the gluon and quark (antiquark) degrees of freedom ( for two quark flavors). In the case of pions, the degeneracy factor is . I illustrate in the table below the time variables for two different assumptions on the emissivity, . I also write the estimated fraction of the particles emitted from the surface during the period , , relative to the total number of produced particles, , as well as the remnant portion at freeze-out, , then emitted from the entire volume.
| (fm/c) | (fm/c) | (fm/c) | (fm/c) | () | (at ) | |
|---|---|---|---|---|---|---|
| 1 | 0.160 | 1.54 | 5.73 | 6.97 | 0.844 | 0.156 |
| 0.5 | 0.160 | 1.75 | 8.37 | 10.5 | 0.758 | 0.242 |
In order to check how the spectra estimated within our model behave as compared to data (PHENIX minimum bias [8]), I plot its predictions on the single-inclusive distribution in Fig. 1(a). The estimates and discussions presented here are restricted to the central rapidity region, i.e., (which implies that , and, consequently, and ). In Fig. 1(b) I show the results for the ratio vs. , together with the preliminary STAR[1] (filled triangles) and PHENIX[2] (filled circles) data for both and interferometry.
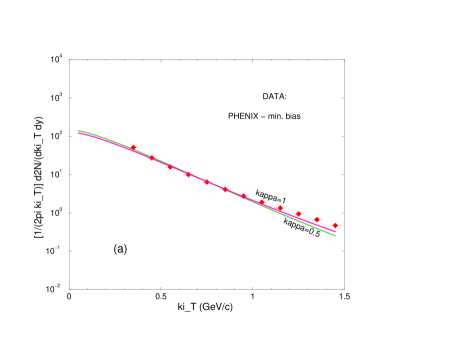
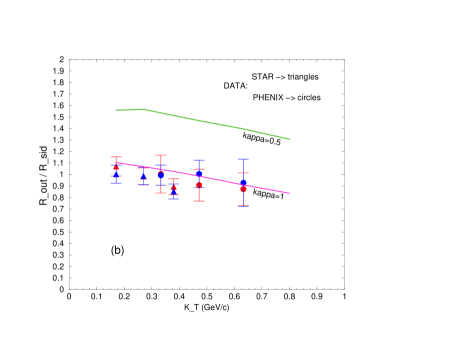
As seen from the plots in Figure 1, our results were extremely successful in describing both sets of data for , but the curve corresponding to is away above the data limits, suggesting that there should be high emissivity along the system history in order to explain the data trend. The model also describes the typical source radii reasonably well, but not the dependence of these radii (see [3] for details). This suggests that the time variation of the emitting radius and the introduction of transverse flow may play a significant role, [9]-[11]. If there is a time variation of the various radii, this will be correlated with the typical momentum scale of emitted particles, since the earlier is the time, the hotter are the particles. Our model is sensitive to such variation since emission from the hot surface is allowed at early times. Also, a proper treatment of the decoupling is not included in our computations, which would affect the results, although it might also suggest modification in the treatment of decoupling, [11],[12].
The principal reason why such a small ratio of vs. is obtained within our model is probably due to a combination of two effects. The first is that the surface is opaque, and whatever is emitted from the surface will have a small value of this radius. The second effect is that black body radiation by partons is allowed when the surface is very hot. This allows a much larger contribution from surface emission than is typical of what happens in hydrodynamical simulations, where particles are emitted by Cooper-Frye decoupling from a surface at very low temperature. In fact about of the emission comes from the surface in our model. The fact that so many particle are emitted from the surface at early times also means that the longitudinal decoupling time in this computation is significantly shorter than would be the case for hydrodynamic simulations. I should add that many of the features of the model proposed and discussed here are embodied in the hydrodynamic computations of Heinz and Kolb[13]. The main difference lies in the treatment of an essential ingredient, the emissivity of the surface.
I am deeply grateful to Larry McLerran and the Nuclear Theory Group at BNL, as well as to Keith Ellis and the Theoretical Physics Department at Fermilab, for their kind hospitality during the elaboration of this work. This research was partially supported by CNPq (Proc. N. 200410/82-2). This manuscript has been authored under Contracts No. DE-AC02-98CH10886 and No. DE-AC02-76CH0300 with the U.S. Department of Energy.
References
- [1] F. Laue, Proc. Quark Matter 2001, Nucl. Phys. A698 (2002) 177c; C. Alder et al., STAR Collab., Phys. Rev. Lett. 87 (2001) 082301.
- [2] S. Johnson, RHIC/INT Workshop on ”Correlations and Fluctuations in Heavy-Ion Collisions at RHIC”, Jan 4-6 2002; K. Adcox et al, Phys. Rev. Lett. 88 (2002) 192302.
- [3] Larry McLerran and Sandra S. Padula, nucl-th/0205028.
- [4] J. D. Bjorken, Phys. Rev. D27 (1983) 140.
- [5] H. Heiselberg and A. P. Vischer, Eur. Phys. J. C1 (1998) 593; H. Heiselberg, Phys. Lett. B421 (1998) 18.
- [6] B. Tomás̆ik and U. Heinz, nucl-th/9805016; Acta Phys. Slov. 49 (1999) 251.
- [7] M. Gyulassy, S.K. Kaufmann, and L.W. Wilson, Phys. Rev. C20 (1979) 2267; K. Kolehmainen and M. Gyulassy, Phys. Lett. B180 (1986) 203; Sandra S. Padula, M. Gyulassy, and S. Gavin, Nucl. Phys. B329 (1990) 357.
- [8] K. Adcox et al., Submitted to PRL, preprint nucl-ex/0112006.
- [9] U. Heinz and P. Kolb, hep-ph/0204061.
- [10] Tetsufumi Hirano, Keiichi Tsuda, and Kohei Kajimoto, nucl-th/0011087.
- [11] D. Teaney, J. Lauret, and Edward V. Shuryak, Phys. Rev. Lett. 86 (2001) 4783.
- [12] S. Soff, S. A. Bass, and A. Dumitru, Phys. Rev. Lett. 86 (2001) 3981.
- [13] U. Heinz and P. Kolb, Nucl. Phys. A702, 269 (2002).