Anomalous Behavior of 2+ Excitations around 132Sn
Abstract
In certain neutron-rich Te isotopes, a decrease in the energy of the first excited state is accompanied by a decrease in the strength to that state from the ground state, contradicting simple systematics and general intuition about quadrupole collectivity. We use a separable quadrupole-plus-pairing Hamiltonian and the quasiparticle random phase approximation to calculate energies, strengths, and factors for the lowest states near 132Sn (). We trace the anomalous behavior in the Te isotopes to a reduced neutron pairing above the = 82 magic gap.
I Introduction
As experiment pushes towards the nuclear drip line, it is becoming possible to examine isotopic chains over increasingly large ranges of and . We have new opportunities to test systematics and the ideas that underlie them. One region in which experimental progress has been made recently surrounds the neutron-rich doubly magic isotope 132Sn. In particular, recent Ref. [Rad02] reports measurements of the transition strengths (or for short) from the ground state to the lowest 2+ state for 132Te, 134Te, and 136Te. The authors discovered that ’s and the energies of the lowest 2+ states () behave differently in the Te isotopes (with = 80, 82, and 84) than in those of Xe, Ba, and Ce which have more protons. In most isotopic chains, including those three, a decrease in is accompanied by an increase in as the states become collective. This is not the case in 132,136Te, where the decreases as decreases.
Our work explains this unusual behavior. Our tool is the quasiparticle random phase approximation (QRPA), in conjunction with a simple schematic interaction, which we apply to even-even nuclei in the mass region and (and a much larger range of for the Sn chain). The QRPA is a well-established method for describing vibrational states [Kis63] and has advantages of simplicity, particularly when separable interactions are used and exchange terms neglected. One should mention, that there exist large-scale shell-model calculations for selected nuclei around 132Sn [Cov02] ; [Rad02] ; [Ots02] . However, at the present stage, these calculations use different spaces (and interactions) for nuclei above and below the =82 magic gap. Our model, albeit more phenomenological, uses the same Hamiltonian in both regions.
This paper is organized as follows: In Sec. II we review phenomenological and simple microscopic approaches to the systematics of and . In Sec. III we give an overview of the experimental data around 132Sn and discuss their significant properties. In Sec. IV we use the Hartree-Fock-Bogoliubov (HFB) method to discuss static properties of the ground states. The QRPA model is described in Sec. V. We show results of the QRPA calculation for the lowest states in Sec. VI and discuss the origin of the irregular behavior of from a microscopic point of view in Sec. VII. The factors for Xe, Te, and Sn isotopes are treated in Sec. VIII. Finally, Sec. IX summarizes this work.
II Relation between and
The systematic relation between ’s and ’s is an old topic. One early phenomenological relation (by Grodzins [Gro62] ) is
| (1) |
and another (by Raman et al. [Ram01] ) is
| (2) |
The latter reproduces most of more than 300 experimental data points to within a factor of 2. Both these formulae, after factoring out a gentle dependence on and , assert that ’s are inversely proportional to ’s. For vibrational states, this result is predicted, if mass parameter is constant, by the liquid drop model [Boh75] , which gives
| (3) |
where is the nuclear radius, and the quadrupole mass parameter. denotes the number of phonons. It also falls out of an RPA treatment of collective excitations in the simple microscopic model of Brown and Bolsterli [Bro59] and others [Hey90] ; [Rin80] . In physical terms, collectivity lowers the energy of attractive modes while at the same time increasing the transition strength because nucleons contribute coherently to the transition.
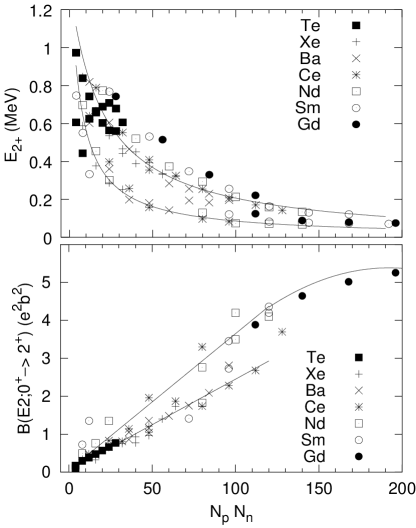
Another successful way of classifying collective states is the scheme [Ham65] ; [Cas85] ; [Cas90a] . Both the ’s and ’s lie on smooth curves when plotted as functions of , where is the number of valence proton (neutron) particles or holes. The plot for some nuclei around those considered in this work is shown in Fig. 1. The data points can be divided, approximately, into two well-correlated groups: those for (the upper and the lower branches) and those for (the lower and the upper branches). The plots reveal a clear asymmetry in the states with respect to . That is, the systems have lower and higher as compared to their partners. This would suggest increased quadrupole collectivity in the region above . However, as discussed in the following, deviation from this general trend can be found.
III Overview of data around 132Sn ()
Let us survey the experimental data relevant to this paper. Figure 2 shows ’s and ’s for the lowest states of even-even nuclei as functions of neutron number. Both observables are fairly symmetric around for the Xe–Ce isotopes indicating that particle and hole excitations in those nuclei play similar roles. Actually, some of the ’s in Ce and Ba in the region are slightly larger than those with the same in ; similarly the ’s for are lower than those for , in a way consistent with the plots of Fig. 1. Clearly these isotopes follow the usual relation between and .
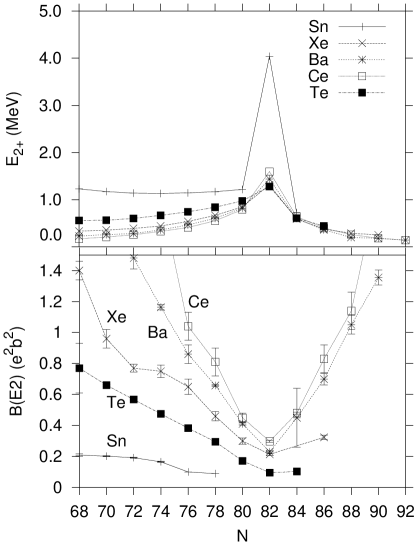
On the other hand, 132Te, 134Te, and 136Te behave differently. The is not symmetric adjacent to = 82, a fact that is even more significant when looking at the corresponding energies in Fig. 2. The state in 136Te lies 370 keV lower than that of 132Te, but nevertheless the in 136Te is smaller than that in 132Te. The situation violates the pattern of typical collective behavior discussed above. [This behavior does not appear anomalous on the plots of Fig. 1 because of the scale of the figure, however, = 4 for both 132Te and 136Te, and = 0.974 MeV, = 0.606 MeV, = 0.172 , and = 0.103 .]
IV HFB calculations

As a prelude to our QRPA treatment of the vibrations, we calculate static shape and pairing deformations in the Hartree-Fock-Bogoliubov (HFB) model of Refs. [Sto99] ; [Sto98b] ; [Sto98c] ; [Dob02] ; [Sto02] . We perform axially deformed HFB calculations with the particle-hole Skyrme forces SLy4 [Cha97] and an intermediate contact delta pairing force [Dob02] . The resulting quadrupole deformation parameter , being total quadrupole moment and R – rms radius, is shown in Fig. 3. It indicates that the static deformation of the nuclei with = 80 and 84 is zero or small () compared to those of the mid-shell nuclei. We can therefore treat the states in these nuclei as vibrations around a spherical shape.
In general, the HFB calculations follow the trend discussed earlier. The values above the gap are systematically increased for . The strongest asymmetry in the pattern of is predicted for the Te isotopes.

Figure 4 shows predicted neutron pairing gaps. Since pairing is a symmetry-restoring interaction, the calculated pairing gaps are anticorrelated with the quadrupole deformations. Consequently, the values of are systematically lower as one crosses the gap. In particular, in most cases .
V QRPA calculation
The Hamiltonian we use in our QRPA calculation is
| (4) |
where is the single-particle energy, and is the creation operator of a nucleon in the state . is the chemical potential, which depends on the isospin z-component . is the pairing gap, and is the monopole pair creation operator.
As a residual two-body interaction, we use the sum of an isoscalar quadrupole force , an isovector quadrupole force , and a quadrupole pairing force , defined as follows:
| (5) |
where denotes the time-reversed state of . For , we use the self-consistent values of Ref. [Dob88] ; for , we use the value MeV fm-4. (As will be seen later, the results of QRPA calculations are fairly insensitive to the choice of .) We fix the quadrupole pairing strengths according to the prescription proposed in Ref. [Kub96] . [We refer to this value as (self).] Our QRPA equations are in the standard matrix form, as in Ch. 14 of Ref. [Row70] , and, as usual, we neglect the exchange terms of the multipole-multipole interactions.

Our calculations are performed in a single-particle (s.p.) space of several harmonic-oscillator shells ( = 2–6 for protons and = 2–7 for neutrons). Since our configuration space is large, we use the bare, rather than effective, charges in calculating . We take s.p. energies from experimental data around 132Sn, shown in Fig. 5. (When the levels are not available this way, we use Woods-Saxon energies [Cwi87] for bound levels and Nilsson energies [Nil69] for unbound levels.) It is worth noting that the neutron level density just below the 82 shell gap is much larger than it is above the gap. This is due to the near-degeneracy of , , and shells and a fairly large energy gap between the and shells. As we will see, this difference plays a crucial role in the anomalous behavior of the Te isotopes.

Figure 6 shows the experimental pairing gaps obtained from odd-even mass differences, according to the prescription of Ref. [Dob01] , and gaps calculated by the HFB-Lipkin-Nogami method [Dob02b] . We note that the HFB-Lipkin-Nogami calculation, which partly corrects for particle number fluctuations, reproduces experimental trends very well. The neutron pairing gap in the Sn, Te, and Xe isotopes decreases as increases and crosses = 82. This effect, clearly seen also in the HFB calculation of Fig. 4, has been noticed earlier, cf. Ref. [Dob02] . In our QRPA calculations, we used renormalized experimental pairing gaps. The renormalization factors, reflecting the reduction of pairing in excited states, were adjusted to experimental data in the Sn isotopes. The renormalization factor turned out to be 0.6 (0.9) for neutrons (protons). For magic nuclei with and/or , we took = 0.4 MeV, a somewhat arbitrary value, reflecting the weak pairing correlations in magic nuclei. (Experimental odd-even mass differences for magic nuclei do not determine pairing gaps well [Dob01] .) We used the average of the proton pairing gaps at and 84 for at to avoid the sudden decrease at the magic number.
VI Results of QRPA Calculations


We carried out QRPA calculations for even- isotopes of Sn with = 64–84, and for the = 80, 82, 84 isotopes of Te, Xe, Ba, and Ce, which are nearly spherical in our HFB calculations. Figure 7 shows the calculated lowest 2+ energies and ’s, along with the experimental data. The calculations reproduce the experimental trend quite well, in particular the asymmetry around of the ’s in the Te isotopes. We also predict an inverted, and more symmetric, curve for the ’s in the Sn isotopes with = 80–84. This kind of inversion is well known to occur in the Pb region around = 126 [Ram01] . (For more discussion of this point, see Sec. VII.) For comparison, Fig. 8 shows the results with the pure Nilsson spectrum (parameters from Ref. [Nil69] ). The collectivity in the = 68–76 isotopes of Sn is enhanced here, but otherwise Figs. 7 and 8 are fairly similar. Kubo et al. [Kub96] performed calculations in Sn isotopes up to = 74 with a similar Hamiltonian and obtained similar results. In the shell-model calculation of Ref. [Rad02] , for 134Te (136Te ) turned out to be 0.088 (0.25) , i.e., the transition rate has been predicted to increase when going from =82 to =84.
We checked the stability of our calculations by varying the strengths of the isovector quadrupole force and the quadrupole pairing force. Figures 9 and 10 show the results in Te. The unusual behavior around clearly is not sensitive to the strengths of these forces. Based on all these results, we conclude that the QRPA prediction of the unusual behavior around 136Te is robust and does not depend significantly on model details, except for neutron pairing.
VII Abnormal pattern of Quadrupole Collectivity in the neutron-rich Te isotopes

What is the reason for the unusual behavior of the Te isotopes around , i.e. the fact that both and the are smaller in 136Te than in 132Te? The ingredient in our calculations that displays the most asymmetry around is the neutron pairing gap. To understand how it affects the results, we performed QRPA calculations in 136Te for different values of . The results are shown in Fig. 11. As decreases from 0.6 MeV to 0.4 MeV, both the and decrease, indeed suggesting that this quantity plays the key role in the unusual trend we want to explain. To get more insight, we consider the forward () and backward () QRPA amplitudes in the lowest-energy excitation
| (6) |
where and create and annihilate a quasiparticle in the state , and is the QRPA ground state. The QRPA amplitudes and depend on the ratios
| (7) |
respectively, where is the BCS quasiparticle energy. The bottom portion of Fig. 11 shows that these quantities depend significantly on the neutron pairing gap as well.
| 132Te | 134Te | 136Te | 134Xe | 136Xe | 138Xe | |
|---|---|---|---|---|---|---|
| 0.63 | 0.99 | 0.12 | 0.76 | 0.99 | 0.52 | |
| 0.44 | 0.02 | 0.97 | 0.40 | 0.04 | 0.67 | |
| 0.03 | 0.00 | 0.04 | 0.08 | 0.01 | 0.09 | |
| 0.04 | 0.01 | 0.05 | 0.08 | 0.02 | 0.10 |
The reason for the unusual behavior can be surmised from these figures. The decreased neutron pairing gap in 136Te means that the lowest neutron quasiparticle energies are lower than those in 132Te (0.792 MeV for 132Te and 0.460 MeV for 136Te). As a result, the energy of the lowest state decreases when one crosses . But the low-lying neutron quasiparticle energies also cause the neutron amplitudes in the wave function to increase and the proton amplitudes to decrease, as Fig. 11 and Table I show. Since the is determined solely by protons, it decreases as well. In other words, the behavior of the lowest states reflects properties of the s.p. spectrum — the fact that it is more dense below than above (see Sec. V), giving rise to a larger pairing gap — more than collective quadrupole effects induced by the residual interaction. This is not a total surprise given that both isotopes have only 2 valence neutrons (or neutron holes).

In the Xe, Ba, and Ce, isotopes, the increased number of protons makes proton pairing and the neutron-proton quadrupole-quadrupole interaction more important and reduces the effectiveness of the s.p. mechanism just described. This is nicely illustrated in Fig. 12 for 138Xe. One can see the usual relation between and and a clear difference between Te and Xe in the -dependence of . In Xe, increases as the proton amplitude decreases, indicating increased collectivity.
The value of in 134Te is smaller than that of 132Te, in spite of the large proton amplitude (see Table I). However, the state in 134Te corresponds to one two-quasiparticle configuration , while the strength in 132Te and 136Te is more fragmented, indicating the collective character of the state.

We close this section by discussing the behavior of of 130Sn–134Sn mentioned in Sect. VI (see Fig. 7). For this purpose, Fig. 13 shows summed QRPA amplitudes for protons and neutrons in the Sn isotopes. It is clear that the neutron amplitudes are dominant in all cases. However, at 132Sn, both proton and neutron low-energy excitations are hindered; therefore the neutron amplitude decreases and the proton contribution increases, compared to the other isotopes. This change causes a local increase in at 132Sn. (When the collectivity is small, reflects the magnitude of the proton amplitudes directly.) Since the nucleus is in a neutron-rich region, however, matrix elements of the quadrupole operators of the neutrons are larger, on average, near the Fermi surface than those of the protons. Thus, excitations of the neutrons are still dominant in the state of 132Sn.
VIII factors of Xe, Te, and Sn isotopes
The abnormal behavior of the ’s and ’s around 132Sn reflects the variations of proton and neutron amplitudes in the wave function of the lowest state. Therefore, we analyze the factor in neighboring nuclei; they are very sensitive to relative proton/neutron compositions.
| 134Xe | 136Xe | 138Xe | |
|---|---|---|---|
| exp. | 0.354(7) | 0.766(45) | |
| cal. | 0.585 | 0.716 | 0.291 |
| neutron | proton | |||
|---|---|---|---|---|
| fit | th. | fit | th. | |
| 2 | 0.554 | 0.534 | 0.544 | 0.419 |
| 1 | 0.223 | 0.243 | 1.39 | 1.264 |
| 3 | 2.65 | 2.674 | 4.04 | 3.906 |
| 2 | 0.514 | 0.535 | 1.54 | 1.581 |
| 1 | 0.317 | 0.297 | 0.803 | 0.677 |
We have calculated the factors of 134Xe, 136Xe, and 138Xe, and compare with recent data [Jak02] in Table II. As usual, we multiplied the bare spin factors by 0.7, and took bare factors [Boh75] ; [Rin80] ; [Hey90] . Our factor in 136Xe is larger than in 134Xe, though not by as much as the data (see also Ref. [Kis63] ). We show the corresponding proton and neutron QRPA amplitudes of 2+ states in Table I. Protons are more important in 134Xe and 136Xe, while neutrons are more important in 138Xe. We found by analyzing the amplitudes that the main component of the 2+ states of 134Xe and 136Xe is (1)2, while those of 138Xe are (1)2 and (2)2. It is interesting to compare the factors with those of the single-particle states in Table III. The observed factors for 134Xe and 136Xe support the idea that the states of these nuclei consist mainly of proton excitations (see Ref. [Jak02] ); our calculation is consistent with this picture. The large factors of the proton 1, 3, and 2 orbitals suggest that the nuclear factors are sensitive to the small admixtures of these orbitals. The Xe isotopes therefore provide a severe test case of the many-body wave function.
| 132Te | 134Te | 136Te |
|---|---|---|
| 0.491 | 0.695 | 0.174 |
Table IV displays calculated factors of the neutron-rich Te isotopes. The neutron dominance in our 136Te wave function clearly lowers the predicted factor there. It would be interesting to test this prediction experimentally.

Finally, Fig. 14 shows calculated factors of Sn isotopes compared to the experimental data. The behavior of the factors up to = 74 can be understood in terms of the negative single-neutron -factors of the 1, 2, and 3 shells (see Table III and Ref. [Has80] ). Around =78, however, the 2 orbital carrying a positive factor becomes occupied, and this gives rise to positive -factors in 128,130,132Sn. Above =82, the structure of the lowest 2+ state is dominated by shell, and -factors drop again.
IX Summary
In this paper, we have investigated the irregular behavior of ’s and ’s in 132Te–136Te through the QRPA with a simple separable interaction. Our QRPA calculations reproduce the behavior seen in experiment, and we trace the cause to the difference in neutron pairing below and above . The decrease in with is clearly seen in experimental systematics and in self-consistent calculations. The results of our phenomenological model are fairly robust and depend only weakly on other model parameters. A related finding is that the in 132Sn should be larger than in its immediate Sn neighbors, as is the case around 208Pb. We hope that this prediction will stimulate further measurements in the neutron-rich region around 132Sn.
To strengthen our argument about neutron dominance in the wave function of the state in 136Te, we also calculated factors of the Xe, Te, and Sn isotopes. We reproduced the experimental trends and found that while protons dominate the excitation amplitudes in 134Xe and 136Xe, the factor of the state of 136Te is dramatically reduced. The experimental discovery of this effect as well as significant behavior of 128Sn–134Sn would validate our understanding of the structure of nuclei around 132Sn.
Acknowledgements.
Discussions with C. Baktash, D.C. Radford, H. Sakamoto, and K. Matsuyanagi are gratefully acknowledged. We are indebted to A. Stuchbery for information on the recently measured factors. This work was supported in part by the U.S. Department of Energy under Contract Nos. DE-FG02-96ER40963 (University of Tennessee), DE-AC05-00OR22725 with UT-Battelle, LLC (Oak Ridge National Laboratory), and DE-FG02-97ER41019 (University of North Carolina), and by the National Science Foundation Contract No. 0124053 (U.S.-Japan Cooperative Science Award).References
- (1) D.C. Radford, C. Baktash, J.R. Beene, B. Fuentes, A. Galindo-Uribarri, C.J. Gross, P.A. Hausladen, T.A. Lewis, P.E. Mueller, E. Padilla, D. Shapira, D.W. Stracener, C.-H. Yu, C.J. Barton, M.A. Caprio, L. Coraggio, A. Covello, A. Gargano, D.J. Hartley, and N.V. Zamfir, Phys. Rev. Lett. 88, 222501 (2002).
- (2) L.S. Kisslinger and R.A. Sorensen, Rev. Mod. Phys. 35, 853 (1963).
- (3) A. Covello, A. Gargano, P. Guazzani, L. Zetta, Y. Eisermann, G. Graw, R. Hertenberger, and M. Jaskla, in Challenges of Nuclear Structure, Proceedings of the 7th Int. Spring Seminar on Nuclear Physics, Maiori, Italy, edited by A. Covello (World Scientific Pub., Singapore, 2002) p. 327.
- (4) T. Otsuka, in Proc. Int. Conf. on Nuclear Structure, Mapping the Triangle, Grand Teton National Park, Wyoming, 2002, to be published.
- (5) L. Grodzins, Phys. Lett. 2, 88 (1962).
- (6) S. Raman, C.W. Nestor, Jr., and P. Tikkanen, Atom. Data Nucl. Data Tab. 78, 1 (2001).
- (7) A. Bohr and B.R. Mottelson, Nuclear Structure (Benjamin, New York, 1969 and Reading, 1975).
- (8) G.E. Brown and M. Bolsterli, Phys. Rev. Lett. 3, 472 (1959).
- (9) K. Heyde, The Nuclear Shell Model (Springer-Verlag, Berlin, 1990).
- (10) P. Ring and P. Schuck, The Nuclear Many-Body Problem (Springer-Verlag, New York, 1980).
- (11) I. Hamamoto, Nucl. Phys. 73, 225 (1965).
- (12) R.F. Casten, Nucl. Phys. A 443, 1 (1985).
- (13) R.F. Casten, Nuclear Structure from a Simple Perspective (Oxford Univ. Press, Oxford, 1990).
- (14) M.V. Stoitsov, J. Dobaczewski, P. Ring, and S. Pittel, Phys. Rev. C 61, 034311 (2000).
- (15) M.V. Stoitsov, W. Nazarewicz, and S. Pittel, Phys. Rev. C 58, 2092 (1998).
- (16) M. Stoitsov, P. Ring, D. Vretenar, and G.A. Lalazissis, Phys. Rev. C 58, 2086 (1998).
- (17) J. Dobaczewski, W. Nazarewicz, and M.V. Stoitsov, Eur. Phys. J., in press; preprint, arXiv:nucl-th/0203060.
- (18) M. Stoitsov, J. Dobaczewski, W. Nazarewicz, and S. Pittel, to be published.
- (19) E. Chabanat, P. Bonche, P. Haensel, J. Meyer, and R. Schaeffer, Nucl. Phys. A 627, 710 (1997).
- (20) J. Dobaczewski, W. Nazarewicz, J. Skalski, and T. Werner, Phys. Rev. Lett. 60, 2254 (1988).
- (21) T. Kubo, H. Sakamoto, T. Kammuri, and T. Kishimoto, Phys. Rev. C 54, 2331 (1996).
- (22) D.J. Rowe, Nuclear Collective Motion, Models and Theory (Methuen, London, 1970) .
- (23) S. Ćwiok, J. Dudek, W. Nazarewicz, J. Skalski, and T. Werner, Comp. Phys. Comm. 46, 379 (1987).
- (24) S.G. Nilsson, C.-F. Tsang, A. Sobiczewski, Z. Szymański, S. Wycech, C. Gustafson, I.-L. Lamm, P. Möller, and B. Nilsson, Nucl. Phys. A 131, 1 (1969).
- (25) J. Dobaczewski, P. Magierski, W. Nazarewicz, W. Satuła, and Z. Szymański, Phys. Rev. C 63, 024308 (2001).
- (26) J. Dobaczewski, W. Nazarewicz, and M. Stoitsov, to be published.
- (27) G. Jakob, N. Benczer-Koller, G. Kumbartzki, J. Holden, T.J. Mertzimekis, K.-H. Speidel, R. Ernst, A.E. Stuchbery, A. Pakou, P. Maier-Komor, A. Macchiavelli, M. McMahan, L. Phair, and I.Y. Lee, Phys. Rev. C 65, 024316 (2002).
- (28) V.I. Isakov, K.I. Erokhina, H. Mach, M. Sanchez-Vega, and B. Fogelberg, preprint, arXiv:nucl-th/0202044 .
- (29) G. Audi and A.H. Wapstra, Nucl. Phys. A 595, 409 (1995); Nucl. Phys. A 565, 1 (1993).
- (30) M. Hass, C. Broude, Y. Niv, and A. Zemel, Phys. Rev. C 22, 97 (1980).