Exotic Structure of Carbon Isotopes
Toshio Suzuki
Department of Physics, College of Humanities and Sciences, Nihon University
Sakurajosui 3-25-40, Setagaya-ku, Tokyo 156-8550, Japan
and
H. Sagawa
Center for Mathematical Sciences, the University of Aizu
Aizu-Wakamatsu, Fukushima 965-8560, Japan
and
Kouichi Hagino
Yukawa Institute for Theoretical Physics, Kyoto University
Kyoto 606-8502, Japan
Abstract
We studied firstly the ground state properties of C-isotopes using a deformed Hartree-Fock (HF)+ BCS model with Skyrme interactions. Shallow deformation minima are found in several neutronrich C-isotopes. It is shown also that the deformation minima appear in both the oblate and the prolate sides in 17C and 19C having almost the same binding energies. Secondly, we carried out shell model calculations to study electromagnetic moments and electric dipole transitions of the C-isotopes. We point out the clear configuration dependence of the quadrupole and magnetic moments in the odd C-isotopes, which will be useful to find out the deformations and the spin-parities of the ground states of these nuclei. We studied electric dipole states of C-isotopes focusing on the interplay between low energy Pigmy strength and giant dipole resonances. Reasonable agreement is obtained with available experimental data for the photoreaction cross sections both in the low energy region below =14 MeV and in the high energy giant resonance region (14 MeV 30 MeV). The calculated transition strength below dipole giant resonance (14 MeV) in heavier C-isotopes than 15C is found to exhaust about of the classical Thomas-Reiche-Kuhn sum rule value and of the cluster sum rule value.
PACS numbers/21.60.Cs, 24.30.Cz, 25.20.-x
1 INTRODUCTION
The structure of nuclei far from the stability lines is often very different from that of stable nuclei due to largely extended wave functions as well as the large asymmetry between neutron and proton mean fields. Because of these unique features of the mean field, a naive extrapolation of the stable nuclei will fail to predict the structure of these exotic nuclei. A typical example is the new shell structure at the neutron number 16 in O isotopes [1]. The structure of dipole excitations in neutron-rich O isotopes is also found out very different from that of stable nuclei, especially in the low energy region below GDR[2, 3, 4].
A study of heavy C-isotopes is another current issue, where these exotic structures may be expected. In this paper, we study the ground state properties of C isotopes performing deformed Hartree-Fock (HF) +BCS calculations and also shell model calculations. The energy surfaces of C isotopes are studied as a function of the quadrupole deformation parameter in order to find out the deformation minimum for different single-particle configurations. Special emphasis will be put on the magnetic and quadrupole moments (Q-moments) for odd C isotopes which will manifest their exotic structure. Electric dipole excitations of C isotopes are investigated by a large scale shell model calculations focusing on the interplay between low energy Pigmy strength and giant dipole resonance (GDR). We try to find out the deformation effect on the dipole strength distributions, which will increase the width of GDR.
The paper is organized as follows. In section 2, we present results of the deformed Skyrme HF +BCS calculations. The magnetic and Q- moments are discussed in section 3. The Pigmy and GDR are shown in section 4. A summary and conclusions are given in section 5.
2 DEFORMED SKYRME HF CALCULATIONS
In this section, we investigate the neutron number dependence of deformation properties along the chain of C-isotopes. For this purpose, we perform deformed HF+BCS calculations with Skyrme interactions SkI4 [5], SIII [6] and SkM∗ [7], using the computer code SKYAX [8]. The axial symmetry is assumed for the HF deformed potential. The pairing interaction is treated in the BCS approximation and is taken to be a volume-type -interaction
| (1) |
where the pairing strength is taken to be MeVfm3 for neutron and MeVfm3 for proton [9]. These values are determined so as to fit the experimental pairing gaps for several isotope as well as isotone chains of semi-magic nuclei, see Ref. [9] for details. The HF+BCS calculations are also carried out with a density dependent pairing interaction
| (2) |
where is the HF density at and is chosen to be 0.16 fm-3. The pairing strength is taken to be MeVfm3 for neutrons and MeVfm3 for protons [9]. A smooth energy cut-off is employed in the BCS calculations [9].
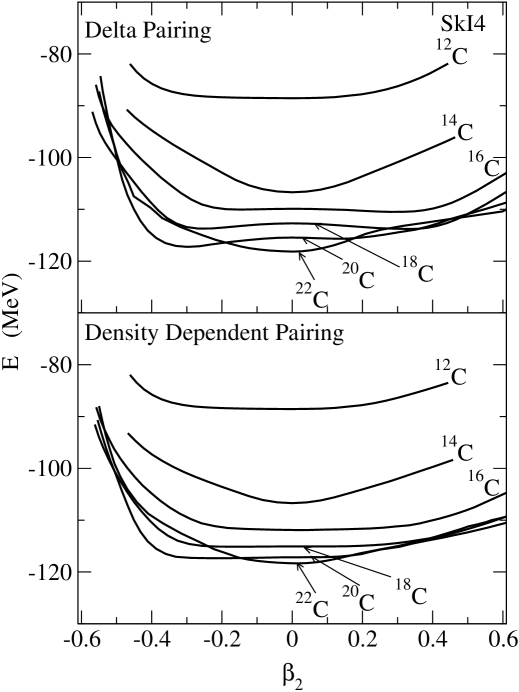
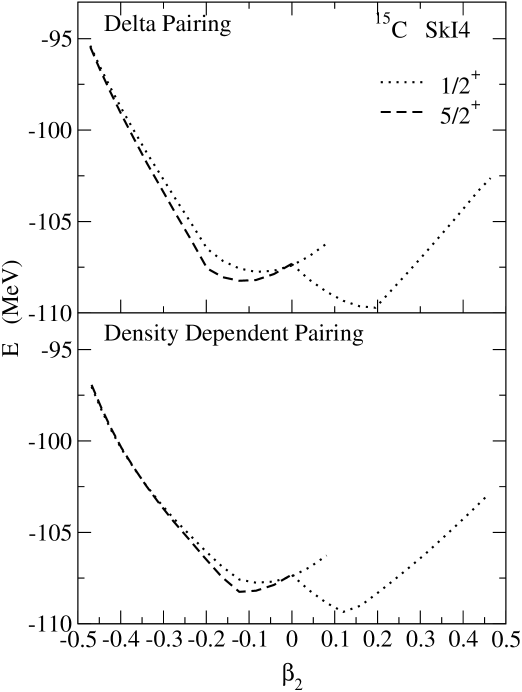
Figure 1 shows the binding energy surfaces for even-mass C isotopes as a function of the quadrupole deformation parameter obtained with the SkI4 interaction together with the two pairing interactions. In general, both of the two pairing interactions give a similar energy surface which is flat in a wide range of the deformation parameter . The energy minima are tabulated in Table 1. For the volume pairing, the energy surface of 12C is rather flat between . The energy minimum becomes apparent for 14C. For heavier C isotopes 16C and 18C, two shallow minima appear both in the prolate and oblate sides. In 18C, the ground state has the largest deformation at =0.38, while the local minimum appears at the oblate side at 0.3. In the case of the surface pairing (eq. (2)), clear minima are not seen in the energy surface except for 14C, although there are large flat plateaus between as in the case of the volume pairing shown in the upper panel of Fig. 1.
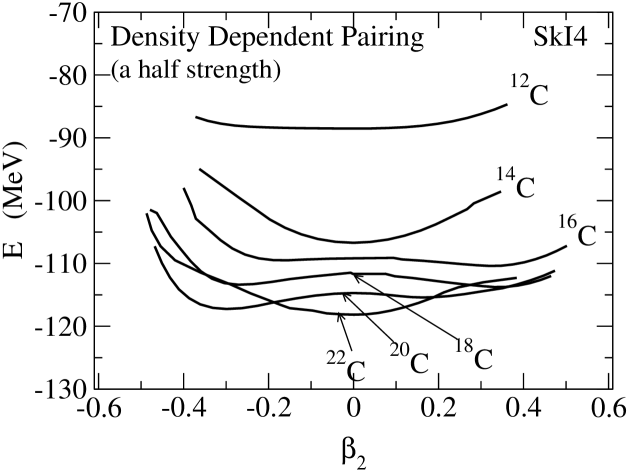
The surface pairing tends to yield a larger pairing gap for C isotopes than the volume pairing (see Table 1). In order to asses whether the slight difference of the energy surfaces obtained with the two pairing interaction is due to the different form of interaction or not, we repeat the same calculations for the surface pairing interaction but by reducing the strength by a half. Even smaller pairing strength is adopted in the study of O isotopes recently in ref. [10]. Figure 2 shows the energy surfaces thus obtained. As we see, clear minima now appear for 14C and 16C, suggesting that the energy surface is sensitive to the strength of the pairing interaction.
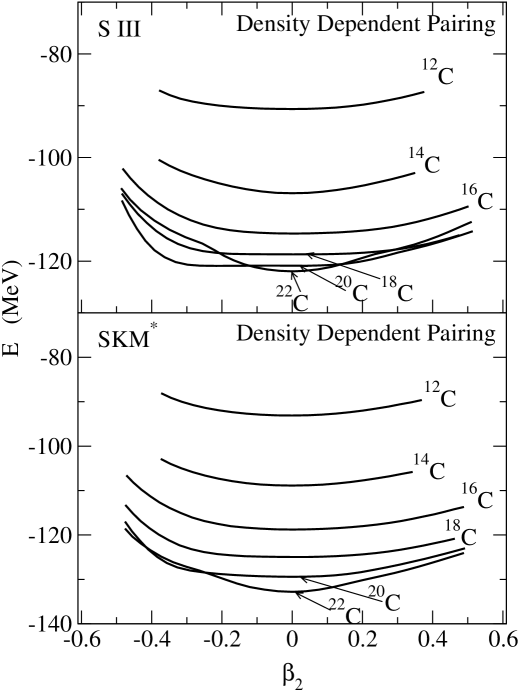
The results with two different Skyrme interactions SIII and SkM∗ together with the surface pairing are shown in Fig. 3. Although the strengths of the pairing interaction may be different for each set of Skyrme interactions, we use the same values as those used with the SkI4 set. The energy surface for the C-isotopes show no clear minima, but rather flat in the deformation region . These features are similar as those of SkI4 interaction.
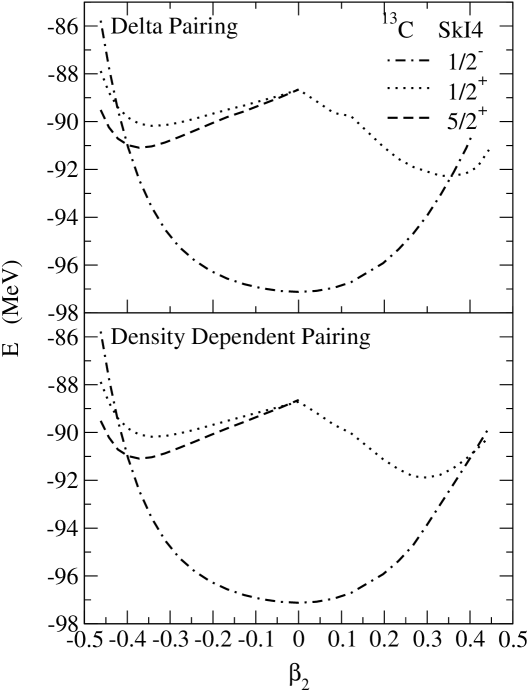
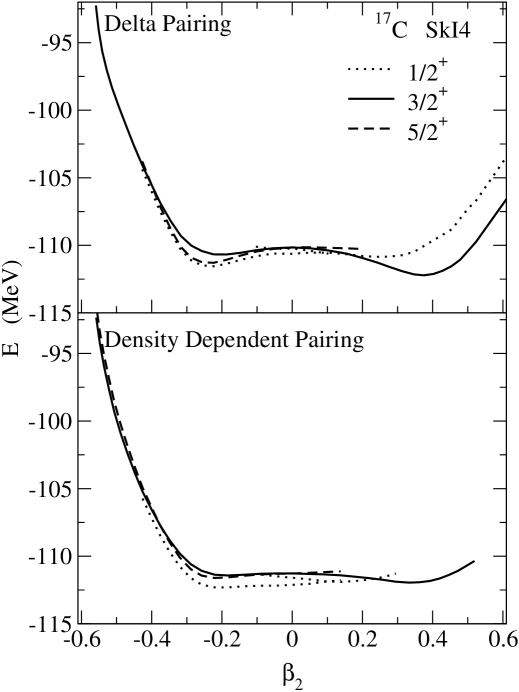
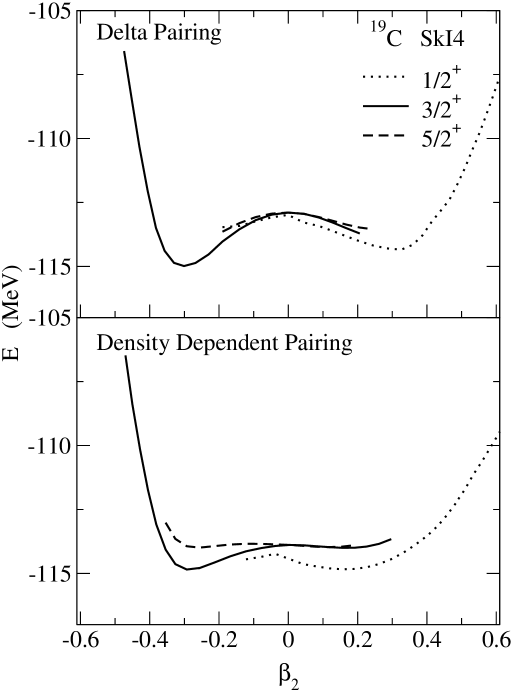
The one quasi-particle state energies obtained with the SkI4 interaction are shown in Figs. 4, 5, 6 and 7 for 13C, 15C,17C and 19C, respectively. The odd nuclei 13,15,17,19C are treated as one quasi-particle state on top of the BCS ground state of neighboring even nuclei. The Pauli blocking effect of the valence particle is not taken into account in the present calculations. For 13C, the state shows the deepest spherical minimum at , while the two minima are seen in the 1/2+ state at the oblate and the prolate deformations. The 5/2+ state has one minimum at around . The two pairing interactions (1) and (2) give essentially the same results for 13C. These energy minima for the different configurations are expected from the Nilsson diagram of deformed harmonic oscillator potential[11]. The results of 15C are shown in Fig. 5. The 1/2+ state is the lowest at the prolate deformation with 0.2 with the volume pairing and 0.12 with the surface pairing. There is also a local minimum for the 1/2+ configuration in the oblate side. The minimum of 5/2+ state appears at the oblate side and the energy is 2MeV above that of 1/2+ state. The three configurations 1/2+, 3/2+ and 5/2+ are competing in 17C as shown in Fig. 6. In the case of the volume pairing, the 3/2+ state has the lowest minimum at the prolate deformation 0.4 and another local minimum is also found at the oblate side with 0.2. The energy surface of the 1/2+ state is similar to that of 3/2+ state although the oblate minimum is lower than the prolate minimum in the case of the 1/2+ state. The 5/2+ state has a minimum at the oblate deformation. The minima of the three configurations at the oblate side show very similar values having almost the same binding energies. Among all minima, the lowest one is found at the prolate deformation at 0.4 for the 3/2+ state. The binding energies of the three states are also very close in the shell model calculations of 17C, as we discuss in the next section. The results of 19C are shown in Fig. 7. The competition of the three configurations 1/2+, 3/2+ and 5/2+ is apparent as in 17C. The one quasi-particle states show the lowest minimum for the 3/2+ state at the oblate deformation 0.3, while the 1/2+ state show the minimum at the prolate deformation 0.32. The 5/2+ state does not show any clear minimum as the one quasi-particle state.
In general, the prolate deformation occurs at the beginning of the shell while the oblate deformation occurs at the end of the shell. Experimentally, 12C and 13C are known to have oblate deformation[12, 13], and 14C with =8 becomes almost spherical at the neutron shell closure. In the present calculations, the energy surface of 12C is rather flat between . They also show that C-isotopes with =911, i.e., 15C C, favor prolate deformation, which is natural as the new shell begins to be occupied after =8. The 19C nucleus with =13 is shown most likely to favor oblate deformation. This suggests that the neutron number =13 might locate in the latter half between the two closed shells and could be a manifestation of the new shell closure at =16 instead of =20 as in the case of O-isotopes[1, 14]. It is thus desperately desired to have decisive experimental information on the signs of the deformations in heavier C isotopes.
The neutron number dependence of the deformation in C isotopes was studied by using anti-symmetrized molecular dynamics (AMD) model in ref. [15]. They pointed out similar neutron number dependence for the deformation to the present results in neutron-rich C isotopes. Namely the neutron deformation changes from spherical in =8, to prolate in =10 and then, to oblate in =14, while the proton deformation stays always oblate independent to the neutron number. There is a difference in the case of =16. The present deformed HF+BCS result shows a spherical minimum for 22C, while the AMD model gives a triaxial shape for the neutron configuration. Since the present deformed HF+BCS model is performed assuming the axial symmetric deformation, the two results are not completely equivalent. It might be interesting to study further the deformation changes taking into account the tri-axial degree of freedom in the deformed HF+BCS model.
3 MAGNETIC AND QUADRUPOLE MOMENTS AND EFFECTIVE OPERATORS
We next perform the shell model calculations for C isotopes with the effective interactions WBP10 in the (0p-0d1s) configuration space[16] to study the magnetic and the Q- moments. The WBP10 interaction is designed to reproduce systematically the energy of ground state and excited states of stable sd shell nuclei. The energies and the spin-parities of the states near the ground states of odd C isotopes are tabulated in Table 2. It is interesting to see that two or three different spin states are almost degenerate in the odd C isotopes 15C, 17C and 19C. These degeneracies are also expected from the results of deformed HF calculations, as we showed in the previous section. Several experimental efforts have been made to assign the spin-parities of odd C- isotopes 15C, 17C and 19C. For this end, the magnetic moments and Q-moments will provide the most conclusive information. Calculated magnetic moments and Q-moments are given in Table 2. The effective spin factor is taken to be 0.9(bare) for neutrons. This quenching factor is somewhat larger than the commonly adopted values 0.70.8 in stable nuclei. This difference might be due to smaller effect of the second-order effects in the neutron-rich light nuclei [17]. In the ground state of 15C, the calculated factor is 3.37 which agrees well with the experimental one =3.4400.018[18]. The calculated values for the 3/2+ and 5/2 + states of 17C are close to be 0.514 and 0.505, while that of the 1/2+ state is 2.82. The empirical value (exp)=0.50540.0025 [19] excludes the 1/2+ state from the ground state candidate, while the other two 3/2+ and 5/2 + states show good agreement within a few percent accuracy. There is a complemental experimental data of the selection rule on decay from 17C to 17N which favors the spin 3/2+ as the ground state of 17C.
The effective charges are commonly adopted for the shell model calculations of Q-moments because of the limitation of the model space. In ref. [20], the polarization charges for the electric quadrupole moment are calculated by the harmonic vibration model and the isospin dependence is given by
where and are the isoscalar and the isovector polarizability coefficients and is the ratio of and components in the static nuclear potential. The polarizability coefficients are evaluated to be 1.0 and 0.64 by the harmonic vibration model and the ratio is taken to be 2.6 from the empirical mean field potential strength. By substituting these values in Eq. (LABEL:eq:e2_pol), we obtain
| (4) |
In ref. [21], a microscopic particle-vibration model was applied to calculate the polarization charges in C isotopes using HF and random phase approximations (RPA). This model gives state-dependent and isospin dependent polarizability coefficients. The averaged polarizability coefficients =0.82 and 0.24 are found in 12C to be smaller than those of the harmonic vibration model. The smaller is mainly due to spreading of IS giant quadrupole resonances (GQR), while a large quenching on the comes from a substantially small ratio of Skyrme interactions compared with the harmonic vibration model. The averaged polarization charges in active valence configurations are given by 0.53, 0.33 and 0.15 for neutrons and =0.29, 0.16 and 0.05 for protons in 12C, 16C and 20C, respectively. In 12C, the calculated values give =0.53 for neutrons and =1.29 for protons, which agree well with the commonly used values (p)=1.3 and (n)=0.5 for light nuclei. The isospin dependence of the polarization charges might be papametrized from the values 12C and 16C to be
| (5) |
with
| (6) |
Eq. (6) gives =0.22 and =0.07 for 20C. A large difference between the calculated value and that from Eq. (6) is due to the effect of neutron skin in 20C. The small polarization charges in the very neutron rich nuclei are found to be important to explain the observed Q-moments of B-isotopes[21].
We use the isospin dependent polarization charges in ref. [21] to calculate Q-moment of C isotopes in Table 2. In 17C, the magnetic factors are essentially the same for the two configurations 3/2+ and 5/2 + and the calculated g-factors are close to the experimental value. The calculated Q-moments, however, are very different in the two configurations in magnitude and even in sign reflecting the different deformation of the two configurations. The neutron and the proton contributions for the Q-moment are and , respectively, in the 3/2+state, while they are and , respectively, in the 5/2+ state. It should be noticed that the magnetic moment and Q-moment of the 3/2+ state in 17C show large deviations from the single particle values ,(Schmidt) and, Q(s.p.)= for 0d3/2 state, i.e., even the sign of these moments are different in the two calculations. The single particle Q-moment for the 0d state is Q(s.p.)=, which is much larger than the shell model prediction Q= ( Notice the standard value for =0.5 and the presently adopted value for 17C is =0.33). However, the shell model Q-momemts are consistent with the prolate deformation for the 3/2+state and the oblate deformation for the 5/2+ state which are suggested by the deformed HF calculations in Table 1. Thus the measurement of Q-moment will be the most decisive experiment to assign the spin and the parity of the ground state of 17C and will provide experimental justification of the deformed HF+BCS and shell model predictions.
The magnetic moments and the Q-moment of 19C are given in Table 2. It is still under dispute whether the spin and the parity of the ground state of 19C is 1/2+ or 5/2+. According to the shell model calculations, the lowest 3/2+ is also close to the lowest 1/2+ and 5/2+ states in energy. The neutron and the proton contributions to the Q-moments are and in the 3/2+state, while they are for neutrons and for protons in the 5/2+ state of 19C. The values for the 3/2+state is consistent with the possible oblate deformation suggested in Table 1. On the other hand, the proton and neutron contributions have different signs in the 5/2+ state, and also very different from the single particle value for the 0d state. This shell model results suggest the large configuration mixing in the lowest 5/2+ state of 19C. It is seen clearly from Table 2 that the magnetic moment and Q-moment are very different for each configuration in 19C and will give decisive information on the spin assignment of the ground state of 19C.
4 GIANT AND PIGMY RESONANCES IN C ISOTOPES
The isovector (IV) giant dipole resonance (GDR) is the most well established collective mode throughout the mass table with large photoabsorption cross sections, exhausting most of the classical Thomas-Reich-Kuhn (TRK) sum rule (the energy weighted sum rule value) [22, 23, 24]. As a microscopic model, we perform the shell model calculations for the dipole excitation mode in C-isotopes. The calculations take into account a model space of up to (1+3) excitations in 12C, 13C and 14C including 0s-0p-1s0d-1p0f shells. Other nuclei are studied in a model space of 1 excitation of 0s-0p-1s0d-1p0f shells. The Warburton-Brown interaction WBP10[16] is used in this study with the model space (0s-0p-1s0d-1p0f). The center of mass spurious components in the wave functions are pushed up to higher excitation energies by adding a fictitious hamiltonian which acts only on the center of mass excitation[25]. In a restricted model space, there still remain some spurious components in the wave functions after the diagonalization of the model hamiltonian, especially when one uses HF or Woods-Saxon single-particle wave functions, instead of harmonic oscillator wave functions. In order to remove the effect of these spurious components on the transition strength, we use the effective transition operator
| (7) |
in which the center-of-mass correction is subtracted from the IV dipole transition operator. The transition strength B(E1) is defined as
| (8) |
where the matrix element is calculated between the ground state () and the n-th excited 1- shell model state () with the excitation energy . In order to smooth out the discrete strength, the transition strength is averaged by a weight factor as
| (9) |
where
| (10) |
The weight factor can be considered to simulate the escape and the spreading widths. The width parameter is arbitrary taken as 1MeV to draw a smooth curve of the transition strength. The oscillator length of the harmonic oscillator wave function is taken as =1.64 fm. It is known that the photoreaction cross section is related with the transition strength . The total photoreaction cross section is written as[26]
| (11) |
The sum rule is a useful measure of the collectivity in GR. For the IV GDR, the energy weighted sum rule value is given by
neglecting the contributions of exchange terms. This sum rule (4) is known as the classical Thomas-Reiche-Kuhn (TRK) sum rule. The cross section is then expressed as
| (12) |
The cluster sum rule is referred to measure the adiabaticity between GR and Pigmy resonance[28]. Assuming the valence cluster with and and the core with and , the cluster sum rule is given by
| (13) |
where and .
The calculated results of averaged dipole strength (4) in C isotopes are shown in Figs. 8 and 10. The non-energy weighted summed transition strength (NESR), the energy weighted summed transition strength (EWSR) and the total photoreaction cross sections are tabulated in Table 3. The low energy strength below GDR region is compared with the cluster sum rule value (13) in Table 4. The photoreaction cross sections for 12C, 13C and 14C are also shown in Fig. 9. The width parameter is taken to be = 2 MeV in Fig. 9.
In Fig. 8a, two calculated results of the transition strength in 12C obtained within 1 and (1+3) configuration space are shown. Although the peak energy of GDR appears at the same energy E 21MeV, the integrated strength of the large space is 20% smaller than that of the small space because of the coupling to many-particle many-hole states. The experimental photoreaction cross section shows the GDR peak at Ex = 22 MeV[24] that is close to the present calculation. The observed value exhausts 64% of the TRK sum rule up to Ex = 30 MeV[24], while the calculated sums show the enhancement factor for the sum rule,i.e., =0.62 (0.29) in the 1 calculations. A large fraction of the strength is found to be in high excitation energy region up to Ex = 140 MeV; = 0.62 up to 100 MeV and = 0.86 up to 140 MeV[27]. In ref. [27], integrated cross section up to 35 MeV is found to be about 65 of the TRK sum rule, while calculated enhancement factor up to Ex = 35 MeV is = 0.01 in the (1+3) space. In view of this, 25 of our calculated strength obtained within the (1+3) space should be in higher energy region than Ex = 35 MeV. We, thus, need to reduce the calculated cross section for 12C by multiplying a factor 0.7 as shown in Fig. 9 to obtain reasonable agreement with the available experimental one in ref. [24]. The experiment data show the existence of a large fraction of the strength in higher energy region than =35MeV and suggest the importance of the coupling to many-particle many-hole states more than 3 excitations. It is interesting to notice that the difference between the two calculations in Fig. 8a is only 200 keV for the peak energy, although the total cross section of 3 calculation is 20% smaller than that of 1 calculation.
The calculated transition strength and the photoreaction cross section in 13C (14C) obtained by including up to 3 excitations are shown in Figs. 8b and 9b (Figs. 8c and 9c), respectively. We see appreciable cross sections in both 13C and 14C below 14MeV, while there is essentially no cross section in 12C in the same energy region. The energy weighted sum (EWS) of the strength up to 14 MeV amounts to be 86 and 66 of the cluster sum rule in 13C and 14C, respectively, as shown in Table 4. The GDR peak appears at 2526 MeV in 13C which is close to the experimental value at 24 MeV [24]. The distribution of the observed photoreaction cross section is well reproduced by the present calculation within (1+3) space. The integrated cross section calculated up to Ex = 30 MeV amounts to be 98 of the TRK sum rule, while the observed one is 71 of the TRK value[24]. About 30 of the calculated strength is in the higher energy region beyond Ex = 30 MeV, which is similar to the case of 12C.
In case of 14C, the GDR peak appears at Ex = 28 MeV which is rather close to the observed one at 25.6 MeV[24]. Experimental mean energies are 18.30.4 MeV and 26.70.1 MeV for T<=1 and T>=2 states, respectively[24], which are close to our calculated values; 19.8 MeV for T<=1 and 28.2 MeV for T>=2 states. The distribution of the photoreaction cross section is well reproduced by the present calculation. Observed photoreaction cross sections for T< and T> states summed up to 30 MeV are 8812 MeVmb and 378 MeVmb, respectively[24], while the present calculation gives 119 MeVmb for T< states and 94 MeVmb for T> states. Experimental values are quenched compared with the calculated ones by factors 0.740.1 for T< and 0.400.08 for T> states. A factor 0.4 is multiplied for T>=2 states in Fig. 9. About 40 of the strength is found to be in the high energy region beyond Ex = 30 MeV.
Calculated dipole strength for 15C, 16C, 17C, 18C and 19C are shown in Fig. 10. Since the spin and the parity of the ground state in 19C is not established yet experimentally, we calculate the dipole strength excited from two possible spin-parity states 1/2+ and 3/2+ for the ground state. In case of 15C, effects of skin are studied. The neutron 1s1/2-orbit is obtained in a Woods-Saxon well to reproduce the experimental separation energy of 1.22 MeV. The dipole strength enhanced about by 30 in the low energy region around Ex = 5 MeV. The skin effect is rather moderate. The NESW and EWSR of the transition strength B(E1) and the total photoreaction cross sections are listed in Tables 3 and 4. The dipole strength below GDR region becomes substantial in these nuclei, i.e., the cross sections below =14 MeV exhaust 7.8 for 15C , 16.3 for 16C , 13.1 for 17C, 11.6 for 18C and 12.6 for 1/2 case of 19C ( 14.1 for 3/2 case of 19C) of the TRK sum rule, respectively. These values correspond to 46.6 for 15C , 81.3 for 16C , 57.8 for 17C, 46.4 for 18C and 47.0 for 1/2 case of 19C ( 52.4 for 3/2 case of 19C) of the cluster sum rule, respectively. The GDR peaks with the isospin are found always at around Ex= 1719 MeV in these nuclei. On the other hand, the peaks appear more than 10 MeV higher in energy than the peaks, and smaller in peak height in heavier C-isotopes. In the extreme case of 19C, the cross section of states becomes only 13.5% of the TRK sum rule and there are only very small strength of states below Ex=30MeV.
There are peaks at rather low energies 10 - 20 MeV in 15∼19C. These energies are close to the unperturbed ph excitation energy 1(H.O.)=41/A1/3 MeV in the harmonic oscillator model, but much lower than the systematic excitation energies of Giant resonances (GDR)80/A1/3 MeV. This low energy feature might be attributed to the effects of large deformations (see Table 1), which makes some unperturbed p-h 1- states lower than those of spherical nuclei. The main GR part have two peaks in 15C and 16C. This can be also considered as the effects of the strong prolate deformation as is seen in Table 1. In cases of 17C, 18C and 19C, any clear two-peak structure is not seen in the strength distributions while the main peaks have large widths of 10MeV. The strength distributions show not much difference between the case of spin 1/2+ for the ground state (prolate deformation) and that of spin 3/2+ for the ground state (oblate deformation). As the strength around the peak up to 12-14 MeV exhausts about 50% of the cluster sum rule value in the heavier C isotopes, these regions may be interpreted as pigmy resonances. The strength is fragmented widely in the heavier isotopes , and the distinction between Giant resonance and pigmy resonance seems not very clear except for 15C and 18C.
5 SUMMARY
We have studied the ground state properties of C isotopes by the deformed Hartree-Fock +BCS model. The shallow deformation minima are found in the several isotopes. The prolate deformation is suggested to favor for 15C and 17C while the oblate deformation is most probable for 19C. Both the prolate and the oblate minima appear in 16C and 18C to be almost degenarate in energy.
The magnetic and the Q- moments of odd isotopes are investigated by the shell model calculations, and their configuration dependence is pointed out. It is crucial to obtain experimental information on the values of magnetic and quadrupole moments to determine whether the deformation is prolate or oblate. In particular, it would be interesting to find out decisive information on the deformation of 19C since this nucleus is a keystone to establish the new shell structure at N=16 in the C isotopes.
We have also studied the Pigmy and GDR dipole strengths of C-isotopes by using shell model calculations in the large scale shell model (0p-1s0d-1p0f) space. We found that the excitation energies of GDR in 12C, 13C and 14C show good agreement with the experimental data of the two isospin resonances, T> and T<. Moreover the calculated Pigmy strength below 14 MeV in 14C is consistent with the experimental photoreaction cross sections. In heavier C-isotopes than 14C, the T< GDR has always a peak at around Ex = 1719 MeV, while the T> peak is more than 10 MeV higher in energy and much smaller in the cross section than the T< one. In these heavy isotopes, the Pigmy resonances are more pronounced than that of 14C, having about 8 of the TRK sum rule values, which correspond to 50% of the cluster sum rule values . Future experimental effort is highly desirable to observe these Pigmy resonances to clarify the structure of drip line nuclei[3].
Acknowledgements
We thank P.-G. Reinhard for providing us with his computer code for the deformed Hartree-Fock + BCS calculations and also for his constant help in running the code. This work was supported in part by the Japanese Ministry of Education, Science, Sports and Culture by Grant-In-Aid for Scientific Research under the program number C(2) 12640284.
References
- [1] A. Ozawa, T. Kobayashi, T. Suzuki, K. Yoshida and I. Tanihata, Phys. Rev. Lett. 84, 5493 (2000).
- [2] I. Hamamoto, H. Sagawa and X. Z. Zhang, Phys. Rev. C57, R1064(1998).
- [3] A. Leistenschneider, T. Aumann, K. Boretzky, D. Cortina, J. Cub, U. Datta Pramanik, W. Dostal, Th. W. Elze, H. Emling, H. Geissel, A. Grünschlo, M. Hellstr, R. Holzmann, S. Ilievski, N. Iwasa, M. Kaspar, A. Kleinbh, J. V. Kratz, R. Kulessa, Y. Leifels, E. Lubkiewicz, G. Münzenberg, P. Reiter, M. Rejmund, C. Scheidenberger, C. Schlegel, H. Simon, J. Stroth, K. Sümmerer, E. Wajda, W. Walús and S. Wan, Phys. Rev. Lett. 86, 5442 (2001) .
- [4] H. Sagawa and T. Suzuki, Phys. Rev. C59, 3116 (1999).
- [5] P.-G. Reinhard and H. Flocard, Nucl. Phys. A584, 467 (1995).
- [6] M. Beiner, H. Flocard, N. Van Giai, and P. Quentin, Nucl. Phys. A238, 29 (1975).
- [7] J. Bartel, P. Quentin, M. Brack, C. Guet, and H.-B. Hakansson, Nucl. Phys. A386, 79 (1982).
- [8] P.-G. Reinhard, the computer code SKYAX (unpublished).
- [9] M. Bender, K. Rutz, P.-G. Reinhard, and J.A. Maruhn, Eur. Phys. J. A8, 59 (2000).
- [10] E. Khan, N. Sandrescu, M. Grasso and Nguyen Van Giai, Phys. Rev. C, in press; e-print: nucl-th/0203056.
- [11] A. Bohr and B. R. Mottelson, Nuclear Structure Vol. 2 (W. A. Benjamin, 1975) Chapter 5, p. 221.
- [12] G. Mairle and G. J. Wagner, Nucl. Phys. A253, 253 (1975).
- [13] O. Aspelund, G. Hrehuss, A. Kiss, K. T. Knöpfle, C. Mayer-Böricke, M. Rogge, U. Schwinn, Z. Seres and P. Turek, Nucl. Phys. A253, 263 (1975).
- [14] G. Colo, T. Suzuki and H. Sagawa, Nucl. Phys. A695,167 (2001).
- [15] Y. Kanada-En’yo and H. Horiuchi, Prog. Theor. Phys. Supplement 142, 205 (2001).
- [16] E. K. Warburton and B. A. Brown, Phys. Rev. C46, 923 (1992) and private communications.
-
[17]
K. Asahi, H. Ogawa, H. Ueno, D. Kamada, H. Miyoshi,Y. Kobayashi, A. Yoshimi
,K. Yogo, A. Goto, T. Suga, K. Sakai,
N. Imai, Y.X. Watanabe, K. Yoneda, N. Fukuda, N. Aoi, A. Yoshida,
T. Kubo, M. Ishihara,
W.-D. Schmidt-Ott, G. Neyens and S. Teughels,
RIKEN Review 39, 142 (2001);
T. Suzuki, Proc. of Int. Conference ”Structure of the Nucleus at the Dawn of the Century” (Bologna, 2000, edited by G. C. Bonsignori, M. Bruno, A. Ventura and D. Vretenar). - [18] K. Asahi, K. Sakai, H. Ogawa, H. Ueno, Y. Kobayashi, A. Yoshimi, H. Miyoshi, K. Yogo, A. Goto, T. Suga, N. Imai, Y.X. Watanabe, K. Yoneda, N. Fukuda, N. Aoi, W.-D. Schmidt-Ott, G. Neyens, S. Teughels, A. Yoshida, T. Kubo, M. Ishihara, AIP Conf. Proc. 570, 109 (2001).
- [19] H. Ogawa, K. Asahi, H. Ueno, K. Sakai, H. Miyoshi, D. Kameda, T. Suzuki, H. Izumi, N. Imai, Y.X. Watanabe, K. Yoneda, N. Fukuda, H. Watanabe, A. Yoshimi, W. Sato, N. Aoi, M. Nagakura, T. Suga, K Yogo, A. Goto, T. Honda, Y. Kobayashi, W.-D. Schmidt-Ott, G. Neyens, S. Teughels, A. Yoshida, T. Kubo, M. Ishihara, Euro. Phys. J. A13, 81 (2002).
- [20] Chapter 6, p. 515 in ref. [11].
- [21] H. Sagawa and K. Asahi, Phys. Rev. C63, 064310 (2001)
- [22] B. L. Berman and S. C. Fultz, Rev. Mod. Phys. 47, 713 (1975).
- [23] J. G. Woodworth K. G. McNeill, J. W. Jury, R. A. Alvarez, B. L. Berman, D. D. Faul and P. Meyer, Phys. Rev. C19, 1667 (1979).
-
[24]
R. E. Pywell, B. L. Berman , J. G. Woodworth, J. W. Jury,
K. G. McNeill and M. N. Thompson , Phys. Rev. C32, 384 (1985).
D. J. Mclean, M. N. Thompson , D. Zubanov, K. G. McNeill , J. W. Jury, and B. L. Berman , Phys. Rev. C44, 1137 (1991). - [25] D. H. Gloeckner and R. D. Lawson Phys. Lett.53B, 313 (1974).
- [26] Chapter 6, p. 478 in ref. [11] .
- [27] J. Ahrens, H. Borchert, K. H. Czock, H. B. Eppler, H. Gimm, H. Gundrum, M. Kröning, P. Riehn, G. Sita Ram, A. Zieger and B. Ziegler, Nucl. Phys. A251, 479 (1975).
- [28] H. Sagawa and M. Honma, Phys. Lett.B251, 17 (1990).
Table 1 The energy minima of the energy surface in the deformed HF calculations with the Skyrme interaction SkI4: (a) with the volume-type delta pairing interaction in Eq. (1), and (b) with the surface-type density-dependent pairing interaction in Eq. (2).
| (a) | (b) | |||||||
| nucleus | Kπ | Energy | Kπ | Energy | ||||
| (MeV) | (MeV) | (MeV) | (MeV) | |||||
| 12C | 0+ | 0.0 | 88.54 | 0.0 | 0+ | 0.0 | 0.0 | |
| 13C | 0.0 | 97.12 | 0.0 | 0.0 | 97.12 | 0.0 | ||
| 0.34 | 90.18 | 0.0 | 0.34 | 90.18 | 0.0 | |||
| 0.33 | 92.27 | 0.0 | 0.30 | 91.86 | 1.06 | |||
| 0.34 | 91.03 | 0.0 | 0.34 | 91.03 | 0.0 | |||
| 14C | 0+ | 0.0 | 106.7 | 0.0 | 0+ | 0.0 | 106.7 | 0.0 |
| 15C | 0.084 | 107.8 | 0.0 | 0.084 | 107.8 | 0.0 | ||
| 0.195 | 109.7 | 0.0 | 0.195 | 109.7 | 0.0 | |||
| 0.123 | 108.2 | 0.0 | 0.123 | 108.2 | 0.0 | |||
| 16C | 0+ | 0.176 | 109.8 | 1.08 | 0+ | 0.10 | 111.72 | 2.36 |
| 0+ | 0.298 | 110.5 | 0.705 | 0+ | 0.108 | 112.0 | 2.30 | |
| 17C | 0.224 | 111.5 | 1.04 | 0.184 | 112.3 | 2.14 | ||
| 0.241 | 110.9 | 0.848 | 0.138 | 111.9 | 2.105 | |||
| 0.188 | 110.7 | 1.02 | 0.184 | 111.4 | 2.14 | |||
| 0.375 | 112.2 | 0.0 | 0.333 | 111.95 | 1.67 | |||
| 0.224 | 111.3 | 1.04 | 0.221 | 111.6 | 1.20 | |||
| 18C | 0+ | 0.273 | 113.4 | 0.930 | 0+ | 0.238 | 115.0 | 2.14 |
| 0+ | 0.345 | 113.8 | 0.0 | 0+ | 0.191 | 115.3 | 2.16 | |
| 19C | 0.326 | 114.3 | 0.246 | 0.155 | 114.8 | 2.05 | ||
| 0.301 | 115.0 | 0.914 | 0.293 | 114.8 | 1.91 | |||
| 20C | 0+ | 0.299 | 117.3 | 0.0 | 0+ | 0.232 | 117.3 | 1.06 |
| 22C | 0+ | 0.00 | 118.2 | 0.0 | 0+ | 0.00 | 118.19 | 1.12 |
Table 2 Magnetic moments and quadrupole moments of C-isotopes. Shell model calculations are performed with the Warburton-Brown WBP10 interaction. The effective spin g-factor for neutron is taken to be /=0.9 in the shell model calculations. The effective charges for Q-moments are taken from the results of particle-vibration model based on HF+RPA calculations in ref. [21]. The experimental data of factors are taken from ref. [18] for 15C and from ref. [19] for 17C. The single particle Q-moment is calculated by using the harmonic oscillator wave function with the oscillator length b=1.64 .
| A | Jπ | Energy | g(Schmidt) | g(cal) | g(exp) | Q-moment(s.p.) | Q-moment(cal) |
| (MeV) | mb | mb | |||||
| 15C | 0.00 | -3.83 | -3.37 | ||||
| 3.440 0.018 | |||||||
| 17C | 0.295 | -3.83 | -2.82 | ||||
| 0.00 | 0.765 | -0.514 | -37.7 | 23.5 | |||
| 0.032 | -0.765 | -0.505 | -53.8 | -9.3 | |||
| 0.5054 0.0025 | |||||||
| 19C | 0.00 | -3.83 | -2.600 | ||||
| 0.625 | 0.765 | 0.187 | -37.7 | -33.1 | |||
| 0.190 | -0.765 | -0.411 | -53.8 | 1.1 |
Table 3 Non-energy weighted sum rule (NESR) and energy weighted sum rule (EWSR) values of E1 transitions in C-isotopes. Integrated photoreaction cross sections (MeVmb) are also shown in the Table. Shell model calculations are performed with the Warburton-Brown WBP10 interaction.
| A | Isospin | NEWS | EWSR | S(TRK) | EWSR/S(TRK) | ||
| fm2 | MeVfm2 | MeV | MeVfm2 | % | MeV mb | ||
| 12C () | T | 2.89 | 72.3 | 25.0 | 44.7 | 161.7 | 291. |
| () | T | 2.29 | 57.6 | 25.2 | 44.7 | 128.8 | 232. |
| 13C | T | 1.29 | 25.7 | 19.9 | 103. | ||
| () | T | 1.81 | 46.7 | 25.8 | 188. | ||
| total | 3.10 | 72.4 | 48.1 | 151. | 291. | ||
| 13C | T | 1.12 | 22.4 | 20.0 | 90.2 | ||
| () | T | 1.39 | 35.6 | 25.6 | 144. | ||
| total | 2.51 | 58.0 | 48.1 | 121. | 234. | ||
| 14C | T | 2.02 | 41.1 | 20.4 | 166. | ||
| () | T | 1.28 | 35.7 | 27.8 | 144. | ||
| total | 3.30 | 76.8 | 51.1 | 150. | 309. | ||
| 14C | T | 1.71 | 33.7 | 19.7 | 136. | ||
| () | T | 0.958 | 27.0 | 28.2 | 109. | ||
| total | 2.67 | 60.7 | 51.1 | 119. | 245. | ||
| 15C | T | 2.63 | 48.9 | 18.6 | 197. | ||
| T | 0.866 | 25.1 | 29.0 | 101. | |||
| total | 3.49 | 74.1 | 53.6 | 138. | 298. | ||
| 16C | T | 2.77 | 50.3 | 18.2 | 203. | ||
| T | 0.651 | 20.3 | 31.1 | 81.7 | |||
| total | 3.42 | 70.6 | 55.9 | 126. | 284. | ||
| 17C | T | 3.14 | 57.1 | 18.2 | 230. | ||
| T | 0.460 | 14.5 | 31.6 | 58.3 | |||
| total | 3.60 | 71.7 | 57.9 | 124. | 288. | ||
| 18C | T | 3.26 | 59.6 | 17.5 | 240. | ||
| T | 0.327 | 11.3 | 34.6 | 45.5 | |||
| total | 3.59 | 68.5 | 59.6 | 115. | 276. | ||
| 19C | T | 3.46 | 60.1 | 17.4 | 242. | ||
| 1/2 | T | 0.23 | 8.2 | 35.4 | 33.0 | ||
| total | 3.69 | 68.3 | 61.2 | 112. | 275. | ||
| 19C | T | 3.42 | 57.7 | 16.9 | 232. | ||
| 3/2 | T | 0.22 | 7.8 | 35.0 | 31.3 | ||
| total | 3.64 | 65.5 | 61.2 | 107. | 264. |
Table 4 Low energy strength of electric dipole transitions in C isotopes. Energy weighted sum rule (EWSR) values are compared with the cluster sum rule values . Shell model calculations are performed with the Warburton-Brown WBP10 interaction.
| A | EWSR(MeVfm2) | |||
|---|---|---|---|---|
| E 12MeV (%) | E 14MeV (%) | E 16MeV (%) | ||
| 12C () | 0.0 | 0.13 () | 0.23 () | 0.43() |
| 13C () | 3.44 | 2.02 (58.7) | 2.97 (86.3) | 4.01 (116.6) |
| 14C () | 6.39 | 1.14 (17.8) | 4.22 (66.0) | 9.24 (145.) |
| 15C | 8.94 | 2.28 (25.5) | 4.17 (46.6) | 12.93 (144.6) |
| 16C | 11.18 | 2.57 (23.0) | 9.09 (81.3) | 15.46 (138.) |
| 17C | 13.15 | 3.56 (27.1) | 7.60 (57.8) | 13.48 (102.5) |
| 18C | 14.90 | 3.08 (20.7) | 6.91 (46.4) | 12.82 (86.0) |
| 19C (1/2) | 16.47 | 4.00 (24.3) | 7.74 (47.0) | 13.54 (82.2) |
| 19C (3/2) | 16.47 | 4.63 (28.1) | 8.64 (52.4) | 15.15 (92.0) |
s


