How much is RHIC different from SPS?
Comparison of the
-spectra††thanks: Supported by the Polish State Committee for
Scientific Research, grant 2 P03B 09419.
Abstract
We show, by means of a simple compilation of the available experimental results, that the -spectra obtained at RHIC and SPS are strikingly similar up to GeV. In fact, the discrepancies between various experimental groups working at the same experiment are of the same size as the differences between RHIC and SPS. Our observation is complementary to the well known fact of the equality of the measured and HBT radii at RHIC and SPS. In essence, it points out that the transverse size of the firecylinder and the strength of the transverse flow are not significantly changed between SPS and RHIC. This suggests that a saturation mechanism is effective already at SPS. We also point out that the dominance of protons over at large can be seen not only in the RHIC data, but already in the SPS data.
25.75.-q, 25.75.Dw, 25.75.Ld
1 Introduction
The pertinent question in the field of relativistic heavy-ion collisions is whether the physics at RHIC is qualitatively different from the physics at SPS. In our opinion, the available experimental results hint that this is not the case, at least for soft processes.
In this paper we compile the transverse-momentum spectra of hadrons measured by various groups at SPS and RHIC. Surprisingly, to our knowledge such a study has not been presented before. We use the data of NA44 [1], NA49 [2], PHENIX [3], and STAR [4, 5, 6], and show that there exist discrepancies between the NA44 and the NA49 data, as well as between the PHENIX and the STAR data. In fact, these discrepancies are of the same size as the differences between SPS and RHIC. More precisely, within the experimental uncertainties, which are quite large, one finds that the slopes of the -spectra at RHIC are compatible with those at SPS. This observation is complementary to the well known fact of the very weak beam-energy dependence of the transverse HBT radii. Similarity of both the transverse size and the -spectra of hadrons indicates that the amount of the transverse flow cannot be significantly different at the two considered collision energies.
The transverse HBT radii and measured [7, 8, 9] in the first run of RHIC are very close to those measured in heavy-ion collisions at smaller beam energies. Only the longitudinal radius exhibits a monotonic growth with (for a compilation of the data at different energies see, e.g., Ref. [7]). The weak energy dependence of the transverse radii is surprising, since the RHIC beam energy, GeV, is almost one order of magnitude larger than the SPS energy, =17 GeV, and one would naively expect that much larger hadronic systems were produced at RHIC. One would also expect a longer lifetime of the hadronic fireball formed at RHIC, which should be reflected in a longer emission times of pions. This effect is quantified by the measurement of the ratio , which is expected to be much larger than unity for long emission duration [10]. The experimental measurements indicate, however, that is compatible with unity in the whole range of the studied transverse-momentum range ( GeV). This fact is another puzzle delivered by the analysis of the RHIC data.
On the other hand, the first measurements at RHIC showed that the pseudorapidity densities of charged particles are higher than those observed at SPS. Can this effect be reconciled with practically unchanged transverse radii? For the most central collisions, PHOBOS communicated the value [11], BRAHMS the value , whereas PHENIX obtained [12]. Normalizing per participant pair yields for both PHOBOS and BRAHMS, and for PHENIX. These numbers may be compared to the NA49 result, 1.9 [13, 11], and the WA98 result, 2.6 [14]. We can see that the multiplicity increases by about 50% when we move from SPS to RHIC. A simple geometric scaling suggests that the transverse radius increases, correspondingly, as a square root, i.e., by about 20%. Thus, the observed increase of the multiplicity translates to moderately small increase of the transverse radii. Clearly, the difference between the NA49 multiplicity and the WA98 multiplicity, as well as the errors of each particular experiment lead to the uncertainty in the determination of the geometric parameters.
The weak dependence of from SPS to RHIC means that the transverse size of the firecylinder changes very little. If this is the fact, than the amount of the transverse hydrodynamic flow should also be similar, since it is difficult to imagine that a much stronger flow would lead to the same transverse size at freeze-out. To the contrary, the STAR results for the -spectra have been interpreted as an indication of a much stronger flow at RHIC. Below we redo the simple analysis of the hadronic spectra and show that the errors in the flow parameter are very large, such that one cannot definitely conclude that the flow is stronger at RHIC. Moreover, the PHENIX data suggest a much lower flow than STAR, such that it becomes compatible with the flow at SPS, as obtained from NA44 and NA49.
2 Compilation of the -spectra measured at SPS and RHIC
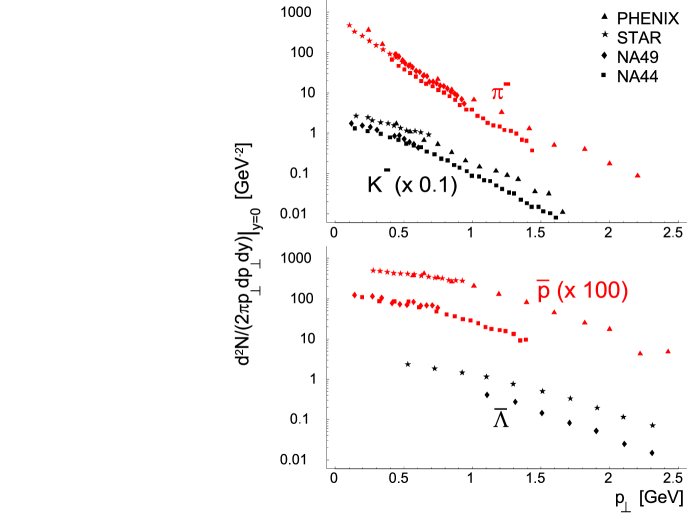
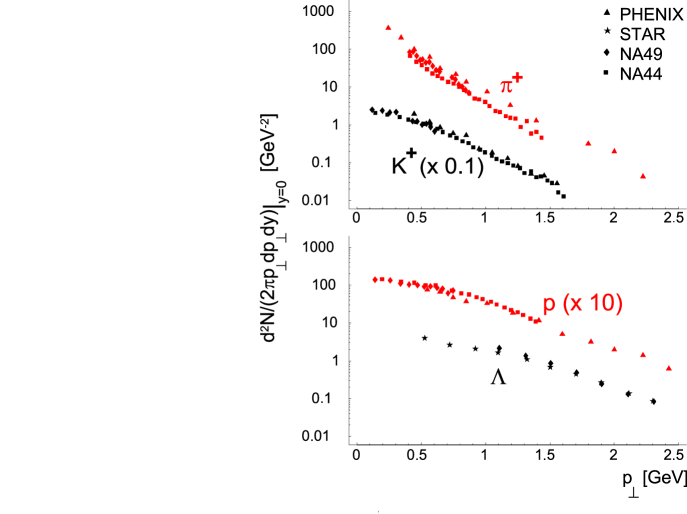
We begin by just displaying the experimental results from various groups in a single plot. In Fig. 1 we plot the -spectra of , , , and . Similarly, in Fig. 2 we show the -spectra of , , , and . The collected data come from the measurements done at midrapidity for the most central events [1, 2, 3, 4, 5, 6]. A striking feature of Fig. 1 is a very impressive agreement between different experiments for the pions. In the range 0.4 1.0 GeV, the data from NA49 coincide with the data from PHENIX and STAR, whereas the data from NA44 show the same slope with a slightly smaller normalization due to a different centrality choice (see the discussion below). A very similar -dependence is also seen in the spectra of kaons, , and measured by different experiments. In this case, however, a different normalization of the spectra between SPS and RHIC data is clearly seen. In Fig. 2 one can clearly see similarities in the shapes of the pion as well as the kaon spectra measured by NA44 and PHENIX.
If the plots for mesons and baryons were overlaid (cf. [15, 16]), one could see that the PHENIX data have the property that the -spectra of and cross around GeV, such that there are more protons than at large momenta. We wish to stress that the same phenomenon can be seen already at SPS, where the protons dominate at GeV. The lower value of the crossing point reflects a much higher proton density at SPS compared to RHIC.
At RHIC, the “anomalous” [3, 17] feature of the spectra is the dominance of over at GeV. One could speculate that a similar behavior might occur already at SPS, if the measurements had beed carried out to sufficiently high momenta. Indeed, when the NA44 data are extrapolated with simple exponential functions, then one finds that a crossing occurs around GeV. Since the exponential fits may not work over the large range in , this phenomenon remains a speculation till verified experimentally.
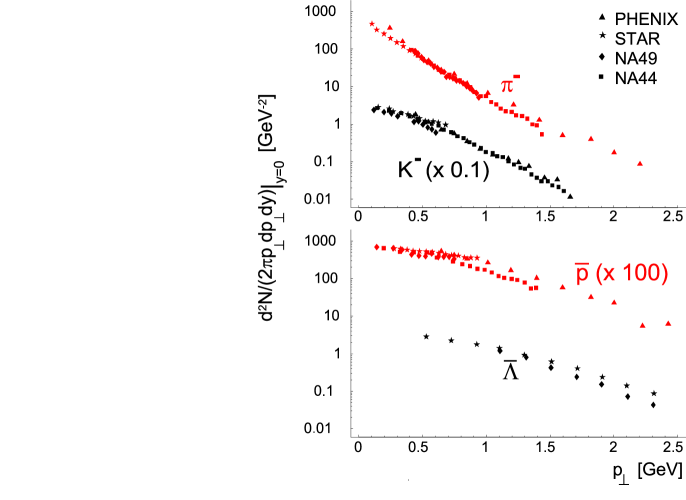
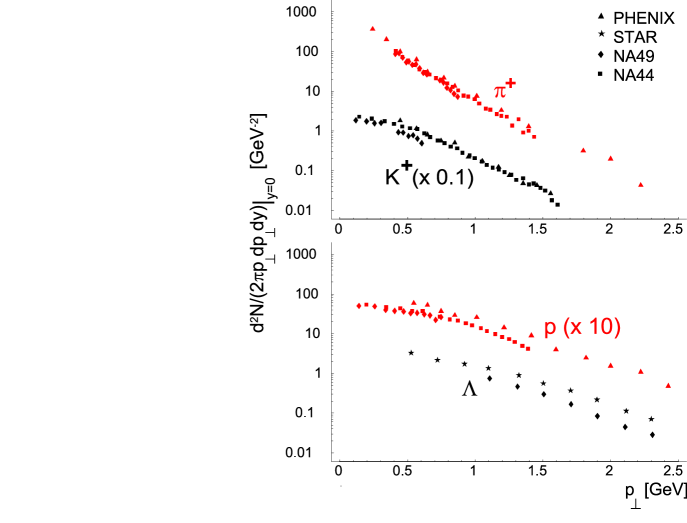
In order to see the similarities between the data even more vividly, we scale the normalization of the spectra in the following way:
-
1.
In the NA49 data we undo the corrections for the feeding of protons and antiprotons from weak decays. According to Ref. [2], this correction is about 30%, thus we divide the NA49 data for and by the factor 0.7.
-
2.
The most central data from NA44 correspond to the average impact parameter = 5 fm, whereas the most central NA49 data correspond to = 2 fm [1]. This difference explains a smaller normalization of the NA44 data. We correct for the centrality choice of NA44, multiplying all NA44 spectra by an educated-guess factor of 1.5.
-
3.
Inspired by the success of the thermal approach, we scale the spectra by the factor , where is the freeze-out temperature, , , and are the baryon number, strangeness, and the third component of the isospin of the particle, respectively, and , , and are the corresponding chemical potentials. At SPS (, GeV) [18]
(1) while at RHIC (, GeV) [19]
(2) Since in the thermal model the (original) spectra are proportional to the factor (for the Boltzmann statistics, which works very well), our rescaling approximately removes the effects of different chemical potentials at RHIC and SPS. Due to resonance decays, even within the thermal model the scaling is not exact, but approximate. 111For instance, a larger baryon chemical potential leads to a larger pion yield from the process , hence the secondary pions are sensitive to the baryon chemical potential.

The described rescaling is not necessary for our analysis, and has no impact on the conclusions. However, it is useful, since it brings the spectra closer and makes the eye-ball comparison easier. The results are shown in Figs. 3 and 4. For the pions, the four measurements agree very well in the overlap region. For the kaons, the NA49 data have a visibly larger slope, while the three other sets of data overlap. The measurements for protons and agree as well. The spectra of and have smaller slopes in the STAR measurement compared to NA49. One should bare in mind that the statistical errors are typically of the order of a few percent, and the systematic errors are around 10%. Hence, within the experimental errors, there are no significant differences between SPS and RHIC which could indicate different physics. Moreover, the small difference between NA44 and NA49, and between PHENIX and STAR, which one may observe in Figs. 3 and 4 is of the same magnitude as the difference between SPS and RHIC.
3 Exponential fits
In this Section we wish to quantify the eye-ball observations from Figs. 3 and 4. The most popular method is to fit the spectra to the exponential function, and compare the parameters. In fact, this is the most economic and common way of presenting the data, and the differences in the slope parameters of particles of different masses are interpreted as the signature of the transverse flow [20, 21]. Hence, we fit the function222Other forms used in the literature, differing by the power of , lead to similar qualitative conclusions.
| (3) |
to each rescaled spectrum, independently for different experimental groups.333We note that the slope parameters, , fitted in many papers, depend strongly on the choice of the range in (see, e.g., the discussion in [22]). Here we use the available data ranges with GeV. Because of the lack of strict thermodynamic interpretation, we refrain from calling the temperature of the spectrum. The method is as follows: we constrain the fit to GeV (this has relevance for the PHENIX data, and for and measured by STAR). For simplicity, we assume a 15% error on every point. This is in the ballpark of the errors given by the experimental groups. Then, the function is minimized with respect to the and parameters.
The results are shown in Fig. 5. The first feature to notice are large correlations between and , which lead to sizeable errors in these parameters. The optimum values for , denoted in Fig. 5 by crosses, and the errors are listed in Table 1. While the optimum values agree with the estimates made in other papers [1, 2, 3, 4], our errors are significantly larger for the case of STAR and NA49. The physically relevant parameter is the inverse slope, , while the norm parameter, , carries the ambiguities described above (rescaling). Hence, if the results of the two data sets are to be consistent, then the ranges of (and not necessarily ) should overlap. We note from Fig. 5 that this is basically the case for NA44 and NA49, except perhaps the case of . The STAR and PHENIX data are much less consistent, especially for the case of . For kaons, protons, and , the PHENIX data agree within errors with NA44 and NA49. Some caution is needed in the interpretation of Fig. 5, since the fits are made over different ranges in , and the form used for the fit has no sound physical ground. Yet, there are indications for discrepancies between STAR and PHENIX. Also, it is clear that only the STAR data suggest larger values of (albeit with large errors), which would mean larger transverse flow. If PHENIX data are used, no such conclusion comes out, since the PHENIX data are basically consistent with SPS. Note also that the quality of the fit, indicated by the value of at the optimum, is worst for the case of pions from PHENIX. This reflects the inapplicability of the simple exponential parameterization over the large range in .
| NA44 | NA49 | PHENIX | STAR | |
|---|---|---|---|---|
The final remark of this Section concerns the multiplicities of particles,
| (4) |
The integrand in Eq. (4) peaks at GeV for the pions, and 0.6 GeV for the protons. Therefore much of the strength comes from the region not covered by the data. The necessary extrapolation brings systematic uncertainties to and may be a source of discrepancies between various quoted numbers.
4 A model calculation
The estimates of the transverse flow must be based on model calculations which include this effect, as well as other potentially important physical effects. In this Section we apply the single-freeze-out model, which has been used successfully to describe the -spectra at RHIC. The model has been described in detail in of Refs. [15, 16, 22], and here we only list its basic features: i) simultaneous chemical and thermal freeze-out of the hadronic matter, ii) inclusion of all hadronic resonances, and iii) a simple parametrization of the freeze-out hypersurface, which is defined by the condition const. The hydrodynamic flow on the freeze-out hypersurface is taken in the form resembling the Hubble law, i.e., . That way both the longitudinal and transverse flows are built in. The single-freeze-out model has two thermodynamic parameters (temperature and the baryon chemical potential) which are fixed by the global fit to the relative particle yields (cf. Eqs. (1,2)). The extra two parameters ( and the transverse radius of the firecylinder ) determine the overall normalization and the shape of the spectra. In our present calculation the thermodynamic parameters are the same as those used previously in Sect. 2. 444We note that and are the only independent thermodynamic parameters, since and follow from the conservation of strangeness and electric charge. Then, the expansion parameters and are fixed separately to the data of each experimental group. They determine, in each particular case, the maximal transverse flow, given by the model formula
| (5) |
The average value of the transverse flow velocity, , is very close to .

The results are presented in Fig. 6, where we show the optimum values for the invariant time, , and the flow parameter, , together with their errors. If the results were consistent, then the fitted values would overlap. This is not the case. The fit to NA44 is far away from the fit to NA49, and the fit to STAR is far away from the fit to PHENIX. Amusingly, PHENIX is close to NA44, and STAR is close to NA49. The grand average of from combined PHENIX and STAR is close to the average from combined NA44 and NA49 experiments. These results indicate that even within a model capable of explaining the spectra one cannot conclude of a larger transverse flow at RHIC compared to SPS.
5 Conclusions
Here are our main points:
-
1.
The similarity of -spectra at SPS and RHIC in the data range suggests similar soft physics. We have argued that the combined present data do not lead to the conclusion of much larger transverse flow at RHIC. Only the STAR data for and support this view, although with large experimental uncertainty. The PHENIX data are compatible with the same transverse flow as in SPS.
-
2.
The property of the spectra that there are more protons than at large can be seen not only in the RHIC data, but also in the SPS data.
-
3.
At the moment the experimental discrepancies between NA44 and NA49, and between STAR and PHENIX are of the same magnitude as the discrepancies between SPS and RHIC. With better data more accurate conclusion would be achieved. In particular, the RHIC measurements at lower energies will be very useful in verifying theoretical hypotheses. The use of models failing to reproduce the RHIC data should be, if possible, avoided in the modeling of detectors and in the analysis of the data. Also, the frequently made corrections for weak decays are not very useful, since these can be accounted for without difficulty in theoretical models. When comparing the corrected data much care is needed as to how the feeding from weak decays has been subtracted.
- 4.
-
5.
The transverse HBT radii and the slopes of the spectra are similar at SPS and RHIC, which implies similar transverse flow, or, in general, similar soft transverse physics. The particle yields increased by 50% from SPS to RHIC naturally allow for a 20% increase of the transverse size and flow. We also recall that the magnitude of the elliptic flow coefficient, , is similar from SPS to RHIC [26].
-
6.
The similarity of the soft physics at RHIC and SPS may be explained by the parton saturation phenomenon [27, 28] (scenario (2) of Ref. [29]). If the onset of saturation occurs already at SPS energies, then the initial conditions for the multiparticle production are similar at SPS and RHIC, explaining the similarities discussed in this paper. The situation is reminiscent of the Hagedorn saturation [30, 31, 32] in elementary collisions, where the further increase of the collision energy does not lead to increased temperature.
-
7.
The property of the saturation of soft physics, or at least the very weak dependence on the collision energy, should help to verify and constrain various models. The incomplete list of the most popular approaches and ideas includes: thermal models [15, 16, 19, 33, 34, 35, 36, 37, 38], hydrodynamic models [39, 40, 41, 42, 43, 44, 45, 46, 47, 48, 49], transport theories [10], and saturation models [29].
References
- [1] I. G. Bearden et al., NA44 Collaboration, nucl-ex/0202019.
- [2] P. G. Jones and the NA49 Collaboration, Nucl. Phys. A610, 188c (1996).
- [3] K. Adcox et al., PHENIX Collaboration, nucl-ex/0112006; J. Velkovska, PHENIX Collaboration, Nucl. Phys. A698, 507 (2002).
- [4] C. Adler et al., STAR Collaboration, Phys. Rev. Lett. 87, 262302 (2001).
- [5] J. Harris, STAR Collaboration, contribution to QM2001.
- [6] C. Adler et al., STAR Collaboration, nucl-ex/0203016.
- [7] K. Adcox et al., PHENIX Collaboration, nucl-ex/0201008.
- [8] C. Adler et al., STAR Collaboration, Phys. Rev. Lett. 87, 082301 (2001).
- [9] L. Ahle et al., E-802 Collaboration, nucl-ex/0204001.
- [10] S. Soff, S. A. Bass, and A. Dumitru, Phys. Rev. Lett. 86, 3981 (2001)
- [11] B. B. Back et al., PHOBOS Collaboration, Phys. Rev. Lett. 85, 3100 (2000).
- [12] K. Adcox et al., PHENIX Collaboration, Phys. Rev. Lett. 87, 052301 (2001).
- [13] H. Appelshäuser et al., NA49 Collaboration, Phys. Rev. Lett. 82, 2471 (1999).
- [14] M. M. Aggarwal et al., WA98 Collaboration, Eur. Phys. J. C18, 651 (2001).
- [15] W. Broniowski and W. Florkowski, Phys. Rev. Lett. 87, 272302 (2001).
- [16] W. Broniowski and W. Florkowski, Proceedings of the International Worksshop XXX on Gross Properties of Nuclei and Nuclear Excitations, Hirschegg, Austria (GSI, Darmstadt, 2002), 146.
- [17] I. Vitev and M. Gyulassy, nucl-th/0104066.
- [18] M. Michalec, nucl-th/0112044.
- [19] W. Florkowski, W. Broniowski, and M. Michalec, Acta Phys. Pol. B33, 761 (2002).
- [20] T. Csörgő and B. Lörstad, Phys. Rev. C54, 1390 (1996).
- [21] R. Scheibl and U. Heinz, Phys. Rev. C59, 1585 (1999).
- [22] W. Broniowski and W. Florkowski, nucl-th/0112043.
- [23] P. Braun-Munzinger, J. Stachel, J. P. Wessels, and N. Xu, Phys. Lett. B 344, 43 (1995); Phys. Lett. B 365, 1 (1996).
- [24] J. Cleymans, D. Elliott, H. Satz, and R. L. Thews, Z. Phys. C74, 319 (1997).
- [25] F. Becattini, L. Bellucci and G. Passaleva, Nucl. Phys. Proc. Suppl. 92, 137 (2001).
- [26] S. A. Voloshin, Proceedings of the International Worksshop XXX on Gross Properties of Nuclei and Nuclear Excitations, Hirschegg, Austria (GSI, Darmstadt, 2002), 207.
- [27] K. Golec-Biernat and M. Wüsthoff, Phys. Rev. D59, 014017 (1999); Phys. Rev. D60, 114023 (1999); Eur. Phys. J. C20, 313 (2001).
- [28] E. Iancu, A. Leonidov, and L. McLerran, Lectures given at the NATO Advanced Study Institute “QCD perspectives on hot and dense matter”, Cargèse, Corsica, France, 2001, hep-ph/0202270.
- [29] D. Kharzeev, E. Levin, and M. Nardi, hep-ph/0111315.
- [30] R. Hagedorn, CERN preprint No. CERN-TH.7190/94 (1994), and references therein.
- [31] W. Broniowski and W. Florkowski, Phys. Lett. B490, 223 (2000).
- [32] W. Broniowski, in Proc. of Few-Quark Problems, Bled, Slovenia, July 8-15, 2000, eds. B. Golli, M. Rosina, and S. Širca, p. 14, hep-ph/0008122.
- [33] P. Braun-Munzinger, I. Heppe, and J. Stachel, Phys. Lett. B465 , 15 (1999).
- [34] M. Gaździcki and M. I. Gorenstein, Phys. Rev. Lett. 83, 4009 (1999).
- [35] J. Rafelski and J. Letessier, Phys. Rev. Lett. 85, 4695 (2000); hep-ph/0112027.
- [36] F. Becattini, J. Cleymans, A. Keranen, E. Suhonen, and K. Redlich, Phys. Rev. C64, 024901 (2001).
- [37] P. Braun-Munzinger, D. Magestro, K. Redlich, and J. Stachel, Phys. Lett. B518, 41 (2001).
- [38] K. A. Bugaev, M. Gaździcki, and M. I. Gorenstein, Phys. Lett. B523, 255 (2001).
- [39] P. J. Siemens and J. Rasmussen, Phys. Rev. Lett. 42, 880 (1979); P. J. Siemens and J. I. Kapusta, Phys. Rev. Lett. 43, 1486 (1979).
- [40] J. D. Bjorken, Phys. Rev. D27, 140 (1983).
- [41] G. Baym, B. Friman, J.-P. Blaizot, M. Soyeur, and W. Czyż, Nucl. Phys. A407, 541 (1983).
- [42] E. Schnedermann, J. Sollfrank, and U. Heinz, Phys. Rev. C48, 2462 (1993).
- [43] D. H. Rischke and M. Gyulassy, Nucl. Phys. A697, 701 (1996); Nucl. Phys. A608, 479 (1996).
- [44] R. Scheibl and U. Heinz, Phys. Rev. C59, 1585 (1999).
- [45] A. Ster and T. Csörgő, hep-ph/0112064.
- [46] P. Huovinen, P. F. Kolb, U. Heinz, P. V. Ruuskanen, and S. A. Voloshin, Phys. Lett. B503, 58 (2001).
- [47] D. Teaney, J. Lauret, and E. V. Shuryak, Phys. Rev. Lett. 86, 4783 (2001); Nucl. Phys. A698, 479 (2002).
- [48] T. Hirano, Phys. Rev. C65, 011901 (2002); T. Hirano, K. Morita, S. Muroya, and C. Nonaka, nucl-th/0110009.
- [49] U. Heinz, Nucl. Phys. A661, 140c (1999).