SCALING PROPERTIES OF THE TRANSVERSE MASS SPECTRA
J. SCHAFFNER-BIELICHa, D. KHARZEEVb, L. MCLERRANb and
R. VENUGOPALANb,c
aDepartment of Physics, Columbia University, New York, NY 10027, USA
bDepartment of Physics, Brookhaven National Laboratory,
Upton, NY 11973, USA
cRIKEN BNL Research Center, Brookhaven National Laboratory,
Upton, NY 11973, USA
Abstract
Motivated from the formation of an initial state of gluon-saturated matter, we discuss scaling relations for the transverse mass spectra at BNL’s Relativistic Heavy-Ion Collider (RHIC). We show on linear plots, that the transverse mass spectra for various hadrons can be described by an universal function in . The transverse mass spectra for different centralities can be rescaled into each other. Finally, we demonstrate that -scaling is also present in proton-antiproton collider data and compare it to -scaling at RHIC.
In this work, we report on applying scaling features of the initial state of the color glass condensate to data at RHIC, in particular to the transverse momentum distribution of hadrons (see [1, 2]).
It has been suggested that in collisions of heavy-ions at ultrarelativistic bombarding energies gluons are so densely packed in phase-space that they saturate [3] and form a color glass condensate [4, 5, 6, 7, 8, 9]. The initial momentum distribution of gluons for a color-glass condensate can be described by the scaling relation [10]:
| (1) |
Here, is the transverse area, the saturation scale and an universal dimensionless function for the produced gluons. The saturation scale depends on the energy, the centrality and atomic number of the two colliding nuclei.
We have to make several assumptions about the underlying dynamical picture to compare the above ansatz to actual experimental data: the initial gluon distribution is characterized by saturated gluons, there is a free streaming evolution which produces additional partons and finally, there is a freeze-out to hadrons. At all stages, the scaling properties of the initial state are preserved. Hence, we replace the scaling function for gluons and the saturation momentum with those for hadrons, i.e. and , respectively. Note, that is not equal to the saturation momentum for gluons but should have similar dependencies on energy and centrality. This simple picture works to explain the centrality dependence and the pseudorapidity dependence of the charged multiplicity at RHIC [9]. The question we are asking is, whether the above scaling relation eq. (1) can be utilized to describe the transverse momentum spectra at RHIC. We point out that our assumptions are completely contrary to the notion of radial flow or of thermalized and equilibrated matter.
Guided by the scaling relation for saturated gluons we propose that the distribution of produced hadrons can be cast in the following form:
| (2) |
The appropriate replacements, and are made from eq. (1) to eq. (2). In addition, we assume that the transverse momentum has to be replaced by the transverse mass for identified hadrons, in absence of any other boost invariant quantity. The new factors take into account effects of conserved quantum numbers, as strangeness and baryon number and are constants. The parameters and have to be determined from the data.
We take the minimum bias data of the transverse mass spectra from the PHENIX collaboration as measured for gold-gold collisions at GeV [11] and plot it as a function of the transverse mass. The curves for different hadron species are very close to each other without any adjustments in the absolute normalization. The spectra is closer to a power law than to an exponential. Shifting the protons up a factor (there is definitely a finite baryon number at midrapidity) and the kaons down by a factor (there seems to be a suppression of strange particles) puts all curves on top of each other (see [2] for the corresponding plots). That means that the slope of the curve is the same for a given irrespective of the hadron. The factors are indeed constants, they do not depend on . The scaling pattern is present even for quite large values of –4 GeV.
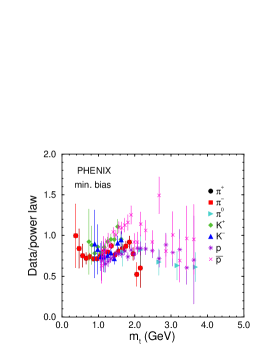
To better see any deviations from -scaling, we divide the data by a power law fit with GeV and . The value for seems to be high. Nevertheless, we remind the reader that the two parameters of the power law fit are tightly constrained by the mean , so that lower values of can be achieved by lowering correspondingly with basically the same fit quality. The linear plot of the transverse mass spectra relative to that power law fit is shown in Figure 1. One sees, that the deviations from scaling are only about 30% including systematic errors from the fit!
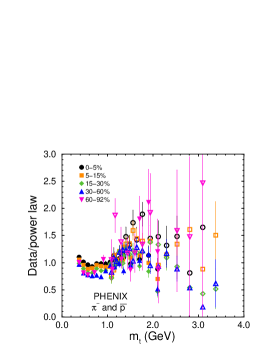
Next, we consider the centrality dependence of the particle spectra using the transverse momentum distributions of and antiprotons from PHENIX [11]. If there is indeed an universal function, the observed -scaling should also hold for different centrality bins. In addition the centrality dependence is controlled solely by the transverse area and the saturation momentum . To test the universality, the distribution for different centralities is rescaled by
| (3) |
The data points are then on top of each for all centrality bins (see [2] for a plot). Again, we make a linear plot by dividing the rescaled data by a power law. We take as reference curve a fit to the most central bin with the parameters GeV and . The data relative to this power law is plotted in Figure 2. As one sees, scaling works within 30% up to say GeV for all centrality classes.
The extracted scaling parameters and are now expected to scale like and , respectively. The saturation scale turns out to change as a function of centrality like . This implies that there is an additional constant scale involved which is already present in pp or p collisions and can be associated with the Hagedorn temperature or equivalently the constant and finite mean transverse momentum seen at the ISR of about 300 MeV. The additional vacuum scale is compatible with the mean measured by the UA1 collaboration for p collisions at GeV [13] of MeV and the one by the STAR collaboration of MeV for central gold-gold collisions at GeV [14]. The other scaling parameter, , follows the expected pattern, i.e. [2].
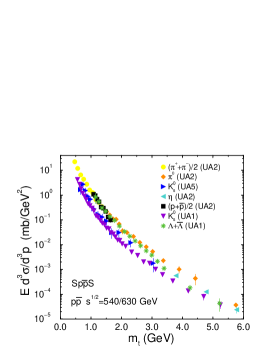
Finally, we discuss -scaling for p-collisions. Identified hadron spectra were measured for energies of and GeV by the UA1, UA2 and UA5 collaborations [15, 16, 17] over a large range of transverse momenta. The transverse mass spectra of various hadrons is depicted in Figure 3. Without any change in the normalization, all curves are close to each other and have similar shapes. The proton data (black squares) are on top of the charged pion data, i.e. the is one for the case of p collisions as the net baryon number is zero. Kaons are suppressed compared to pions and protons, similarly as seen in the RHIC data. The strange data points are on the pion and proton data, but note that there is a factor two difference compared to the proton data, so that ’s are suppressed by 1/2 like the kaons. We expect then a similar pattern for the hyperon data in heavy-ion collisions in RHIC, if corrected for the baryon number. So, -scaling seems to work also for p collisions up to several GeV in transverse mass. The factors, i.e. corrections to scaling due to strangeness and baryon number, follow the expected patterns. One notes, however, in Figure 3 that the data start to have a slightly different slope above GeV than the pions, so that it approaches the kaon data. This does not seem to be the case for the other mesons, ’s and kaons, though.
In summary, we showed that the transverse mass spectra of hadrons at RHIC follows one universal function of . Radial flow is not necessary to describe the data. The same universal behavior seems to present in proton-antiproton collider data. The spectra at different centralities can be rescaled into each other up to GeV. The scaling parameters follow the pattern expected from the formation of a gluon-saturated state (color-glass condensate) if an additional vacuum scale is introduced.
We thank Barbara Jacak, Julia Velkovska, and Nu Xu for many helpful discussions. JSB thanks RIKEN BNL Research Center and the Nuclear Theory Group at BNL for their kind hospitality. This manuscript has been authorized with the U.S. Department of Energy under Contracts No. DE-AC02-98CH10886 and No. DE-FG-02-93ER-40764.
References
- [1] L. D. McLerran and J. Schaffner-Bielich, Phys. Lett. B 514, 29 (2001).
- [2] J. Schaffner-Bielich, D. Kharzeev, L. D. McLerran and R. Venugopalan, nucl-th/0108048 (2001), Nucl. Phys. A in press.
- [3] L. V. Gribov, E. M. Levin, and M. G. Ryskin, Phys. Rep. 100, 1 (1983); A. H. Mueller and J. W. Qiu, Nucl. Phys. B 268, 427 (1986); J. P. Blaizot and A. H. Mueller, Nucl. Phys. B 289, 847 (1987).
- [4] L. .D. McLerran and R. Venugopalan, Phys. Rev. D 49, 2233 (1994); ibid. 3352 (1994); ibid. 50, 2225 (1994).
- [5] A. Kovner, L. D. McLerran, and H. Weigert, Phys. Rev. D 52, 6231 (1995); ibid. 3809 (1995).
- [6] Y. V. Kovchegov, Phys. Rev. D 54, 5463 (1996).
- [7] J. Jalilian-Marian, A. Kovner, L. D. McLerran, and H. Weigert, Phys. Rev. D 55, 5414 (1997); J. Jalilian-Marian, A. Kovner, A. Leonidov, and H. Weigert, Nucl. Phys. B 504, 415 (1997); Phys. Rev. D 59, 014014 (1999).
- [8] E. Iancu, A. Leonidov, and L. D. McLerran, Nucl. Phys. A 692, 583 (2001).
- [9] D. Kharzeev and M. Nardi, Phys. Lett. B 507, 121 (2001); D. Kharzeev and E. Levin, nucl-th/0108006 (2001); D. Kharzeev, E. Levin, M. Nardi, hep-ph/0111315 (2001).
- [10] A. Krasnitz and R. Venugopalan, Phys. Rev. Lett. 86, 1717 (2001); ibid., 84, 4309 (2000); Nucl. Phys. B 557, 237 (1999); A. H. Mueller, Nucl. Phys. B 572, 227 (2000).
- [11] J. Velkovska [PHENIX collaboration], Nucl. Phys. A 698, 507 (2002) and private communication.
- [12] G. David [PHENIX collaboration], Nucl. Phys. A 698, 227 (2002) and private communication.
- [13] C. Albajar et al. [UA1 Collaboration], Nucl. Phys. B 335, 261 (1990).
- [14] C. Adler et al. [STAR Collaboration], Phys. Rev. Lett. 87, 112303 (2001).
- [15] G. Bocquet et al. [UA1 collaboration], Phys. Lett. B 366, 441 (1996).
- [16] M. Banner et al. [UA2 collaboration], Phys. Lett. 115B, 59 (1982); Phys. Lett. 122B, 322 (1983); Z. Phys. C27, 329 (1985).
- [17] G.J. Alner et al. [UA5 collaboration], Nucl. Phys. B 258, 505 (1985).