Event-by-Event Analysis of Proton-Induced Nuclear Multifragmentation: Determination of Phase Transition Universality-Class in System with Extreme Finite-Size Constraints
Abstract
A percolation model of nuclear fragmentation is used to interpret 10.2 GeV/c p+197Au multi-fragmentation data. Emphasis is put on finding signatures of a continuous nuclear matter phase transition in finite nuclear systems. Based on model calculations, corrections accounting for physical constraints of the fragment detection and sequential decay processes are derived. Strong circumstantial evidence for a continuous phase transition is found and the values of two critical exponents, and , are extracted from the data. A critical temperature of MeV is found.
pacs:
05.70.Fh, 05.70.Jk, 25.70.Pq, 25.40.Ve, 64.60.Ak, 64.60.FrReactions in which excited nuclei break up into intermediate size fragments, nuclear multi-fragmentation reactions, are believed to be associated with a liquid-gas type phase transition in nuclear matter. However, so far no unambiguous proof for this transition has been found in experimental data. This is due to, primarily, the exteme finite size effect involved in systems of only on the order of constituents, the impossibility to fix a system at points in the phase diagram and study it there, as well as the complication due to sequential decays of the fragments produced in their excited state.
In this Letter we report results of an analysis of data on proton-induced fragmentation reactions of a 197Au target at incident energies of 10.2 GeV/c. These data were collected by the ISiS collaboration [6] in experiments at the Brookhaven National Laboratory AGS accelerator facility. A comparison with percolation-theory-based models is conducted. This comparison enables us to pay particular attention to detector efficiency effects, finite size effects, as well as to the role played by sequential decay processes. With these corrections applied, an event-by-event scaling analysis is performed in order to derive values for the critical exponents and and the critical temperature of the phase transition.
The ISiS collaboration has produced one of the most complete experimental multifragmentation data sets with very high statistics. These data have also been interpreted in the framework of other phase transition models, in particular the SMM, EES, and SIMON models [7], usually associated with a liquid-gas type phase transition. However, within the models the order of the phase transition depends on certain model parameters, as well as on the size of the system, see for example [8]. The percolation approach provides an effective alternative way for determining the order of the phase transition and the influence of finite size effects.
The percolation model of nuclear multi-fragmentation used in our analysis has been introduced originally by Bauer et al. [9] and used by many groups [10]. It utilitizes a representation of the target nucleus by sites of a simple cubic lattice () in an approximately spherical shape, with nearest-neighbor bonds representing the (short-ranged) strong force between the nucleons. These bonds are broken statistically independently with a probability . Clusters of connected sites are counted and interpreted as fragments.
Multi-fragmentation reactions, in particular proton-induced multi-fragmentation reactions, can be thought of as three-step processes. In the first step excitation energy is deposited in the target nucleus and pre-equilibrium particles are emitted. In the second step, the thermalized source breaks up into intermediate mass fragments. In the final step, the excited pre-fragments decay via standard sequential decay channels into the fragments that can be observed by the detector.
Step One: Energy deposition. The percolation model needs a bond breaking probability as input. can be determined from the energy deposited in the system via
| (1) |
where is the generalized incomplete Gamma function, is the binding energy per nucleon in the source, is the temperature of the source, and is the excitation energy per nucleon of the source [11]. It is assumed that the relation between the excitation energy of the fragmenting source and the temperature is given by with (corresponding to the high temperature limit of a degenerate Fermi gas model; is the mass number of the residue nucleus, compare also [12]). Here we utilitize the energy deposition and source size information as determined from the experimental data [6]. It can be argued that should be used for low excitation energies, where surface effects are dominant. However, close to the critical point surface effect disappear, and this motivates our choice of . One should keep in mind, however, that this choice will have some (minor) consequences for the exact value of the critical value of the control parameter of the percolation model.
Step Two: Percolation. For the size of the lattice, we use the charge of the nucleus after emission of pre-equilibrium particles. This information is also contained in the ISiS data set, on an event-by-event basis. Alternatively, one could also use the mass of the source. For the theory, this provides no difficulties whatsoever. However, in the experiment mostly the charges of the particles are detected. Thus it is natural to use the charge as the relevant quantity in our calculations. The assumption that the source has an approximately spherical shape after the emission of pre-equilibrium particles is supported by nuclear transport theory calculations in the BUU model [13]. After setting up the source on the lattice, the bonds are broken with the probability and the cluster structure is analyzed.
Step Three: Sequential Decay. For this, we use a computer code we recently developed to investigate radioactive isotope yields in RIB facilities [14]. Eight decay modes were considered: proton, neutron, deuteron, dineutron, diproton, t, 3He and . The decay weights were chosen according to Weisskopf arguments. For nuclei up to nitrogen experimentally measured values were used for the excited states. Decays were calculated for all levels in all nuclei. For the decay of each level, the decay rate was calculated into every possible level energetically accessible through the decay modes listed previously. The weight associated with the decaying nucleus was then apportioned into all the states in proportion to the rates for the decay into such states. The weights were also simultaneously added into the ground states of the nuclei representing the decay modes. Thus, the decaying process exactly preserved the initial and of the original source system.
While the ISiS data set contains essentially complete events, it is still subject to the usual problems associated with multi-particle detector systems of subatomic particles, such as energy cuts, gaps between the active areas of the detector elements, loss of charge and mass-resolution for heavier fragments, and fragments that escape detecting by being stopped in the target or traveling down the beam pipe. For the quantitative study we attempt here, these effects can not be neglected. We have thus created extensive filter software to simulate detector acceptance effect.
Fig. 1 shows the comparison of our calculations with the experimental data. The data points with the (very small) error bars represent the results of the experimental charge yields. The discontinuity at charge is due to the fact that only charges up to that value could be resolved elementally by the detector and the assumption that all missing mass is contained in a single residue (corrected for prompt particle emission during the fast cascade stage of the reaction). The dotted histogram is the result of our model calculations, as described in the previous section, without applying the filter. Filtering of our model calculations through the detector acceptance filter yields the thick histogram. It is in essentially perfect agreement with the data. The discrepancy between the two histograms thus gives us a good understanding of the degree to which the raw experimental data are affected by detector acceptance effects. One can also investigate more exclusive observables, such as the vanishing of the largest cluster as a function of the multiplicity, or the second moment as a function of the multiplicity. For the percolation model, these comparisons were published previously for other, but similar, data sets [15, 16]. Here, we obtain similar degree of agreement. These comparisons, as well as a comparison of a charge of the largest cluster for different multiplicity bins, have been performed [17] and will be published in a forthcoming paper.
From analytical solutions and numerical results on very large lattices, it can be inferred that in percolation theory, for the control parameter assuming values close to the critical value , the cluster numbers scale as
| (2) |
where is the size of a cluster. The scaling function has the property and accounts for the fact that a power law dependence is only correct in the case of .
Implicitly introduced by Eq. 2 are two critical exponents of percolation theory: and . With the definition , we can rewrite Eq. 2 as:
| (3) |
This leads to the interpretation of as a crossover size for the cluster sizes from power law abundance for to exponentially rare clusters of size .
A special case of the general Eq. 2 is, for example, the scaling implied by the Fisher droplet model [18],
| (4) |
where is the size of a droplet and is the scaled control parameter. From this equation we expect a straight line when plotting in a semi-log plot (compare Fig. 2) vs. in the vicinity of the critical point, provided the scaling behavior holds. In addition, the straight line should have the property of . (Here it is assumed that the bulk factor is close to unity, an assumption that is supported by earlier findings of Elliott et al. [19].)
In the context of the percolation model, the same scaling behavior can be expected if one substitutes the temperature by the bond breaking probablity . Again, the cutoff function in the scaling equation is then given by the exponential factor in Eq. 4. Thus, one can find numerical values for , and , or , respectively, by conducting a optimization procedure for the parameter set for which the log of the scaled yield, , as a function of the scaled control parameter, , collapses on a single straight line best fit.
The result of this optimization procedure for the unfiltered model calculation is shown in Fig. 2. The values of the critical parameters extracted are , , in good agreement with the accepted values of standard 3d percolation on infinite lattices, and . We also find . This shows that , unlike and , is strongly affected by finite size scaling corrections, in accordance with the findings of [9, 20].
Having shown that the method yields reasonable results in a known case, we apply it to the determination of the critical parameters of the ISiS data. In previous analyses of this kind, no corrections for sequential decays, feeding, population of particle unstable resonances, and all other final state modifications of the charge yield spectrum were considered (see [21]). In addition, all detector acceptance corrections were neglected. We have paid particular attention to these effects in the work presented here.
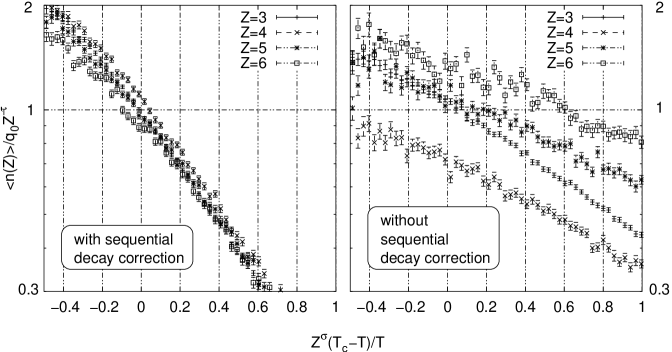
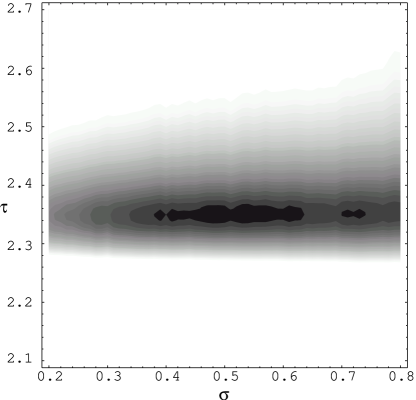
To estimate the corrections for sequential decays, we start with our model calculations presented in the previous sections. These calculations can reproduce almost all features of the data and in particular the charge yield spectrum, after detector and final state interaction corrections. Since we know the model yields before and after the corrections, we can extract the charge resolved correction factors. These factors are then applied to the experimental data. The result of the resulting optimization procedure is shown in the left hand side of Figure 3. The values of the critical parameters obtained are , , and MeV. The contours of the fit are shown in Figure 4 for MeV.
If one neglects the corrections for detector acceptance and sequential decays, then there is no way that the yields for different light IMFs can be collapsed onto a single scaling graph. On the right hand side of Figure 3 we show the best fit result of the optimization for that case. It is obvious that the collapse is not achieved. This comparison can also be made for . The ISiS data set has elementally resolved yields for . But the effects of final state sequential decay corrections is strongest for the lightest element, and we thus restrict ourselves to show these here.
Summarizing, a three-step percolation model for nuclear multi-fragmentation reactions has been introduced. In order to reduce unnecessary model dependences we have chosen to utilitize the information on source size and excitation energy deposition provided in the experiment. For the fragmentation part of the model we use the well-known percolation approach. Particular attention is paid to the effects of detector acceptance and sequential decays. We find that our calculations are in very good agreement with the data. Since the infinite size limit of the model contains a second order continuous phase transition for a certain range of excitation energies that is covered by a subset of the events in the present data set, we interpret this agreement as strong circumstantial evidence for a continuous phase transition in nuclear matter. This interpretation is supported by a scaling analysis. We find that the data show very strong scaling behavior, as expected in the vicinity of the critical point. The critical parameters extracted from a optimization procedure have the values , , and MeV.
This work was supported by NSF grants INT-9981342 and PHY-0070818, the US Department of Energy, and NSERC of Canada. MKB also received funding from the Studienstiftung des Deutschen Volkes. WB acknowledges support from an Alexander-von-Humboldt Foundation Distinguished Senior U.S. Scientist Award. The work reported on here was part the Master’s thesis of MKB.
REFERENCES
- [1] Corresponding author, bauer@pa.msu.edu
- [2] Current address: Département de physique, génie physique et optique, Unversité Laval, Ste-Foy (Québec), Canada, G1K 7P4
- [3] Current address: Physics Division P-23, Los Alamos National Laboratory, Los Alamos, NM 87545
- Γ[278] Current address: LPC de Caen, 14050 Caen cedex, France
- [5] Current address: Rush Presbyterian, St. Luke Medical Center, Chicago, IL 60612
- [6] W.-C. Hsi et al., Phys. Rev. Lett. 79, 817 (1997); L. Beaulieu et al., Phys. Lett. B163, 159 (1999); L. Beaulieu et al., Phys. Rev. C. 63, 031302 (2001).
- [7] K. Kwiatkowski et al., Phys. Lett. B423, 21 (1998); J.P. Bondorf, A.S. Botvina, A.S. Iljinov, I.N. Mishustin, and K. Sneppen, Phys. Rep. 257, 133 (1995). T. Lefort et al., Phys. Rev. C 62, 031604(R) (2000); D. Durand, Nucl. Phys. A541, 266 (1992); W. Friedman, Phys. Rev. C 42, 667 (1990).
- [8] J. A. Hauger et al., Phys. Rev. C62, 024616 (2000).
- [9] W. Bauer et al., Phys. Lett. 150 B, 53 (1985); Nucl. Phys. A452, 699 (1986); W. Bauer, Phys. Rev. C 38, 1297 (1988).
- [10] X. Campi, J. Phys. A 19, L917 (1986); T. Biro et al., Nucl. Phys. A459, 692 (1986); J. Nemeth et al., Z. Phys. A 325, 347 (1986); L. Phair, et al., Phys. Lett. B314, 271 (1993); Y.M. Zheng, J. Richert and P. Wagner, J. Phys. G22 505 (1996); G. Kortemeyer et al., Phys. Rev. C 55, 2730 (1997).
- [11] T. Li et al., Phys. Rev. Lett. 70, 1924 (1993); T. Li et al., Phys. Rev. C 49, 1630 (1994); see also: A. Coniglio and Klein, J. Phys. A 13, 2275 (1980); X. Campi, and H. Krivine, Nucl. Phys. A 620, 46 (1997).
- [12] J. B. Elliott et al., Phys. Lett. B 381, 35 (1996); M. L. Gilkes et al., Phys. Rev. Lett. 73, 1590 (1994).
- [13] G. Wang et al., Phys. Rev. C 53, 1811 (1996).
- [14] S. Pratt, W. Bauer, Ch. Morling, and P. Underhill, Phys. Rev. C 63 034608 (2001); W. Bauer, S. Pratt, Ch. Morling, and P. Underhill, Heavy Ion Physics, 14, 29 (2001).
- [15] W. Bauer and A. Botvina, Phys. Rev. C 52, R1760 (1995); W. Bauer and A. Botvina, Phys. Rev. C 55, 546 (1997).
- [16] W. Bauer and W. A. Friedman, Phys. Rev. Lett. 75, 767 (1995).
- [17] M. Kleine Berkenbusch, M.S. thesis, Michigan State University (2001).
- [18] M. E. Fisher, Physics 3 (5), 255 (1967).
- [19] J. B. Elliott et al., Phys. Rev. Lett. 85, 1194 (2000).
- [20] H.M. Harreis and W. Bauer, Phys. Rev. B 62, 8719 (2000).
- [21] J. B. Elliott et al., preprint nucl-ex/0104013 (2001).