Generalized scaling of the transverse mass spectrum at the Relativistic Heavy-Ion Collider
Abstract
We argue that the transverse mass spectra of identified hadrons as measured in gold-gold collisions at BNL’s Relativistic Heavy-Ion Collider (RHIC) follows a generalized scaling law. Such a scaling behavior is motivated by the idea of a Color Glass Condensate, or more generally, saturation of the gluon density. In particular, we describe the shapes of transverse mass spectra as a function of centrality. This scaling of the transverse mass spectrum is shown to be consistent with previously observed scaling of multiplicity with centrality.
I Introduction
In a previous work, two of us argued that the mean transverse momenta measured in relativistic heavy-ion collisions can be described by the intrinsic transverse momentum broadening seen at the Tevatron for collisions [1]. The mean transverse momenta of charged and identified hadrons increases universally with the square root of the multiplicity per unit transverse area for both and AA collisions. In addition, it has been shown that the total hadron multiplicity follows a scaling behavior motivated by the gluon saturation [2].
In this paper, we try to combine these two ideas in a consistent picture of transverse mass distributions of identified particles as a function of centrality. To do this, we apply theoretical ideas emerging in the Color Glass Condensate description of the high gluon density phase of QCD. Specifically, we describe the transverse momentum spectra using the recently measured data from BNL’s Relativistic Heavy-Ion Collider (RHIC) for AuAu collisions at AGeV.
The theoretical motivation for such scaling relations is as follows. At very high energies, the number of partons (primarily gluons) in a nucleus grows very rapidly. When the occupation number of these partons is large, they saturate [3, 4, 5] and form a novel state of matter called a Color Glass Condensate (CGC) [2, 6, 7, 8, 9, 10, 11]. The CGC has a bulk scale () which is the typical intrinsic transverse momentum of the saturated gluons in the nucleus. The CGC can be probed in deeply inelastic scattering [12, 13], in photoproduction in peripheral heavy-ion collisions [14], in pA collisions [15, 16] and in heavy-ion collisions [2, 10, 11].
We remark, that scaling analysis of the transverse mass spectra at RHIC has been also pursued in [17] although within a different physical picture.
II Generalized -scaling
A Scaling Relations
Collisions of heavy-ions at high energies can be imagined as the collision of two sheets of colored glass, and a large multiplicity of gluons is produced. Since the occupation number of the gluons in each of the colliding nuclei is large, the problem can be treated classically [10]. The only dimensionful quantities available to describe the collision are a) the transverse area of the two colliding nuclei and b) the saturation scale we mentioned previously, which is determined by the density of partons in the transverse plane. This saturation scale is a function of both energy and centrality. All dimensionful quantities can therefore be expressed in terms of powers of one or the other scale times non–perturbative functions of the dimensionless product of the two scales. The initial momentum distribution of produced gluons in high-energy collisions is then found to be given by the relation [11]
| (1) |
Here, is a universal, dimensionless function for the produced gluons which depends only on the ratio of the transverse momentum and the saturation momentum. Different energies or scales are described by the same function with a correspondingly changed saturation momentum .
Motivated by the above relation, we want to test in this paper how well these scaling relations describe the actual data, i.e. the momentum distribution of produced hadrons. Ab initio, it is not obvious that there is such a relation as hadrons are produced nonperturbatively at the deconfinement phase transition. There is also surely some transverse flow of the matter produced in these collisions and it is not clear to what degree this flow might distort the distributions produced early in the CGC. Also, hard processes are expected to modify the scaling relations at sufficiently high transverse momenta above the saturation scale .
We find that the transverse momentum distributions of identified particles are well described as a function only of the transverse mass . This appears to be a good approximation so long as we are not too close to the mass of the particle in question. (At small values of we expect flow effects to be important which will invalidate this simple scaling form of the distributions.) We therefore parameterize the transverse momentum spectra as
| (2) |
The universal function depends on and the corresponding saturation scale for hadrons and incorporates -scaling. The constant reflects the difference in abundances of various species of particles, and is of order one for the particles which we consider. We take it to be independent of . The hadron saturation momentum as well as are parameters which are determined by the energy and centrality of the collision. We assume to have the same energy and centrality dependence as the saturation momentum . Also, the function has to be extracted from the data. But once the universal function is fixed for one data set, it should describe the other data by rescaling the parameters and . Hence, the scaling relation implies that there is one and only one function which describes high-energy collisions at various centralities, energy and system size. This picture can certainly be valid only in some range of these parameters. It is the purpose of this investigation to determine how well scaling works for data from relativistic heavy-ion collisions.
B Comparison with RHIC Data
We turn now to a more detailed discussion of the transverse momentum distribution focusing on identified hadron spectra as measured recently at RHIC in AuAu collisions with AGeV [18, 19, 20, 21, 22, 23]. Note that in relation (2) all hadrons are described by only one function of the transverse mass . The transverse mass is just the total transverse kinetic energy carried by that hadron. Plotting the transverse mass spectra for identified hadrons as a function of (not as a function of ) should then result in one single curve. This idea is not particularly new. It is similar to the -scaling behavior put forward by Hagedorn for collisions in his statistical model [24]. The universal function in the Hagedorn model is then a Bose-Einstein or Fermi-Dirac distribution and depends on one parameter, the slope parameter . Contrary to this picture, we approach the problem in reverse and try to determine the universal function from the experimental data.
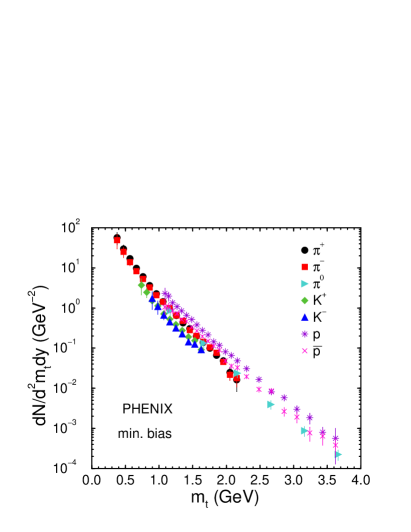
The transverse momentum spectra of pions, kaons, protons and antiprotons have been reported by the PHENIX collaboration at RHIC to quite large transverse momenta [19]. For the first time in hadronic collisions, one sees that the protons and antiprotons seem to be more abundant at higher transverse momentum GeV than pions. The slope of the transverse momentum spectra for protons and antiprotons is apparently much larger than that of the pions, so that the nucleon spectra overshoots the pion spectra at some GeV.
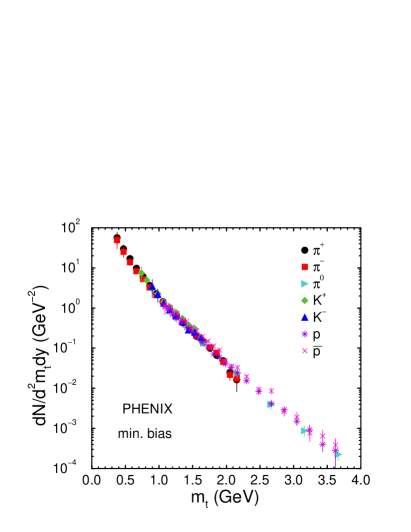
The scaling relation (2) can now be tested by plotting the transverse mass spectra. Figure 1 shows the preliminary minimum bias data of the PHENIX collaboration for charged pions, kaons, protons and antiprotons [19] and for neutral pions [20] as a function of (not ). As one can see from Fig. 1, the data points for all hadrons seem to follow one curve over several orders of magnitude for a broad range of transverse mass. The neutral pion data is on top of the antiproton data within the error bars. But one notices also, that the curves for kaons and protons are shifted downwards and upwards, respectively. These are effects due to quantum numbers (strangeness and baryon number) which are not taken into account in the scaling relation. The production of strange particles is suppressed due to the strange quark mass, while the number of protons is enhanced due to the initial baryon number excess coming from the two colliding nuclei. Interestingly the proton-antiproton pair production seems to be not suppressed relative to pion production but kaon production is. We note that these changes are moderate, they shift the curves of the kaons down by about a factor two while shifting the proton curve up by about a factor two from the universal curve. These shifts correspond to the constant in eq. 2. Shifting the kaon and the proton spectra by these factors results in Fig. 2. Now all the data points are lying on one curve. It tells us that the shape of the spectra for the same value of are equal for pions, kaons, and nucleons. (Often times, a slope parameter is extracted to characterize spectra. This is extracted from the spectra close to the mass threshold, i.e. at . The larger the mass of the hadron the larger will be its slope parameter , as the slope of the transverse mass spectra is increasing with . We can read from Fig. 2, that this effect will also continue for heavier particles but it is less pronounced as the slope of the curve levels off.) If scaling works for all particles, the transverse mass distribution of hyperons will then follow also the same universal -curve of Fig. 2 modulo shape independent effects from baryon and strangeness number conservation which affect only the overall normalization of the distribution.
Being more quantitative, the transverse mass spectra of Fig. 2 can be fitted by a power law of the form with the parameters and GeV. We remark that the values for and are strongly correlated, fits with different values for and properly adjusted gives an equally good fit to the data points. The values for and are constrained in such a way that they get about the same mean transverse mass of
| (3) |
for each fit. Let us define now the local slope as
| (4) |
Then we find that the local slope parameter for a power-law distribution in is given by
| (5) |
i.e. a constant term plus a term linear in the transverse mass. The constant is closely related to the mean transverse mass. The correction term proportional to the transverse mass originates from the non-exponential behavior of the power-law distribution which enhances the high- part of the distribution. With the fitted parameters given above, we find the following slope parameters for various hadrons at : 175 MeV (), 196 MeV (K), 224 MeV (p), 235 MeV (), 247 MeV (). The actual measured values for , and nucleons are higher [19] as the experimental fits are taken around GeV above the threshold. Hence, the apparently different slopes for hadrons can be also explained by a generalized -scaling of the transverse mass spectra. Note, that the relation (5) is similar to the one derived for radial flow of non-relativistic particles [25]. In collisions, the value for is smaller than in collisions, so that the deviations from an exponential shape of the transverse mass distribution are less pronounced. Therefore, one recovers in collisions the traditional -scaling behavior of Hagedorn’s statistical model [24] with about similar slope parameters for all hadrons. We will discuss the centrality dependence below in more detail.
We remark that the universal -scaling seen in Fig. 1 does not rule out radial flow because at large momenta the hydro picture also predicts a universal curve for all hadrons. A clear indication of radial flow would be a deviation from the -scaling curve. These deviations should be especially pronounced for heavier hadrons. STAR measures at even lower than PHENIX and reports a larger slope parameter for antiprotons than PHENIX [22, 23]. This experimental finding cannot be explained by generalized -scaling. The flatter distribution at small close to compared to larger can be well described in hydrodynamical models with collective transverse flow [26, 27, 28]. In general, radial flow implies a violation of scaling, as the transverse momentum distribution then depends then on both, and .
We expect that there should be radial flow effects in heavy ion collisions. These should show up in a relatively unambiguous way as the deviations from scaling for near threshold. What we try to describe in this paper are the gross features of the data for far from threshold. The consistency of the picture we present is simple within the Color Glass Condensate framework. It may turn out for reasons which we do not understand that radial flow preserves these simple patterns. For example, this might be plausible if the flow sets in very early in the collision. It might also turn out that the patterns we observe have some as yet undiscovered interpretation. The scaling relations we present nevertheless would remain as a simple phenomenological description of the data.
III Scaling with Centrality
The scaling relation (2) predicts more than the universal curve for the transverse mass spectra. As it should be valid for all centralities, the transverse mass spectra should scale for each centrality class. Moreover, there is only one scaling function and the transverse mass spectra for different centralities can then be rescaled into each other by properly choosing the transverse area and the momentum for each centrality bin.
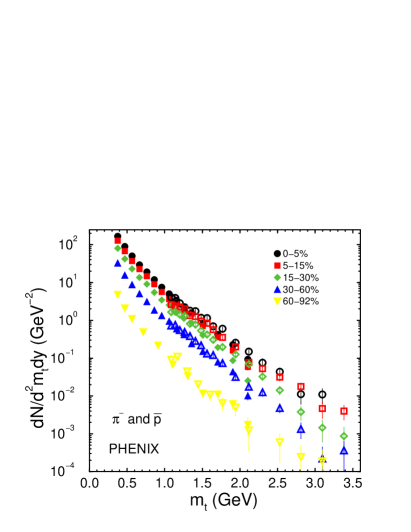
The first statement is probed in Fig. 3 which shows the preliminary -spectra of PHENIX for negatively charged pions and antiprotons for different centralities [19]. Indeed, it seems that there is a universal function for each centrality bin, even for the most peripheral one, which describes the pion and antiproton spectra simultaneously. The form of the curves looks similar for the various centralities, too.
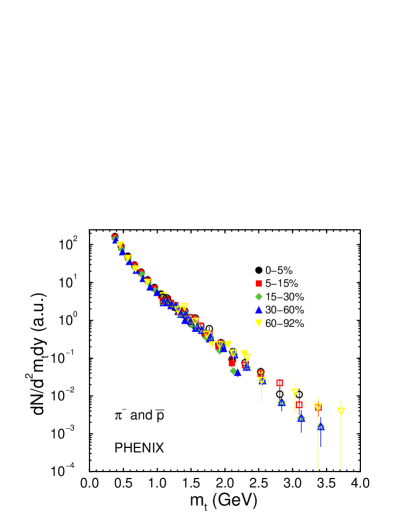
To check that the distribution is universal, we rescale the data points in absolute normalization and in transverse mass:
| (6) |
so that the data points for all centralities are lying on top of each other. We choose the most central bin as a reference curve. The scaling parameters and are extracted for each centrality bin. The scaling parameter is just for a given centrality relative to the value for the most central bin. The parameter is the momentum for a given centrality bin divided by the one for the most central bin. Technically, we use the -spectra of charged particles as measured by the PHENIX collaboration [18] to fix the scaling parameters and for each centrality bin as the data has much better statistics. Then we use those parameters to rescale the distributions.
Fig. 4 shows the rescaled version of the transverse mass spectra for all centralities. The data points for all centralities are now lying on top of each other, i.e. scaling works reasonably well also for the centrality dependence of the -spectra. Accordingly, also the charged particle spectra then can be rescaled for each centrality cut. There seem to be deviations from scaling at large in Fig. 4 as that the more central bins are suppressed relative to the peripheral ones. But within the error bars it is difficult to make a more definite conclusion. We see a similar trend at high for the rescaled charged particle spectra, but again within the error bars it is hard to draw a conclusion.
One expects that rescales as a product of the transverse area times a logarithmic function of the centrality. Similarly, one expects to scale as the cube root of the centrality. In the following we will check, if this is the case.
A Scaling of the Transverse Area
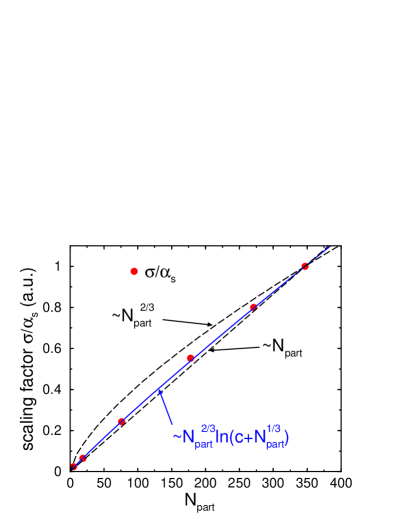
The fitted scaling factor for the different centrality bins are plotted in Fig. 5 versus the number of participants . We take the number of participants as reported by the PHENIX collaboration in [31] for their centrality cuts. The scaling factors are given relative to the one for the most central bin at .
One sees from the figure, that the fitted scaling factors seems to have a more linear dependence on than to follow the curve for a transverse area . Nevertheless, there is a correction factor coming from . The quantity is taken as and the saturation momentum is dependent on the number of participants [2]. The factor induces then a logarithmic correction to the scaling factor. The scaling factor should then follow a curve proportional to the transverse area divided by which is of the form . For consistency, the argument of the logarithm is taken from the dependence of on as will be discussed in the next section. The dependence of with has been fitted to be (see figure 6) and is the momentum scale for the most central bin. The dependence of with is then of the form where is the ratio of and and adjusted to be 0.6. The corresponding curve is shown in Fig. 5 by the solid line and now follows very closely the extracted values for the scaling factor.
B Scaling of the Transverse Momentum
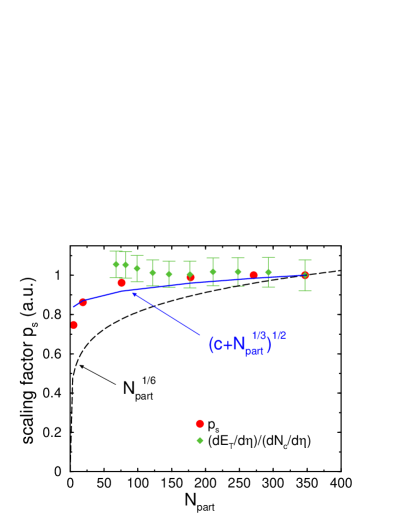
The second scaling factor, , as extracted from the data is shown in Fig. 6. Again, the factors are normalized to the one for the most central bin. The centrality dependence of is quite weak for moderate to large number of participants but falls off for peripheral collisions. The fitted values of are compared with the expected behavior for the saturation momentum in the figure. It is seen, that changes less rapidly with centrality than . The reason is that the gluon densities at hand are still too small to reach this behavior fully. Fits of the form describe the centrality dependence of much better (see figure and the previous discussion in section III A). Hence, as increases it appears to be tending towards the scaling with .
Let us compare to the mean transverse momentum defined by
| (7) |
where is the vacuum mass of the identified hadron and is some function of the ratio of the hadron mass and the scaling momentum. The momentum is proportional to the mean . In the limit one should recover the mean and its corresponding momentum of collisions. The constant seen in the fit of with then stands for that finite mean (or ) already present in collisions. Note, that is not directly identical with the mean but differs by the factor . As this factor depends on the vacuum mass of the hadron, the mean for each hadron follows a different behavior with centrality which depends on the ratio of its vacuum mass to the momentum in a nontrivial way.
The weak centrality dependence of is compatible with the small change of the mean with seen at RHIC [19, 32]. The mean for charged particles measured in collisions at GeV has been measured by the UA1 collaboration to be MeV [33]. The energy dependence of the mean for collisions is known to be quite weak. STAR reports preliminarily that MeV for central AuAu collisions at GeV [22, 32]. So, the ratio of mean squared for to the value for central AuAu collisions, i.e. the value for at , is calculated to be 0.60 which is in agreement with the results of Fig. 6.
The centrality dependence for can be compared to the measured transverse energy per charged particle by the PHENIX collaboration [34] which is approximately proportional to the mean transverse momentum. The data points are flat from the most central bin down to . The extracted values for in Fig. 6 follow closely this constant dependence on centrality for these values of .
C Multiplicity
We can cross-check our scaling relations by computing the centrality dependence of the charged multiplicity. Integrating eq. (2) over the transverse mass gives the multiplicity
| (8) |
The dependence of the multiplicity on the scaling factors is analogous to the multiplicity dependence of initially produced gluons in the CGC (see e.g. [2] and references therein):
| (9) |
except for the last factor which takes into account normalization effects associated with different species of particles. These are small corrections to these formula, as e.g. the kaon spectra is lying about a factor two below the universal curve in (see our discussion of Fig. 4). Neglecting the dependence of the shift from rapidity to pseudo-rapidity on centrality, the charged multiplicity density reads
| (10) |
If we take the universal function to be a power law in the transverse mass:
| (11) |
then it can be analytically integrated to get
| (12) |
Indeed, one can perform a power law fit to the transverse mass spectra of the preliminary PHENIX data of the most central bin of Fig. 4 with and GeV. We can now compute the charged multiplicity from the two scaling factors and the power law function for the most central bin.
Quantitatively, the factor grows approximately like (see Fig. 5) and grows like (see Fig. 6), so that finally we recover
| (13) |
This form is the one expected from the high density QCD approach with a nearly constant contribution from soft scatterings and a term growing with [2]. It can be motivated by noting that at large it has a form consistent with our expectations concerning saturation. At low , the constant gets important reflecting non-perturbative physics, perhaps associated with a vacuum gluon condensate [35, 36]. That the dependence of the charged multiplicity on comes out correctly is nontrivial. The multiplicity of particles is dominated by the contributions from small where it is possible to have deviations from the universal function due to resonance decays. As it turns out this does not seem to be the case qualitatively.
IV Transverse Momentum Broadening Revisited
The eqs. (7) and (10) give a relation between the mean transverse momentum and the charged multiplicity:
| (14) |
Except for the factor , this is the relation as studied in [1]. The mean momentum squared increases as the charged multiplicity per transverse area. This has been found to be in good agreement with the data from the Tevatron and the heavy-ion data from the SPS [1]. We expect a similar behavior at RHIC from scaling arguments. Compared to the previous work [1], we are now in the position to explain in more detail the effects of broadening, i.e. that the mean rises more rapidly for more massive particles compared to the purely kinematic behavior as seen in collisions at the Tevatron [37, 38, 39]. The mass dependent factor gives a different steepness in the increase of mean squared for different hadrons, so that pions, kaons and nucleons have a different slope. As increases with hadron mass , the slope will be larger for more massive particles. If the function is of exponential form, , then the mean is given by
| (15) |
For heavy particles, , one gets which is besides a small correction factor just the purely kinematic factor for non-relativistic particles.
We show in Fig. 6 as a function of centrality the PHENIX data on the transverse energy per charged particle [34]. The data has large systematic errors, and taken alone would provide no evidence of broadening. The errors on this data nevertheless allow for consistency with the data on identified particle spectra. The STAR data on mean for charged particles shows a centrality dependence which appears consistent with our analysis [22, 32].
Acknowledgements.
We thank Barbara Jacak, Julia Velkovska, and Nu Xu for many helpful discussions. J.S.B. acknowledges RIKEN, BNL, and the U.S. Department of Energy for providing the facilities essential for the completion of this work. This manuscript has been authorized with the U.S. Department of Energy under Contract No. DE-AC02-98CH10886 and No. DE-FG-02-93ER-40764.REFERENCES
- [1] L. McLerran and J. Schaffner-Bielich, Phys. Lett. B 514, 29 (2001).
- [2] D. Kharzeev and M. Nardi, Phys. Lett. B 507, 121 (2001); D. Kharzeev and E. Levin, nucl-th/0108006 (2001); D. Kharzeev, E. Levin, M. Nardi, hep-ph/0111315 (2001).
- [3] L. V. Gribov, E. M. Levin, and M. G. Ryskin, Phys. Rep. 100, 1 (1983).
- [4] A. H. Mueller and J. W. Qiu, Nucl. Phys. B 268, 427 (1986).
- [5] J. P. Blaizot and A. H. Mueller, Nucl. Phys. B 289, 847 (1987).
- [6] L. McLerran and R. Venugopalan, Phys. Rev. D 49, 2233 (1994); ibid. 3352 (1994); ibid. 50, 2225 (1994).
- [7] Y. V. Kovchegov, Phys. Rev. D 54, 5463 (1996).
- [8] J. Jalilian-Marian, A. Kovner, L. McLerran, and H. Weigert, Phys. Rev. D 55, 5414 (1997); J. Jalilian-Marian, A. Kovner, A. Leonidov, and H. Weigert, Nucl. Phys. B 504, 415 (1997); Phys. Rev. D 59, 014014 (1999).
- [9] E. Iancu, A. Leonidov, and L. McLerran, Nucl. Phys. A 692, 583 (2001).
- [10] A. Kovner, L. McLerran, and H. Weigert, Phys. Rev. D 52, 6231 (1995); ibid. 3809 (1995).
- [11] A. Krasnitz and R. Venugopalan, Phys. Rev. Lett. 86, 1717 (2001); ibid., 84, 4309 (2000); Nucl. Phys. B 557, 237 (1999); W. Pöschl and B. Müller, Comput. Phys. Commun. 125, 282 (2000).
- [12] L. McLerran and R. Venugopalan, Phys. Rev. D 59, 094002 (1999).
- [13] Y. V. Kovchegov and L. McLerran, Phys. Rev. D 60, 054025 (1999) [Erratum: ibid. 62, 019901 (1999)].
- [14] F. Gelis and A. Peshier, Nucl. Phys. A 697, 879 (2002); hep-ph/0111227 (2001).
- [15] Y. V. Kovchegov and A. H. Mueller, Nucl. Phys. B 529, 451 (1998).
- [16] A. Dumitru and L. McLerran, hep-ph/0105268 (2001).
- [17] M. A. Braun, F. Del Moral and C. Pajares, Phys. Rev. C 65, 024907 (2002).
- [18] K. Adcox et al. [PHENIX Collaboration], Nucl. Phys. A 698, 39 (2002).
- [19] J. Velkovska [PHENIX collaboration], Nucl. Phys. A 698, 507 (2002) and private communication.
- [20] G. David [PHENIX collaboration], talk presented at Quark Matter 2001, January 15-20, 2001, Stony Brook, New York (see http://www.rhic.bnl.gov/qm2001), Nucl. Phys. A 698, 227 (2002) and private communication.
- [21] PHENIX Collaboration (K. Adcox et al.), nucl-ex/0112006 (2001).
- [22] C. Adler et al. [STAR collaboration], Nucl. Phys. A 698, 64 (2002); M. Calderon de la Barca Sanchez [STAR Collaboration], ibid., 503 (2002).
- [23] C. Adler et al. [STAR Collaboration], Phys. Rev. Lett. 87, 262302 (2001); C. Roy [STAR Collaboration], nucl-ex/0111017 (2001); R. Snellings [STAR Collaboration], hep-ph/0111437 (2001); R. Bellwied [STAR collaboration], hep-ph/0112250 (2001).
- [24] R. Hagedorn, Nuovo Cim. Suppl. 3 (1965) 147; ibid. 6, 169 (1968).
- [25] T. Csörgő and B. Lörstad, Phys. Rev. C 54, 1390 (1996); R. Scheibl and U. Heinz, Phys. Rev. C 59, 1585 (1999).
- [26] P. Huovinen, P. F. Kolb, U. Heinz, P. V. Ruuskanen and S. A. Voloshin, Phys. Lett. B 503, 58 (2001).
- [27] D. K. Srivastava, Phys. Rev. C 64, 064901 (2001).
- [28] D. Teaney, J. Lauret and E. V. Shuryak, nucl-th/0110037 (2001).
- [29] K. S. Lee, U. Heinz and E. Schnedermann, Z. Phys. C 48, 525 (1990).
- [30] Nu Xu, unpublished notes (1996) and private communication.
- [31] K. Adcox et al. [PHENIX Collaboration], Phys. Rev. Lett. 86, 3500 (2001).
- [32] Zhangbu Xu [STAR collaboration], talk given at the RHIC/INT workshop on Ultra-relativistic Heavy Ion Collisions in the RHIC era, May 31 - June 2, 2001, Lawrence Berkeley National Laboratory, Berkeley, California (see http://www-nsdth.lbl.gov/rhic-int-2001/talks/Xu.pdf).
- [33] C. Albajar et al. [UA1 Collaboration], Nucl. Phys. B 335, 261 (1990).
- [34] K. Adcox et al. [PHENIX Collaboration], Phys. Rev. Lett. 87, 052301 (2001); Alexander Bazilevsky, private communication.
- [35] D. Kharzeev and E. Levin, Nucl. Phys. B 578, 351 (2000).
- [36] D. E. Kharzeev, Y. V. Kovchegov and E. Levin, Nucl. Phys. A 690, 621 (2001); hep-ph/0106248 (2001); M. A. Nowak, E. V. Shuryak and I. Zahed, Phys. Rev. D 64, 034008 (2001).
- [37] T. Alexopoulos et al. [E735 collaboration], Phys. Rev. Lett. 60, 1622 (1988).
- [38] T. Alexopoulos et al. [E735 collaboration], Phys. Rev. Lett. 64, 991 (1990).
- [39] T. Alexopoulos et al. [E735 collaboration], Phys. Rev. D 48, 984 (1993).