Chemical freeze-out parameters at RHIC from microscopic model calculations
Abstract
The relaxation of hot nuclear matter to an equilibrated state in the central zone of heavy-ion collisions at energies from AGS to RHIC is studied within the microscopic UrQMD model. It is found that the system reaches the (quasi)equilibrium stage for the period of 10-15 fm/. Within this time the matter in the cell expands nearly isentropically with the entropy to baryon ratio . Thermodynamic characteristics of the system at AGS and at SPS energies at the endpoints of this stage are very close to the parameters of chemical and thermal freeze-out extracted from the thermal fit to experimental data. Predictions are made for the full RHIC energy AGeV. The formation of a resonance-rich state at RHIC energies is discussed.
Thermalization and chemical equilibration of hot and dense nuclear matter produced in ultrarelativistic heavy-ion collisions is a topic of great importance for the interpretation of current SPS and RHIC results. In our investigation we study the relaxation process in central Au+Au collisions at AGeV within the microscopic transport UrQMD model [3]. Earlier studies at AGS and SPS energies revealed that the central reaction volume defined by a cubic cell of volume fm3 is well suited for this kind of study [4]. It contains enough particles to be treated as a statistical system, and its macroscopic characteristics become isotropic after some time. Figure 2 depicts the velocity distributions of hadrons in the cell in transverse ( and ) and in longitudinal () directions. At fm/ the longitudinal velocity distribution differs considerably from the distributions in the transverse plane, while at fm/ the magnitudes and widths of all three distributions become very close to each other. Isotropy of the velocity distributions results in the isotropy of pressure in the cell. Pressure in longitudinal and in transverse direction is shown in Fig. 2(a) for AGS, SPS, and RHIC energies. It is widely believed that the thermalization at RHIC sets in quite early. Indeed, at RHIC the pressure in the cell becomes isotropic at fm/ compared with fm/ (SPS) and fm/ (AGS). Starting from fm/ the results of the microscopic calculations are compared with the predictions of the statistical model (SM) of an ideal hadron gas [5]. The values of the energy density , baryon density , and strangeness density , determined microscopically, are used as an input to obtain particle yields, partial energy densities, pressure, and entropy density via the temperature , baryochemical potential , and strangeness chemical potential . As seen in Fig. 2(a), the microscopic pressure is very close to the grand canonical pressure after the onset of the (quasi)equilibrium stage.

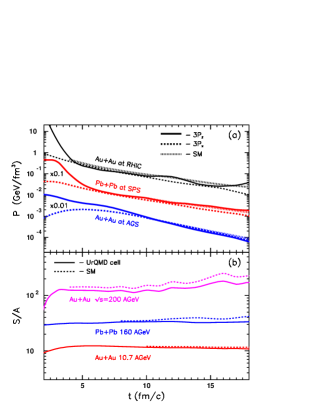
The entropy density per baryon , defined both microscopically and macroscopically (via the Gibbs thermodynamic identity ) is presented in Fig. 2(b). The expansion in the cell proceeds nearly isentropically with (AGS), 32 (SPS), and 150 (RHIC) (cf. (AGS) and (SPS) [6]). Therefore, it would be very interesting to compare the UrQMD estimate with the value extracted from the thermal model fit to RHIC experimental data.
The equation of state (EOS) in the -plane is shown in Fig. 4. For all three energies it can be well approximated by a simple linear dependence (AGS), and 0.15 (SPS and RHIC). Note, that this version of the model does not imply the formation of the quark-gluon plasma, therefore, there are no kinks in this plot that can be attributed to quark-hadron phase transition. The evolution of the EOS in the -plane is depicted in Fig. 4 together with the chemical freeze-out and the thermal freeze-out parameters obtained from a thermal fit to experimental data at AGS and SPS energies. One can see that temperatures and chemical potentials in the cells at the beginning and at the end of the equilibrated stage are close to the thermodynamic parameters of chemical and thermal freeze-out, respectively. The UrQMD predicts that at chemical freeze-out MeV and MeV, while at thermal freeze-out MeV and MeV, i.e., the evolution of nuclear matter in the cell proceeds at constant baryon chemical potential. Calculations show very weak (within few MeV) difference between the results for Au+Au at AGeV and at AGeV. A thermal fit to particle ratios measured by the STAR Collaboration (preliminary data) yields MeV and MeV [8], i.e. MeV, which is in remarkable agreement with the UrQMD calculations.


It is interesting to check the correspondence of the cell conditions at chemical freeze-out to the criterion GeV introduced in [6]. The mean energy
| time | ||||
|---|---|---|---|---|
| fm/ | GeV/fm3 | GeV | MeV | |
| AGS | 10 | 0.68 | 1.11 | 129 |
| AGS | 12 | 0.39 | 1.06 | 116 |
| SPS | 8 | 0.74 | 0.88 | 170 |
| SPS | 10 | 0.46 | 0.80 | 161 |
| RHIC | 5 | 2.33 | 1.08 | 201 |
| RHIC | 6 | 1.70 | 1.01 | 193 |
per particle at the beginning of the equilibration in the cell at AGS, SPS, and RHIC energies is listed in Table 1. With rising bombarding energy from AGS to SPS there is a transition from baryon to meson dominated matter. It leads to the drop of from nucleon mass to mass of meson in accord with [6]. With further increase of the freeze-out temperature the yields of heavy meson resonances rise faster than that of light mesons, thus leading to the rise of with .
This means that not only the temperature, but also the mean mass of a particle is increased in the cell at RHIC energies, i.e., there should be more heavy resonances compared with the SPS cell. Therefore, the ratios of hadronic abundances are studied (see Fig. 5). Here the results are presented separately for non-strange and strange baryons and mesons. In the baryon sector the resonances dominate over the strange and non-strange baryons until the end of the simulations. This can be taken as an indication of the creation of long-lived resonance-rich matter. The fraction of baryon resonances is almost 70% of all baryons in the cell at RHIC at fm/, while at SPS and AGS the number of baryon resonances decreases from 70% to 35%, and from 60% to 25%, respectively. The meson fractions of resonances shrink within the time interval fm/ from 60% to 30% (RHIC), 50% to 20% (SPS), and 40% to 15% (AGS). But at RHIC energies the

hot hadronic matter in the cell as well as in the whole volume of the reaction is meson dominated. The mesons, baryons, and antibaryons carry 90%, 7%, and 3% of the total number of particles in the RHIC cell at fm/ (cf. 85%, 14.5%, 0.5% at SPS and 50%, 50%, 0% at AGS). The microscopic ratios for mesons (Fig. 5, right panels) seem to be very close to the SM ratios. Since the freeze-out occurs at fm/ in the central cell at RHIC energies, the matter in the cell is frozen before reaching complete chemical equilibrium. This circumstance complicates the extraction of the chemical and thermal freeze-out parameters by means of the standard thermal model fit.
The rapidity distributions of baryon resonances in Au+Au collisions at AGeV are found to be nearly flat in the rapidity interval [7]. More than 80% of the baryon non-strange resonances are still ’s (1232). The density of directly reconstructible baryon resonances, that decay into final state hadrons, per unit rapidity at RHIC is quite high, and the resonance rich matter can be detected experimentally.
The results of our study can be summarised as follows. The formation of long lived resonance-abundant matter is found. UrQMD predicts that MeV, MeV, , and GeV at chemical freeze-out in central Au+Au collisions at RHIC. The equation of state has a linear dependence . The UrQMD cell calculations show that strangeness to entropy ratio monotonically increases with rising as (AGS), 0.04 (SPS), and 0.05 (RHIC).
References
- [1]
- [2]
- [3] S.A. Bass et al., Prog. Part. Nucl. Phys. 41 (1998) 255; M. Bleicher et al., J. Phys. G 25 (1999) 1859.
- [4] L.V. Bravina et al., Phys. Lett. B 434 (1998) 379; J. Phys. G 25 (1999) 351; Phys. Rev. C 60 (1999) 024904; Nucl. Phys. A 661 (1999) 600c; Phys. Rev. C 62 (2000) 064906.
- [5] M. Belkacem et al., Phys. Rev. C 58 (1998) 1727.
- [6] J. Cleymans and K. Redlich, Phys. Rev. C 60 (1999) 054908.
- [7] L.V. Bravina et al., J. Phys. G 27 (2001) 421; nucl-th/0010172 (Phys. Rev. C, in press).
- [8] N. Xu, STAR Collaboration, these proceedings.
- [9]