Equation of state and phase transitions in asymmetric nuclear matter
Abstract
The structure of the 3-dimension pressure-temperature-asymmetry surface of equilibrium of the asymmetric nuclear matter is studied within the thermal Thomas-Fermi approximation. Special attention is paid to the difference of the asymmetry parameter between the boiling sheet and that of the condensation sheet of the surface of equilibrium. We derive the condition of existence of the regime of retrograde condensation at the boiling of the asymmetric nuclear matter. We have performed calculations of the caloric curves in the case of isobaric heating. We have shown the presence of the plateau region in caloric curves at the isobaric heating of the asymmetric nuclear matter. The shape of the caloric curve depends on the pressure and is sensitive to the value of the asymmetry parameter. We point out that the experimental value of the plateau temperature corresponds to the pressure at the isobaric boiling.
pacs:
PACS numbers: 21.65.+f, 24.10.PaI Introduction
At zero temperature, , a saturated nuclear matter is stable at vanishing pressure . As the temperature increases, the equilibrium state is derived through the isotherm (equation of state) , where is the particle density. In general, there are two different regimes of the equilibrium state, see Ref. [1], Ch. 9. If the evaporation time is large enough and the evaporated particles are carried away from the heated liquid, the equilibrium condition is given by , i.e., it has the same form as at . By increasing the temperature one can reach the so-called phase separation temperature [2, 3, 4] above which the equilibrium condition is not satisfied anymore. This happens if the minimum of the isotherm is shifted on the -axis and it is located at . The temperature is then the limiting one for the existence of a stable state of the liquid phase under the equilibrium condition . In another regime, the heated liquid is surrounded by the saturated vapor. The equilibrium condition requires then that the pressure, , and the chemical potential, , of the liquid phase should be equal to the corresponding ones, and , for the saturated vapor, see Ref. [1], Ch. 8. (Here and below indices “” and “” denote the liquid and vapor phases, respectively.) In this regime, as the temperature increases, the liquid becomes unstable with respect to the phase transition (boiling) and the corresponding boiling temperature is the limiting one for the heating of the nuclear liquid.
The limiting temperatures and the critical behavior of the symmetric nuclear matter have been intensively investigated using an effective interaction and finite temperature selfconsistent mean-field theory [4, 5, 6, 7]. The thermal properties of asymmetric nuclear matter have been considered in Refs. [2, 3, 4, 8, 9, 10, 11, 12, 13]. In general, the two-component liquid and its saturated vapor co-exist with different asymmetry parameter because of the -dependence of the symmetry energy. The equilibrium state of the two phases of a two-component system is described by the 3-dimension surface of equilibrium in variables and , see Ref. [1], Chs. 8 and 9. The evaluation of the ()-surfaces of equilibrium and the analysis of the boiling regime for an asymmetric nuclear matter is a main goal of the present paper. We also study the properties of the caloric curve in the two regimes described above.
II Equation of state of hot nuclear matter
We will follow the temperature dependent Thomas-Fermi approximation using the Skyrme-type force as the effective nucleon-nucleon interaction. The energy density, , and the entropy density, , are given by [14]
| (1) |
| (2) |
where , and are the Skyrme force parameters, is the isospin index ( for neutron and for proton), is the nucleon density and . The Fermi integral in Eqs. (1) and (2) depends on the fugacity . The value of can be found from the condition
| (3) |
Here, and is the effective nucleon mass derived by
| (4) |
Using Eqs. (1) and (2) one can derive the free energy density . Finally one obtains the pressure (equation of state) and the chemical potentials . Namely,
| (5) |
where the asymmetry parameter is defined as . A numerical calculation of the pressure with the energy density from Eq. (1) leads to the van der Waals-like isotherms , describing both the liquid and the vapor phases [6, 8, 9, 10]. According to Gibbs’s phase rule, the equilibrium states of the two-phases (liquid + vapor) and the two-components (neutrons+protons) system are located on the 3-dimensional surface in the (, , ) space. To obtain the shape of the (, , )-surface of equilibrium one should use the Gibbs equilibrium conditions [1]:
| (6) |
We will imply that the nuclear matter is a bound system of nucleons assuming that the following additional condition is also satisfied.
III Surfaces of equilibrium
We have performed calculations of the surfaces of equilibrium in (, , ) space using the SkM force [14] with the parameters MeVfm3, MeVfm5, MeVfm5, MeVfm3+3σ, , and , adopted for the ground state of nuclei. We point out that the use of the Skyrme force from the ground-state calculations is a quite reasonable approximation for our purposes. The effective interaction is modified only by a few per cent in a wide temperature region from 0 to 20 MeV [15, 16]. The numerical procedure we used starts from certain values of , and looks for , and which satisfy the equilibrium conditions (6).
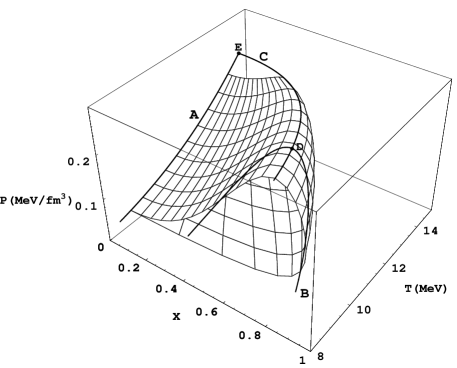
The section of the equilibrium surface calculated by our code is shown in Fig. 1. This figure represents the equilibrium states having , i.e. states of the neutron-rich nuclear matter. We point out that there are two sheets of the surface of equilibrium. The upper sheet is the surface of boiling and the lower one is the surface of condensation. The interior space between sheets is the phase separation region where the two phases co-exist. The crossing points of both sheets with a straight line , , give the equilibrium asymmetry parameters and for liquid and vapor phases, respectively. In general the asymmetry parameters and are different. The vapor asymmetry exceeds the corresponding liquid one (at ). This is a feature of the nuclear matter. The density dependence of the isospin symmetry energy (see Eq. (1)) provides the condition and the preferable emission of neutrons.
The above mentioned sheets of the surface of equilibrium coincide along the azeotropic ()-line in plane denoted by letter A in Fig. 1. The azeotropic line is cut off at the critical temperature MeV (point E) of the symmetric nuclear matter derived by the condition [1]
| (7) |
Both sheets of the surface of equilibrium also coincide along the critical line marked by letter C in Fig. 1. The critical line of an asymmetric nuclear matter is derived by the condition, see Ref. [1], Ch. 9,
| (8) |
We point out that the critical temperature derived by Eq. (8) at is different from the one, , obtained from Eq. (7). If one goes along the critical line C, the critical temperature decreases and the corresponding pressure increases as the value of increases.
The line B in Fig. 1 is the line with . The crossing point of the critical line C with the line B (point D in Fig. 1) provides the maximum possible asymmetry for the bound () liquid phase. This point is located at , MeV and MeV/fm3 for the SkM interaction. Note that the cold nuclear matter at is bound at . Thus, the hot nuclear matter can exist (in the bound state) at higher asymmetry than the cold one. This feature of hot nuclear matter appears because of the increasing of the symmetry energy with temperature.
IV Boiling and caloric curves
Let us consider the isobaric () phase diagrams obtained as the cut of the equilibrium surface of Fig. 1 by plane . These diagrams are very useful for obtaining an insight into the liquid-vapor phase transition in hot asymmetric nuclear matter. The shape of ()-diagram depends on the value of the pressure . The ()-diagram contains the critical point if the value of pressure exceeds the critical (maximal allowed) pressure on the azeotropic line in Fig. 1. For the SkM force used here, the value of the critical pressure obtained from (7) is 0.2109 MeV/fm3. In the opposite case , the ()-diagram contains the point of equal concentration . In Figs. 2 and 3 we have plotted the ()-diagrams at the pressures 0.15 MeV/fm3 and 0.25 MeV/fm3, respectively. In each diagram we have two lines. The lower line (on the left) is the line of boiling and the upper line (on the right) is the line of condensation. In Fig. 2, these lines meet at the point of equal concentration () and in Fig. 3, they meet at the critical point . The space between the boiling and condensation lines corresponds to the states of co-existing phases.

Let us consider the boiling of the asymmetric nuclear matter at the fixed external pressure , see Fig. 2. With the increase of temperature at a certain asymmetry parameter , the asymmetric nuclear matter begins to boil at temperature on the line of boiling (point A in Fig. 2). The boiling process is accompanied by the preferable evaporation of neutrons because of the condition . The liquid phase is then shifted to a more symmetric state and the boiling temperature increases due to the evaporation of the less-bound particles. The final state of system depends on the regime of heating. In regime I we assume that the liquid is evaporated in a free space and the vapor is taken away, the system moves along the surface of equilibrium to the point F, i.e., reaches the symmetric state at on the azeotropic line. The boiling is finished then at fixed and . The asymmetry of the vapor, , decreases with increasing and disappears at . This means, for instance, that the yield of symmetric clusters at the condensation of the vapor phase has to grow with . In regime II we assume that the vapor remains near the liquid (at fixed pressure , this means an evaporation into a closed but not a fixed volume) the system moves along the boiling line and reaches the point D in Fig. 2. The point D corresponds to a fully evaporated liquid at asymmetry of the vapor (point C on the surface of condensation) that equals to the starting asymmetry of the liquid phase. We point out that, in general, the trajectory of motion of the liquid phase along the surface of equilibrium can be located beyond the plane and Fig. 2 should be considered as a formal illustration of the behavior of the heating system for the regime II where both points A and D are taken at different pressures. An analogous analysis of the boiling of the asymmetric nuclear matter can also be done in the case of , see Fig. 3. However the presence of the critical point on the () phase diagrams in Fig. 3 leads to a very specific effect of the retrograde condensation, see also Refs. [1, 12]. If one goes along straight line AB in Fig. 3 (at closed volume), the liquid starts to boil at temperature . An increase of the temperature leads to an increase of the evaporation. However the evaporation begins to decrease at certain temperature and the vapor disappears at temperature .

The () phase diagrams allow us to study the shape of the caloric curve for the case of isobaric heating. We will consider the case of the evaporation in a closed (but not fixed) volume at the fixed pressure , i.e., regime II in Fig. 2. Let us introduce the volume fractions and of the liquid and vapor phases defined by and , where and are the volumes of the liquid and vapor phases, respectively, and . The excitation energy per particle, , is given by
| (9) |
where and are, respectively, the energy densities of the liquid and vapor phases, derived by Eq. (1) and taken at the corresponding values of the particle density and the asymmetry parameter . Let us consider a certain asymmetry parameter . To calculate the excitation energy we note that , , and if is below the boiling line and , and if is above the condensation line in the () phase diagram of Fig. 2. In the case of co-existing phases (space between lines of the boiling and the condensation in Fig. 2) the required values of , , , , and can be found using the following procedure. At given , we go along the straight line in both directions and get the cross points with the boiling and condensation lines which provide the asymmetry parameters and and the densities and for both phases. The volume fractions and are then determined by the following equations
| (10) |
Caloric curves determined by Eq. (9) for and pressures MeV/fm3, MeV/fm3 and MeV/fm3 are presented in Fig. 4. The solid line at low values of the excitation energy corresponds to the heating of the degenerate Fermi liquid with . The solid line at high excitation energy describes the classical Boltzmann’s gas with . The region of two phase co-existence is displayed by the dashed line. The caloric curve is a continuous function of and has a break in its derivative at two points connecting the two-phase region with the corresponding single-phase regions. As seen from Fig. 4, the plateau region corresponds to the two-phase region. A small increase of the dashed line with is due to the motion along the boiling path AD in Fig. 2. The value of the plateau temperature increases with the increase of pressure. Experimental observations show a nearly flat caloric curve with a temperature of about 7 MeV [17]. If one could assume the process of isobaric heating for the description of the experimental data, the order of magnitude of the pressure should be MeV/fm3 for this process. To obtain more accurate estimation an analysis of the contribution of both the surface and the Coulomb forces into the equilibrium condition (6) is needed [13, 18].

The asymmetry dependence of the shape of the caloric curve is displayed in Fig. 5 by plotting two curves at 0.1 and 0.3. The figure shows that the plateau temperature is slightly sensitive to the asymmetry parameter. At low asymmetry the two-phase region of the caloric curve is flatter and it is shifted to the lower values of as compared to the case of high asymmetry.

Figure 6 shows results of the calculation of the caloric curve assuming the regime I, i.e. the case when vapor is taken away from the liquid during the boiling. The calculation was carried out for the values of pressure 10-3, 10-2 and 10-1 MeV/fm3. The solid lines correspond to the heating of the liquid from to with asymmetry parameter . The regions where saturated vapor is present (but taken away) are displayed by dashed lines. It is seen from Fig. 6 that the value of the external pressure does not change the shape of the caloric curve calculated for regime I. Only the interval of is sensitive to the value of the pressure.

V Summary
Starting from the temperature dependent Thomas-Fermi approximation with the effective SkM force, we have evaluated the 3-dimensional () surface of equilibrium of the asymmetric nuclear matter. The () surface of equilibrium contains two sheets which correspond to the boiling and the condensation. Both sheets coincide along the azeotropic line and along the line of the critical pressure marked by C in Fig. 1. In general the vapor asymmetry on the surface of condensation exceeds significantly the corresponding liquid asymmetry (at ) lying on the surface of boiling. This is due to the fact that the isospin symmetry energy causes a preferable emission of neutrons. The surface of equilibrium is restricted by the drip line (line B in Fig. 1) where one has . The ( surface of equilibrium in Fig. 1 shows also that the hot nuclear matter exists (in a bound state) at higher asymmetry than the cold one due to the increase of the symmetry energy with temperature.
Our analysis of the isobaric () phase diagrams (see Figs. 2 and 3) shows that the process of isobaric boiling of the asymmetric nuclear matter depends on the value of the fixed pressure . In the case of low enough pressure 0.2109 MeV/fm3 the ()-diagram contains the point of equal concentration and the process of boiling is accompanied by a decrease of the vapor asymmetry with increasing temperature . In the case of high pressure , the process of boiling leads to the very specific effect of a retrograde condensation with growing temperature , see Fig. 3.
We have shown in Figs. 4 and 5 that the caloric curve for the process of isobaric heating of the asymmetric nuclear matter contains a plateau region where both the liquid and the saturated vapor phases co-exist. The position of the plateau region on the caloric curve depends on the pressure and is almost insensitive to a change in the asymmetry parameter . As can be seen from Fig. 5, the shape of the caloric curve is significantly changed with asymmetry. At low asymmetry the two-phase region of the caloric curve is flatter. We pointed out that the experimental observation of the saturation of the caloric curve at temperature of about 7 MeV is obtained in our approach as an isobaric boiling of the nuclear liquid at the pressure MeV/fm3. Note, however, that the effects of nuclear surface and Coulomb interaction are not included in our study. The asymmetry parameter of the vapor phase decreases along the boiling path of the caloric curve (dashed line in Figs. 4 and 5). Thus, the present model predicts an increase of the yield of the symmetric clusters at the condensation of the vapor phase with an increase of the excitation energy in the plateau region of the caloric curve.
Acknowledgements
This work was supported in part by the US Department of Energy under grant # FG03-93ER40773. We are grateful for this financial support. One of us (V.M.K.) thank the Cyclotron Institute at Texas A&M University for the kind hospitality.
REFERENCES
- [1] L. D. Landau and E. M. Lifshitz, Statistical Physics (Pergamon, Oxford, 1958).
- [2] M. Abd-Alla, S. Ramadan and M. Y. Hassan, Phys. Rev. C 36, 1565 (1987).
- [3] D. Bandyopadhyay, J. N. De, S. K. Samaddar and D. Sperber, Phys. Lett. B218, 391 (1989).
- [4] D. Bandyopadhyay, C. Samanta, S. K. Samaddar and J. N. De, Nucl. Phys. A511, 1 (1990).
- [5] W. A. Küpper, G. Wegmann and E. R. Hilf, Ann. of Phys. 88, 454 (1974).
- [6] G. Sauer, H. Chandra and U. Mosel, Nucl. Phys. A264, 221 (1976).
- [7] H. Jaqamann, A. Z. Mekjian and L. Zamick, Phys. Rev. C 27, 2782 (1983).
- [8] J. M. Lattimer and D. G. Ravenhall, Astro. Phys. J. 223, 314 (1978).
- [9] D. Q. Lamb, J. M. Lattimer, C. J. Pethick and D. G. Ravenhall, Nucl. Phys. A360, 459 (1981).
- [10] J. M. Lattimer, C. J. Pethick, D. G. Ravenhall and D. Q. Lamb, Nucl. Phys. A432, 646 (1985).
- [11] M. Barranco and J. R. Buchler, Phys. Rev. C 22, 1729 (1980).
- [12] H. Müller and B. Serot, Phys. Rev. C 52, 2072 (1995).
- [13] S. J. Lee and A. Z. Mekjian, Phys. Rev. C 63, 044605 (2001)
- [14] M. Brack, C. Guet and H.-B. Håkansson, Phys. Rep. 123, 275 (1985).
- [15] A. Lejeune, P. Grange, M. Martzolf and J. Cugnon, Nucl. Phys. A453, 189 (1986).
- [16] J. Cugnon, A. Lejeune, M. Baldo and U. Lombardo, Nucl. Phys. A492, 173 (1989).
- [17] J. Cibor et al, Phys. Lett. B473, 29 (2000).
- [18] S. Levit and P. Bonche, Nucl. Phys. A437, 426 (1985).