The three-dimensional Ising model: A paradigm of liquid-vapor coexistence in nuclear multifragmentation
Abstract
Clusters in the three-dimensional Ising model rigorously obey reducibility and thermal scaling up to the critical temperature. The barriers extracted from Arrhenius plots depend on the cluster size as where is a critical exponent relating the cluster size to the cluster surface. All the Arrhenius plots collapse into a single Fisher-like scaling function indicating liquid-vapor-like phase coexistence and the univariant equilibrium between percolating clusters and finite clusters. The compelling similarity with nuclear multifragmentation is discussed.
Nuclear multifragmentation is a process occurring at the limits of nuclear excitation, and, as such, portrays an appropriate richness and complexity. While the fundamental problem of dynamics vs. statistics is still debated, it appears ever more clearly that many thermal/statistical features underlie the empirical body of data. In particular, two features associated with the fragment multiplicities are found to be quite pervasive in all multifragmentation reactions. They have been named “reducibility” and “thermal scaling” [1, 2, 3].
Reducibility is the property of the -fragment emission probability of being expressible in terms of an elementary one-fragment emission probability. This property can occur only if fragments are created independently from one another and it coincides with stochasticity. Both binomial, and its limiting form, Poissonian reducibilities have been extensively documented experimentally [1, 2, 3].
Thermal scaling is the linear dependence of the logarithm of the one-fragment probability with (an Arrhenius plot). It indicates that the emission probability for fragment type has a Boltzmann dependence
| (1) |
where is a barrier corresponding to the emission process.
The combination of these two empirical features powerfully attests to a statistical mechanism of multifragmentation in general, and to liquid-vapor coexistence specifically [4].
Many statistical models have been proposed as an explanation for multifragmentation. It is our intention here to identify a model which, on one hand, is as simple as possible, yet on the other captures the essential features observed in the experiments. Percolation in its many versions has been widely used [5, 6, 7, 8]. However, while being simple, it does not lend itself to a non-trivial thermal study [9]. The three-dimensional Ising model satisfies both the criteria of simplicity in its Hamiltonian and lends itself to a thermal treatment with nontrivial results. While the Ising model has been widely studied in terms of its continuous phase transition, the problem of clusterization, of paramount interest to us here, has received relatively little attention [10, 11, 12, 13, 14, 15, 16, 17, 18, 19]. We will show that this model contains both features of reducibility and thermal scaling. In showing the features of thermal scaling we will demonstrate that the slopes of the Arrhenius plots associated with the individual masses of the fragments, or the barriers in Eq. (1), portray a dependence on the fragment mass () of the form , where is a proper critical exponent which relates the mass to the cluster surface. In addition, the individual Arrhenius plots for each fragment mass can be absorbed into a single scaling function identical to that of Fisher’s droplet model [21, 22, 23, 24, 25], which defines the liquid-vapor coexistence line up to the critical temperature.
The Hamiltonian of the Ising model has two terms: the interaction between nearest neighbor () spins in a fixed lattice and the interaction between the fixed spins and an external applied field :
| (2) |
where is the strength of the spin-spin interaction. In this model, the two phases of the system are a liquid (clusters of sites with connected up spins) and a gas (clusters of sites with connected down spins). In the absence of an external field, the distinction between up and down spins vanishes. Thus in the absence of an external field, these two phases are in coexistence below the critical temperature, . The critical temperature for the three-dimensional Ising model has not been determined analytically; however, Monte Carlo techniques have yielded a value of [13].
In the present study, Monte Carlo techniques are used to determine the equilibrium cluster distribution as a function of temperature for a simple cubic lattice with periodic boundary conditions. The lattice contains spins, which is large but may not be large enough to represent an infinite system. The Swendsen-Wang algorithm [16] was used to determine the equilibrium spin configurations of the lattice for given temperatures, and clusters were identified using the Coniglio-Klein [12] prescription. Details about the model can be found in reference [20].
To test if the fragment distributions produced by the model exhibit binomial or Poissonian characteristics, the ratio of the variance to the mean () of the fragment distributions () for various fragment sizes () as a function of temperature was determined. For most clusters, the ratio is very close to one, which is the Poissonian limit, over the entire temperature range considered here, which extends well beyond the critical temperature. Only for the very lightest clusters (), does the ratio have a discontinuity at the critical temperature. However, the ratio is near one even for these light clusters at all temperatures away from the critical temperature. (See Fig. 1.) Thus, for all but the smallest clusters, the distributions exhibit Poissonian reducibility.
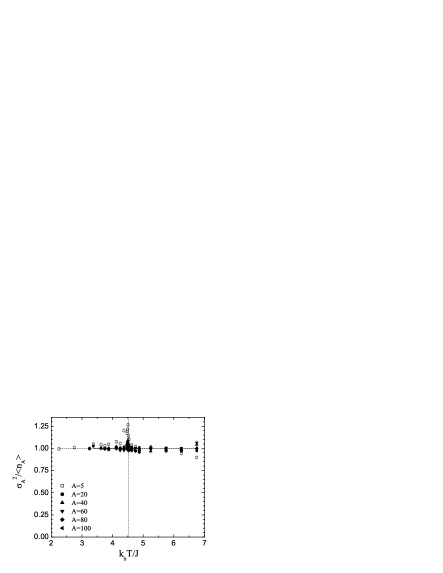
This signifies that the clusters are produced nearly independently of one another, a feature also observed in percolation models, Fisher’s droplet model and nuclear fragmentation [4].
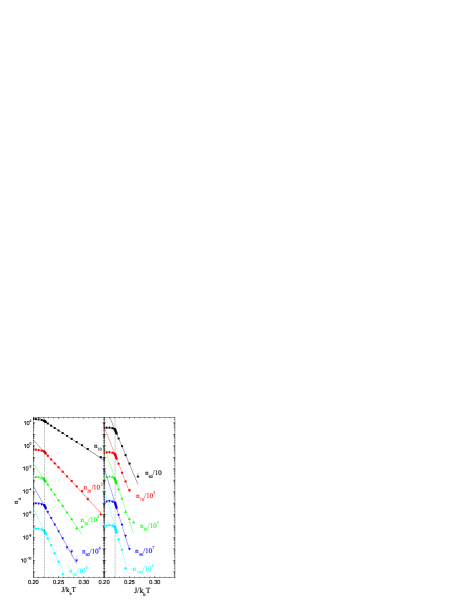
If the fragment distributions also exhibit thermal reducibility, the distributions must be of the form given in Eq. (1). Thus in an Arrhenius plot (a semi-log graph of the number of clusters of size () vs. ), the distributions should be linear below the critical temperature.
As shown in Fig. 2, this is indeed the case over a wide range of temperatures () and fragment sizes. While we have shown distributions for clusters up to size , the trend continues for larger clusters, however statistics decrease significantly as the size of the cluster increases. This linearity extends over more than four or five orders of magnitude. It rigorously confirms the form of Eq. (1) and signifies the independent thermal formation of fragments controlled by a single size-dependent barrier. This feature has been amply verified in nuclear multifragmentation. By fitting the fragment distributions below the critical temperature (), the barriers can be extracted. The barriers for each cluster size are shown in Fig. 3.
These barriers should find their origin in the number of broken bonds associated with a cluster. Therefore they should be well described by a power-law:
| (3) |
The fit of the extracted barriers according to Eq. (3) is and is remarkably good as shown in Fig. 3. The value for () is close to 2/3, the value one would expect for spherical clusters of closely packed spherical objects [15], and to 0.64 the value expected from scaling relations [11]. Thus this is a new and effective method to determine the critical exponent , never used before to our knowledge.
The features of reducibility and thermal scaling discussed above can be found united in Fisher’s formula for the cluster abundance in a vapor as a function of cluster size and of temperature. The formula is
| (4) |
where one can see the thermal scaling up to and the dependence of the “barrier” on the cluster mass through the critical exponent [21, 22]. It is interesting to explore further the applicability of this formula to the Ising model.
In addition to the linear behavior of the Arrhenius plots below the critical temperature, the Fisher droplet model also predicts that the cluster size distribution at the critical point must follow a power law
| (5) |
where is fixed by the normalization relationship
| (6) |
Away from the critical temperature, the cluster distribution should not follow a pure power law. Thus, to determine without a prior knowledge of the critical temperature, linear fits to the cluster distributions were determined for all temperatures. At the critical temperature, the fit should have the
lowest and thus this fit should determine . The results for the best fit are shown in the lower panel of Fig. 3. From this method, the critical temperature was found to be with a best fit line of the form . This temperature is consistent with the value determined for infinite systems () and the value of () is close to the expected value for an infinite system (). The fit also determines which can be compared to the prediction of Eq. (6). The fit predicts while . The power law fit of the fragment abundances at the critical temperature is shown in Fig. 3.

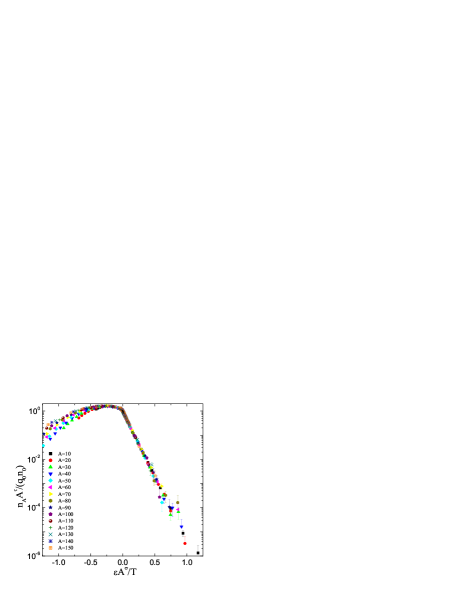
In the coexistence region, which in the Ising model should prevail for when the magnetization is not constrained, the chemical potentials of the liquid and gas phases are equal, thus Eq. (4) can be rewritten as:
| (7) |
with . Therefore, a graph of the scaled cluster distributions () as a function of should make the distributions of all cluster sizes collapse onto a single curve. This scaling behavior can clearly be seen in Fig. 4. This nearly perfect collapse below the critical temperature extends over six orders of magnitude for the broadest range of cluster sizes and it is perfectly linear. Therefore the three-dimensional Ising model and fluids belong to the same class of universality and can be described by Fisher’s droplet model. The Ising clusters constructed here can be properly thought of as “vapor” in equilibrium with the “liquid” percolating cluster. Coexistence of the two phases is determined by the observation that the empirical scaling requires . The fact that both the three-dimensional Ising model and the experimental nuclear multifragmentation data obey the same scaling predicted by Fisher’s droplet model indicates that nuclear multifragmentation can indeed be identified as the clustering (non-ideality) in a nuclear vapor in equilibrium with the nuclear liquid [4].
We note that the value of determined in this work is larger than , the usual value of from studies of the thermal properties of three-dimensional Ising systems. There are several possible explanations for the differences between the value of determined in this study and the values found from other studies. First, while statistical errors are small, systematic errors may not be so small. Finite size effects of the lattice could lead to an overabundance of small clusters. This is
caused by the fact that large clusters near the edge of the lattice are unable to grow beyond the lattice edges easily, even though periodic boundary conditions are used in this model. The effects of lattice size as well as other systematic errors are discussed in greater detail in [20]. An over-abundance of small clusters, with a corresponding suppression of large clusters, would increase the slope of the cluster distribution leading to larger than expected values of and , just as we have observed.
In conclusion, we have shown that the clusterization in the Ising model, like nuclear multifragmentation, portrays reducibility and thermal scaling. In addition, the Arrhenius plots allow for the extraction of “barriers” which are found to have a dependance of , where (which is close to 2/3) is a critical exponent. The reducibility and thermal scaling features in the Ising model can be incorporated into a Fisher-like scaling with , which is obeyed rigorously over the explored temperature range below the critical temperature. Thus the observed clusters can be interpreted as the non-idealities of a vapor in equilibrium with a liquid. Finally, nuclear multifragmentation, which is seen to share all the scaling observed here, should be similarly interpreted as the clusterization of a nuclear vapor in equilibrium with its liquid.
Acknowledgements
This work was supported by the National Science Foundation under grants NSF-RUI 9800747 and NSF-REU 9876955 and the Nuclear Physics Division of the US Department of Energy under contract DE-AC03-76SF00098. One of us (CMM) acknowledges support from LBNL during her sabbatical visit.
Present Addresses
1 Nuclear Science Division, Lawrence Berkeley National Laboratory,
Berkeley, CA 94720
2 Marietta College, Marietta, OH 45750
REFERENCES
- [1] L. G. Moretto et al., Phys. Rep. 287, 249 (1997).
- [2] L. Beaulieu et al., Phys. Rev. Lett. 81, 770 (1998).
- [3] L. G. Moretto et al., Phys. Rev. C 60, 031601 (1999).
- [4] J. B. Elliott et al., Phys. Rev. Lett 85, 1194 (2000).
- [5] D. Stauffer, Phys. Rep 54, 2 (1979).
- [6] D. Stauffer and A. Aharony, “Introduction to Percolation Theory”, 2nd ed. (Taylor and Francis, London, 1992).
- [7] W. Bauer et al., Phys. Lett. B 150, 53 (1985).
- [8] W. Bauer et al., Prog. Part. Nucl. Phys. 99, 42 (1999).
- [9] P. D. Gujrati, Phys. Rev. E 51, 957 (1995).
- [10] D. Stauffer, Phys. Rev. Lett. 35, 394 (1975).
- [11] C. Domb and E. Stoll, J. Phys. A 10, 1141 (1977).
- [12] A. Coniglio and W. Klein, J. Phys. A 13, 2775 (1980).
- [13] J. L. Cambier and M. Nauenberg, Phys. Rev. B 34, 8071 (1986).
- [14] J. Kertész, Physica A 161, 58 (1989).
- [15] J. S. Wang, Physica A 161, 249 (1989).
- [16] J. S. Wang and R. H. Swendsen, Physica A 167, 565 (1990).
- [17] D. De Meo, D. W. Heermann and K. Binder, J. Stat. Phys. 60, 585 (1990).
- [18] A. M. Ferrenberg and D. P. Landau, Phys. Rev. B 44, 5081 (1991).
- [19] J. J. Alonso, A. I. López-Lacomba and J. Marro, Phs. Rev. E 52, 6006 (1995).
- [20] C. M. Mader et al, in progress.
- [21] M. E. Fisher, Physics 3, 255 (1967).
- [22] M. E. Fisher, Rep. Prog. Phys. 30, 615 (1969).
- [23] C. S. Kiang and D. Stauffer, Z. Physik 235, 130 (1970).
- [24] D. Stauffer and C. S. Kiang, Advances in Colloid and Interface Science 7, 103 (1977).
- [25] J. B. Elliott et al., Phys. Rev. C 62, 064603 (2000).