Scaling of single photon production in hadronic collisions
Abstract
Scaling of single photon production in and collisions is studied. It is empirically observed the available data scales for and for larger . The NLO pQCD predictions for collisions at of 200 and 5500 GeV, relevant for RHIC and LHC energies are seen to closely follow this scaling behaviour. Implications for single photon production in heavy ion collisions are discussed.
PACS numbers: 25.75.-q, 12.38Mh
Radiation of single photons in and collisions have been studied for a long time, for getting information about the partonic distributions of nucleons and to test the applicability of pQCD. A similar expectation is also associated with the study of Drell-Yan process. In this connection the so-called Craigie fit [1] to the Drell-Yan data, showing a scaling
| (1) |
has remained a very useful tool for identifying the source of dileptons in hadronic collisions. Scaling relations are also useful in estimating of the strength of ‘corrections’ which cause a deviation from the expected behaviour.
Owens [2] has discussed the possible scaling of the production of single-photons in hadronic collisions. To leading order in , single photons originate from Compton () and annihilation () processes, whose cross-sections, , have dimensions of 1/GeV4. This follows from the fact that the strong and electromagnetic coupling constants are dimensionless and for massless partons no other (mass) scale enters into the problem. This, Owens argued, can be used to construct a scaling relationship for the invariant cross-section, , by combining the kinematic variable, , , and (or the rapidity ), or equivalently, , , and , etc., so that one could write
| (2) |
with and a dimensionless function. This arguments needs to be refined to accommodate the fact that the strong coupling constant depends on the QCD scale parameter which has dimensions of momentum, and the structure functions depend on the at which they are sampled. This, along with higher order terms, would admit a more complicated dependence on the momentum parameter . It has been argued that such scaling violations, depending on the kinematic region could raise to 6.
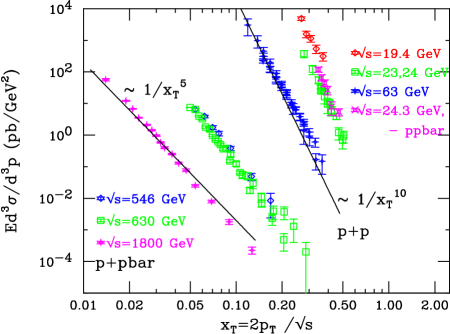
The data for single photon production has been compiled and carefully analyzed using NLO pQCD treatment by Vogelsang and Whalley[3] and Aurenche et al [4]. Our goal here is much more modest, we analyze them empirically to look for scaling if any. We see (Fig. 1) that, indeed, the data show different scaling behaviour for the regions and , as is evident from the two lines drawn through them to guide the eye and to indicate the slope (i.e. the power of ) for a given .
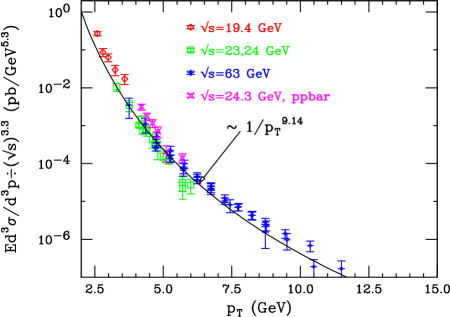
Next we perform a fit and find that to a very good accuracy, the data show a scaling, such that
| (3) |
which varies as and corresponds to , suggesting that the scaling violations are small in this kinematic region (see Fig. 2). Numbers varying by a few percent are obtained in an unrestricted fit when the powers of and were used as free parameters.
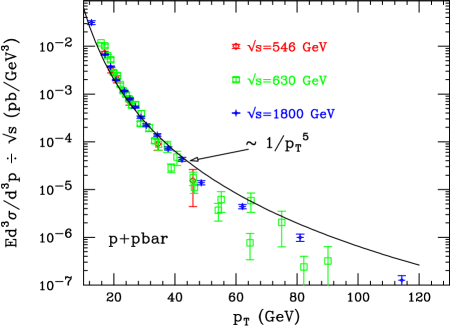
For the kinematic region we find (see Fig. 3),
| (4) |
which varies as and corresponds to in the notation of Owens(Eq.2). This indicates a large contribution of higher order processes and associated deviation from the simple scaling at smaller .
We digress a little to indicate that even though the E704 data [5] at 19.4 GeV have been included in the Fig. 3, they were not included in the fitting procedure, which became unstable when this was done. We also add that in the analysis of Vogelsang and Whalley [3] only these data show a large deviation from the NLO pQCD results obtained there.
A comparison of the E704 data at 19.4 GeV with the NA24[7] data at 23.75 GeV further shows that the former has a result which is about 50% larger at 3.2 GeV which is very curious. The scaling seen here predicts that for a given , the production at 19.4 GeV should be a factor of two smaller, compared to its value at 23.75 GeV.
Even though it is preposterous to argue about experimental data, it is tempting to note that the data at 19.4 GeV are a factor of 3.5 larger than ‘expected’ on the basis of this scaling. If it were indeed so, then the NLO pQCD results in Fig. 4 of Vogelsang and Whalley would provide a perfect description to the ‘correct data’, without any need of inclusion of the so-called intrinsic effects[16]. The inconsistency of these data as well as the absence of requirement to include intrinsic effects has been discussed in great detail by Aurenche et al [4].
We have already noted that the NLO pQCD analysis by Vogelsang and Whalley and Aurenche et al has provided a reasonably accurate description of the data included in the analysis here. Thus it would be fair to say that the scaling behaviour observed in the present work is a fair representation of the NLO pQCD predictions for single photons from collisions. (The slight difference between the results for and is neglected here. In any case, the Compton term would dominate the contributions for not too large values of .)
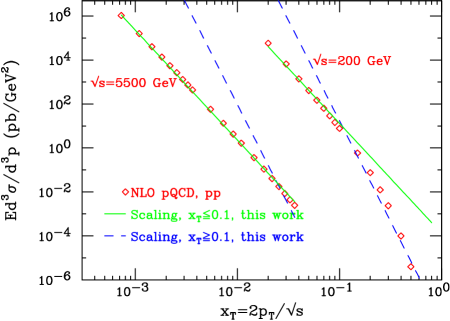
In Fig. 4 we have plotted the NLO pQCD predictions of scattering at 200 and 5500 GeV obtained in Ref. [17], which are relevant for the experiments to be performed at RHIC and LHC. For the higher energies the range of considered, limits to only smaller values and the scaling Eq.(3) provides a very good description to the predictions. The range of considered at 200 GeV is such that it spans both the low as well as the high regions considered in the scalings seen here. It is gratifying to note that the NLO pQCD resultsi change over from the scaling Eq.(3) to that of Eq.(4) as increases beyond 0.1.
What do these results mean for the recently measured single photon data by the WA98 group for the collision at the CERN SPS?
We recall an interesting observation made some time ago by the authors of Ref. [20]. Assuming that such heavy ion collisions lead to the formation of quark-gluon plasma and assuming that the system thus formed undergoes a boost-invariant expansion [21], one can relate the particle rapidity density () to the initial time () and the temperature ():
| (5) |
where is the transverse dimension of the system and is decided by the number of degrees in the plasma.
It was pointed out [20], that the quantity
| (6) |
for both and the systems in the WA80 [19] and the WA98 [18] experiments at the CERN SPS, we are offered a unique opportunity of comparing two systems of different volumes which may have identical initial conditions! It is seen that if the transverse expansion of the system does not play a significant role then for a given , the only scale in the system is provided by the temperature, for a baryon free plasma.
If this reasoning is correct then the radiation of single photons per unit transverse area would be identical. This leads to a simple geometrical factor of 3.5 by which the data for system can be scaled to get the results for system.
What about the contribution of prompt photons for the two cases? The scaling behaviour of the prompt photons seen here suggests that we may obtain the prompt photon yield for the WA98 experiment as:
| (8) | |||||
where 17.4 and 20 GeV for the WA98 and the WA80 experiments. This suggests that the prompt photon production for the WA98 experiment can be obtained by multiplying the corresponding contribution for the WA80 experiment by a numerical factor of 3.43. This is quite close to the factor of 3.5 obtained earlier for the thermal photon yield! In view of the above it is felt that the sum of thermal and prompt photon productions for the two experiments should differ by a factor of about 3.5!
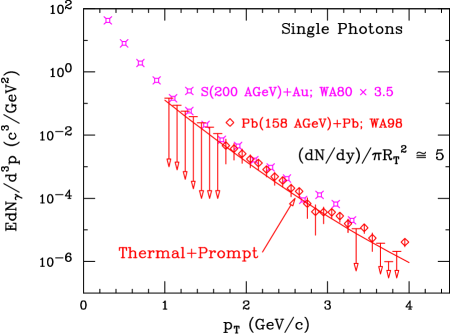
In Fig. 5 we show the upper limit of the multiplied by this factor against the (upper limit and) the data for the system reported by the WA98 experiment. It is a pity that the weekness of the this signal which is buried into the huge back-ground of decay photons has resulted in the identification of only the upper-limit of the single-photon production for the system. Still, it is interesting to note that the upper limit measured in the WA80 experiment is consistent with the excess of single photon production obtained by the WA98 experiment.
We have also shown a recent explanation of the data data [22] using (corrected) two loop rates for photon production from the QGP along with the contribution of hadronic reactions, as well the prompt photons estimated by Wong and Wang [16] within a pQCD with inclusion of effects of the intrinsic of the partons.
In brief, we have seen that the data for single photon production in nucleon-nucleon collisions can be broadly divided into two regions 0.1 and 0.1. A scaling behaviour is seen for low data, as expected from leading order pQCD, while for larger a behaviour is observed, which indicates large corrections to the lowest order QCD results. It is hoped that these observations may provide a useful guide-line for identification of source of single photons as well as the extent of corrections over the lowest order pQCD for these processes.
Acknowledgements
We thank Terry Awes, Charles Gale, Juergen Schukraft, and Bikash Sinha for useful comments.
REFERENCES
- [1] N. S. Craigie, Phys. Rep. 47, 1 (1978).
- [2] J. F. Owens, Rev. Mod. Phys. 59, 466 (1987).
- [3] W. Vogelsang and M. R. Whalley, J. Phys. G 23, A1 (197).
- [4] P. Aurenche, M. Fontannaz, J. Ph. Guillet, B. Kniehl, E. Pilon, and M. Werlen, Eur. Phys. J. C 9 (1999) 107.
- [5] D. Adams et al, Expt E704, Phys. Lett. B 345, 569 (1995).
- [6] M. Bonesini et al., Expt WA70, Z. Phys. C 38, 371 (1988).
- [7] C. De Marzo et al., Expt NA24, Phys. Rev. D 36, 8 (1987).
- [8] G. Ballocchi et al., Expt UA6, Phys. Lett. B 317, 250 (1993).
- [9] A. L. S. Angelis et al., Expt R110, Nucl. Phys. B 327, 541 (1989).
- [10] T. Akesson et al., Expt R807, Sov. J. Nucl. Phys. 51, 836 (1990).
- [11] E. Anassontzis et al., Expt R806, Z. Phys. C 13, 277 (1982).
- [12] C. Albajar et al., Expt UA1, Phys. Lett. B 209, 385 (1988).
- [13] J. Allitti et al., Expt UA2, Phys. Lett. B 288, 386 (1992).
- [14] F. Abe et al., Expt E741, Phys. Rev. Lett. 73, 2662 (1994).
- [15] S. Abachi et al., Expt D0, Phys. Rev. Lett. 77, 5011 (1996).
- [16] C. Y. Wong and H. Wang, Phys. Rev. C 58, 376 (1998).
- [17] J. Cleymans, E. Quack, K. Redlich, and D. K. Srivastava, Int. J. Mod. Phys. A 20, 2941 (1995).
- [18] M. M. Aggarwal et al., WA98 Collaboration, Phys. Rev. Lett. 85, 3595 (2000).
- [19] R. Albrecht et al., WA80 Collaboration, Phys. Rev. Lett. 76, 3506 (1996).
- [20] D. K. Srivastava, S. Sarkar, P. K. Roy, D. Pal, and B. Sinha, Phys. Lett. B 379, 54 (1996).
- [21] J. D. Bjorken, Phys. Rev. D 27, 140 (1983); R. C. Hwa and K. Kajantie, Phys. Rev. D 32, 1109 (1985).
- [22] D. K. Srivastava and B. Sinha, nucl-th/0006018.