Robust Nuclear Observables and Constraints on Random Interactions
Abstract
The predictions of the IBM two-body random ensemble are compared to empirical results on nuclei from Z=8 to 100. Heretofore unrecognized but robust empirical trends are identified and related both to the distribution of valence nucleon numbers and to the need for and applicability of specific, non-random interactions. Applications to expected trends in exotic nuclei are discussed.
Recently there has been renewed interest in the spectroscopic properties of Hamiltonians with random interactions [1, 2, 3, 4, 5, 6, 7]. Scrutiny has focused on nuclear systems but applications exist in other many body quantal systems such as quantum dots or metallic clusters. In the nuclear case, analyses have been carried out in the frameworks of the Shell Model [1, 2, 3, 5] and the Interacting Boson Model (IBM) [4, 5, 6].
These studies are extremely important because they explore the origins of fundamental features of nuclear structure. The upshot of these studies has been surprising recognition that some of the most hallowed aspects of structure, such as ground states for even-even nuclei, and even vibrational spectra, arise with randomly distributed interactions.
It is the purpose of this Letter to confront calculations with random and non-random interactions with robust experimental results to study which pervasive features of nuclei arise from the basis space and the generic type of interaction (e.g., 2-body) and which depend on the details of the interaction. We will use the insights developed in this analysis to better understand structural evolution and its relation to shell structure, and to project the behavior of exotic nuclei.
First, it is useful to succinctly summarize existing studies. In Shell model [1, 2, 3] and IBM [4, 5, 6] approaches for many-body systems, the majority (typically 70%) of calculated ground states have even though states comprise a much smaller fraction of the basis space than other angular momenta. While it might be suspected that such a ”pairing” property could emerge as a consequence of time reversal invariance, it has been shown [2] that this is not the case. Comparison of ground state wave functions in nuclei differing by two nucleons shows [3] further evidence for a pairing relationship, reflecting the generalized seniority scheme [8]. The analysis also extends to excited states. In the Shell Model, modest probabilities were found [1] for vibration-like spectra, defined by energy level ratios near 2.0. However it was not possible to produce significant numbers of spectra with rotational character, .
In the IBM analyses [4, 5, 6] a similar preponderance of ground states was found. Here, however, in contrast to the Shell Model, the interactions in an s-d boson space lead rapidly, with increasing boson number , to large probabilities for both vibrational [] and rotational [] spectra. Indeed, the IBM treatments produced no concentrations of values near values, as noted in Refs. [4, 5, 6]. These results are reminiscent of empirical correlations [9, 10] of and energies which give evidence for anharmonic vibrator and rotor behavior.
These studies [1, 2, 3, 4, 5, 6] are both surprising and important, and potentially impact our understanding of the origins of some of the most characteristic features of nuclear spectra. Such features seem to emerge primarily from the nature of the basis space and the rank (2-body) of the interaction.
Despite all this recent work, there has been no explicit comparison with experiment. It is therefore one of the purposes of the present Letter to do so, with data on level energies spanning the entire nuclear chart[11]. This is the first time that detailed data on the low-lying nuclear spectra have been compared with predictions obtained from random ensembles. In the process, some previously unrecognized features of the data themselves will be discerned, which are not in fact produced with random interactions, giving us the kind of information needed to define favored interactions.
To proceed, we use two IBM Hamiltonian ensembles, the full, most general, Hamiltonian (denoted ) with two 1-body and seven 2-body interactions, and the more “focused” Hamiltonian of the extended consistent Q formalism (ECQF) [12, 13], where . We use either uniform, random or fixed , as specified in each set of calculations below. The ensembles are defined by choosing random Gaussian interaction strengths in the Hamiltonians and as in ref.[4]. The full Hamiltonian gives results essentially identical to those in Ref. [4], with peaks at and 3.33, and growing probability for the latter as increases. The focused ECQF Hamiltonian (with random in the Q operator) gives similar but “cleaner” distributions. Both results are shown in the inset to Fig. 1. It is interesting to examine the correlations of vs. . Empirically, this correlation has been shown [9, 10] to be extremely robust, exhibiting a bi-modal character with slopes of 2.0 and 3.33 in collective nuclei. Comparisons of these data with calculations using the full HIBM for boson number NB=16 are shown in Fig. 1. The overall energy scale is fixed to the data by choosing the width of the Gaussian distributions. Similar results are obtained for other .
While the overall agreement is excellent, the trends of Fig. 1 only show part of the story. They do not easily reveal the distribution along the trajectory, that is, the probability distribution of nuclei as a of . And it is from this perspective that specific empirical features appear that are not described by calculations unless the range of interactions is constrained. To see this, consider Fig. 2(left) which shows empirical values for the entire nuclear chart from Z=8-100. In light nuclei, there is little evidence for collective values. In the lowest medium mass region, , however, a peak at begins to emerge. In heavier nuclei this peak remains but is now accompanied by nuclei with larger values and, in particular, a sharp enhancement near . Fig 3a shows the composite distribution of values for all . The peak at persists.
Is this preference a fundamental feature of nuclear spectra or a result of some bias in the data? To study this we consider in Fig. 2(middle) a different cut through the available data, namely, distributions for different ranges of boson numbers (i.e., valence nucleon numbers: ). Pre-collective nuclei () show few values above 2.0. Nuclei with are nearly all rotational, and those with in the range of 4-12 are transitional. Surprisingly, no range of valence nucleon number shows an enhancement at , contrary to the results of the random ensembles. (In this context we recall that the slope of 2.0 in Fig. 1 does not imply due to the finite intercept of this segment.) However, the second panel of Fig. 2(middle) shows that the peak centered on , mentioned above, is specifically associated with nuclei with valence nucleons. To our knowledge, this striking feature has not been pointed out explicitly before but, as we shall see, leads to an empirical constraint on interactions that is not evident from Fig. 1 alone.
Part of the explanation of the shell-by-shell results in Fig. 2(left) therefore merely reflects changing shell sizes and hence the distribution of possible values. However, this is not sufficient. It does not, for example, explain the overwhelming preference for rotational values in regions like where nuclei with small numbers of valence nucleons also exist, or the abundance of values near 2.3 in the shell. The data also reflect nuclei are in each region. For example, most known nuclei with have large .
If we assume the universality of the empirical distributions in Fig. 2(middle), we can construct expected distributions for any region of nuclei simply by tallying the number of occurrences of a given for a range of N and Z values and multiplying that number by the relevant empirical distribution. In Fig 3b, we show the distribution for all nuclei with Z82 assuming that, for each proton shell, all values are known for neutrons filling both the same shell and the next shell (regardless of where the drip lines are). So, for example, for , we compile the distribution for . For , we use . The peak at persists, reflecting simply the fact that boson numbers from 4-9 appear frequently in virtually all shells. Fig. 3c shows similar results for and . The peak at remains, but with a proliferation of larger boson numbers, a large abundance of rotational values near 3.33 also appears.
It is an important component of this Letter to see if calculations with random interactions can reproduce these distributions. Such calculations (for both and ) are shown in Fig. 2(right) for comparison with the data in Fig. 2(middle). Some results agree with the empirical trends such as the lack of structure for low boson numbers with and the abundance of 3.33 values for large . However, these random calculations tend to give a peak at 2 and nowhere do they show a peak at 2.3.
We will see momentarily that this points towards the need for specific non-random interactions. First, though, it is important to note that, although the interactions used in are random, they actually contain an implicit bias in values. For and values from down to , IBM spectra are vibrational. For rotational spectra result. Thus, for a random interaction, which effectively samples an infinitely large range of values, the measures of the vibrational and rotational regions far exceed that of the transitional region, which accounts for the high frequencies of calculated values near 2.0 and 3.33. (Similar arguments apply, but for shifted ranges of , for the other values.) The Gaussian random numbers also enhance the O(6) values of () for small , as seen in Fig. 2 (right column, dashes).
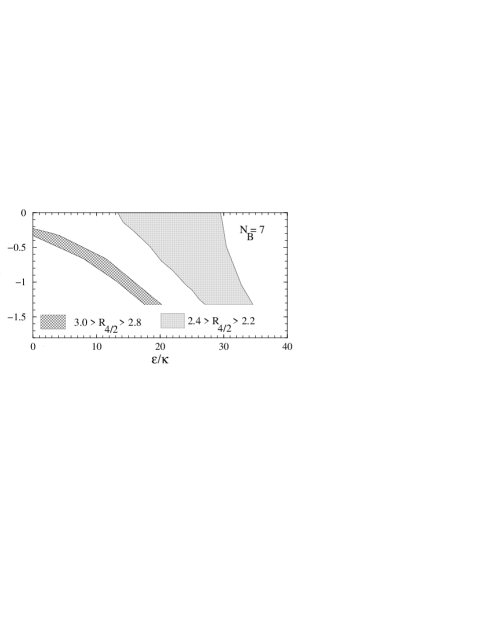
We carried out a large sampling of calculations to determine the specific range of interactions that yield a given value and, in particular, for . Figure 4 shows the statistical ranges of and values that give in the ranges of 2.2-2.4 and 2.8 - 3.0 for =7. Given the discussion just above, it is not surprising that values require intermediate ranges of near 20-30.
Thus, the empirical preference for values reflects ingredients: the relevant interactions, and the of accessible nuclei. Had the valley of stability lain elsewhere, or had the and values been different, the distribution would have been different. Comparison of measured distributions in new, unmapped regions with expectations (as in Figs. 3(b)-(c)) can thus be used to deduce information either on shell structure (e.g., magic numbers) or on the interactions applicable to these new nuclei.
Another example of characteristic nuclear data that constrains the interaction comes from rotational nuclei, namely, the energies of gamma vibrational modes, , in deformed nuclei. In Fig. 5a we show the results for with (to approximate the mean boson number for the deformed rare earth nuclei). There is no evidence for a peak in at any value larger than 2. In heavy nuclei, however, such excitations are well known to occur at 10-20 times the energy. Fig. 5b shows a collection of empirical results for for the rare earth region showing a broad bump centered on . If we now truncate the interaction space to that relevant for deformed nuclei, that is, we see, as shown in Fig. 5c, that, for each value, a distinct peak in probability appears. The peak for (solid), which is the traditional value for deformed nuclei, gives an excellent reproduction of the data. Once again, therefore, specific data on actual nuclei help identify and constrain the nature and relative importance of the 1- and 2-body residual interactions.
To summarize, we presented a confrontation of the data for Z=8-100 with the predictions of nuclear structure calculations with random interactions, in the framework of the IBM. (a) General features of nuclear spectra, such as ground states and the appearance of vibrational and rotational nuclei[4], and the global trajectory, are typical of calculations with random interactions; (b) Heretofore unrecognized features of the data such as the absence of an abundance peak at the vibrator value = 2.0 and a frequency enhancement at , in nuclei with intermediate numbers of valence nucleons, were discovered. (c) Such robust features of nuclear data, or others such as the characteristic energies of -vibrational modes in deformed nuclei, point to specific ranges of interactions. In particular, we showed that data such as these depend on the relevant valence nucleon numbers (i.e., the nuclei that are known) and on the interactions. If the residual interactions change in new nuclei (e.g., near the drip lines), then so will the distributions of values and the collective features of exotic nuclei. If the locus of newly accessible nuclei favors certain shell regions, the distribution of values and the nature of collective modes will reflect this as well. Conversely, valence nucleon number, and hence shell structure and the locations of magic nuclei, can be estimated from empirical knowledge of values, even when the magic nuclei themselves are not accessible. The usefulness of this result in studies of exotic nuclei, where issues of shell structure or the nature of residual interactions are paramount, is obvious.
We are grateful to Alejandro Frank, Roelof Bijker, Stuart Pittel and Franco Iachello for discussions that initiated and motivated this work. Work supported by the U.S. DOE under Grant numbers DE-FG02-91ER-40609, DE-FG02-91ER-40608, and DE-FG02-88ER40417.
REFERENCES
- [1] C.W. Johnson, G.F. Bertsch, and D.J. Dean, Phys. Rev. Lett. , 2749 (1998)
- [2] R. Bijker, A. Frank, and S. Pittel, Phys. Rev. , 021302 (1999)
- [3] C.W. Johnson, G.F. Bertsch, D.J. Dean, and I. Talmi, Phys. Rev. , 014311 (1999)
- [4] R. Bijker and A. Frank, Phys. Rev. Lett , 420 (2000)
- [5] R. Bijker, A. Frank, and S. Pittel, nucl-th/0004032.
- [6] R. Bijker and A. Frank, nucl-th/0004002.
- [7] J.B. French et al., Phys. Rev. Lett. , 2313 (1985)
- [8] I. Talmi, Simple Models of Complex Nuclei (Harwood Academic Publishers, Chur, 1993).
- [9] R.F. Casten, N.V.Zamfir, D.S. Brenner, Phys. Rev. Lett. 71, 227 (1983).
- [10] N.V.Zamfir, R.F. Casten, Phys. Lett. 341B, 1 (1994).
- [11] Nuclear Data Sheets through 87, No. 1 (1999).
- [12] D.D. Warner and R.F. Casten, Phys. Rev. Lett. 48, 1385 (1982).
- [13] P.O.Lipas, P. Toivonen, D.D.Warner, Phys. Lett. 155B, 295 (1985).