Theoretical study of the decay-out spin of superdeformed bands in the Dy and Hg regions
Abstract
Decay of the superdeformed bands have been studied mainly concentrating upon the decay-out spin, which is sensitive to the tunneling probability between the super- and normal-deformed wells. Although the basic features are well understood by the calculations, it is difficult to precisely reproduce the decay-out spins in some cases. Comparison of the systematic calculations with experimental data reveals that values of the calculated decay-out spins scatter more broadly around the average value in both the 150 and 190 regions, which reflects the variety of calculated tunneling probability in each band.
1 MODEL OF THE DECAY OF SUPERDEFORMED BANDS
Decay of superdeformed (SD) rotational bands out to normal deformed (ND) states is one of the most interesting nuclear structure problems. It can be viewed as a shape-coexistence phenomena, and the mixing mechanism of two states having very different internal structures can be studied as functions of angular momenta and excitation energies. Using the compound mixing model [1], we have investigated the decay-out phenomena in [2], where a consistent description was presented and the rapid decay-out was well understood. After the calculation of [2], more systematic and improved calculations have been performed [3], in which all the relevant quantities to the decay-out have been calculated without any adjustable parameters. We have found, however, it is rather difficult to reproduce the decay-out spin for individual SD bands (cf. Figs. 1, 2).
The basic idea of our framework [1, 2] is based on a simple two-well-mixing: The two groups of unperturbed states belonging to wells, I (e.g. ND) and II (e.g. SD), are separated by a potential barrier in some collective coordinate space (e.g. deformations). The most important is the (mean) coupling strength between the two, and is estimated as [4]
where is the frequency of each well, is the mean level distance, and is the transmission coefficient of the tunneling process between the wells with the least action . Depending on the situation of states in each well, one of three cases should be chosen in Eq. (1): An example of (1a) is the decay of high- isomers [6], in which severe breakdown of -hindrance has been observed recently. The present problem of decay-out of near-yrast SD bands corresponds to (1b), where the ND states are compound states and described by the GOE model [1]. In higher energies thermally excited SD bands are rotationally damped [7], and (1c) may be most appropriate for the decay-out of such SD continuum states [8].
In the present case, the relative intensity of -rays inside the SD band, which is calculated by the total decay-out probability at spin , is almost the only observable and will be discussed in the followings. According to [1], is determined by combinations, and , of four quantities; the spreading width = due to the coupling (1), the level density of the ND compound states, and the -decay widths and of the SD and ND bands, respectively, where is of rotational E2, while is mainly of statistical E1 (see [2, 8] for details). It is worth mentioning that the model of [1] for was re-examined by means of a statistical model of compound nucleus [9], and both models were found to give identical results for actual range of four parameters being relevant to decay of both the and 190 SD nuclei.
In this talk, we present the result of systematic calculations for the relative -ray intensity as a function of angular momentum in comparison with experimental data. We also discuss how the decay-out spin is understood from the calculations. Possible directions for improvements of the theoretical framework are suggested further.
2 RESULTS AND DISCUSSIONS
Quantities to be calculated are , , , and as functions of spin. is the usual rotational E2 width, while the level density and the statistical E1 width are given by
| (2) |
in unit of MeV, where is excitation energy of the SD band from the ND yrast state, and parameter is taken from an empirical analysis of [11] including the shell and temperature effects. The decay-out spin in the region is generally low so that the back-shift is used for nuclei, i.e. is replaced by MeV in , throughout the present investigation. As for , the least action path in the -plane is solved and the frequency and the action along it are calculated. Therefore all what we need are excitation energies of both SD and ND rotational bands, their quadrupole moments, and the potential energy surface and the mass tensor. We have used the Nilsson-Strutinsky calculation for potential with the pairing correlations included in the RPA order, and the pairing hopping model for mass tensor [5]; see [8] for the detailed formulation.
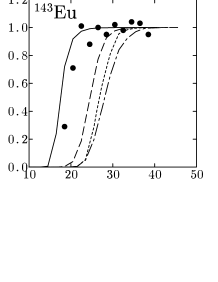
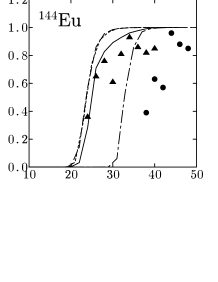
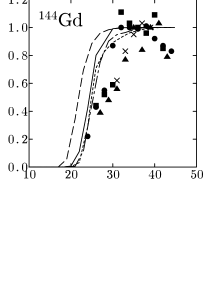
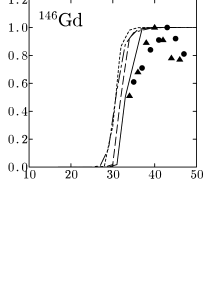
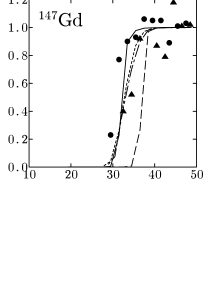
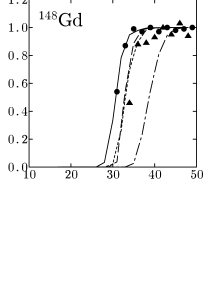
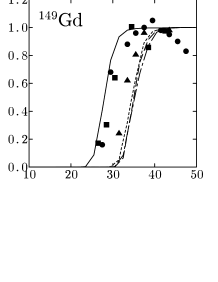
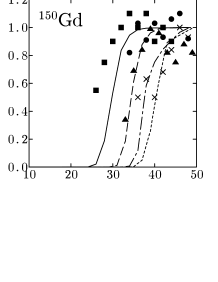
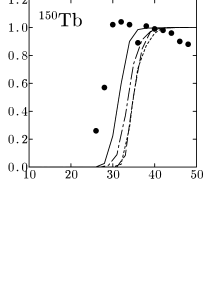
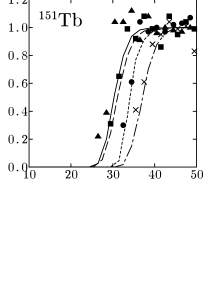
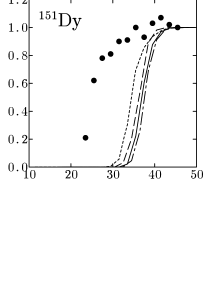
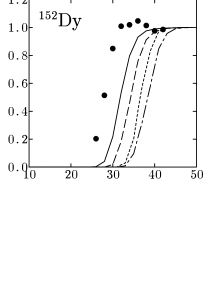
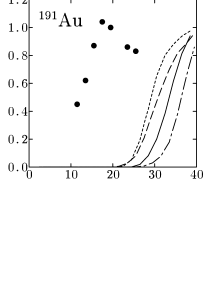
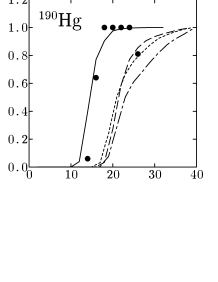
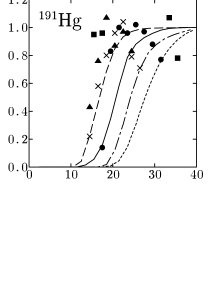
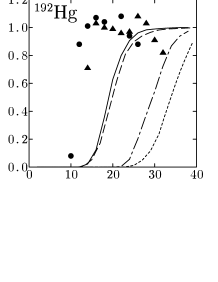
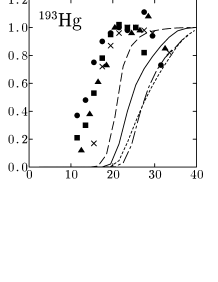
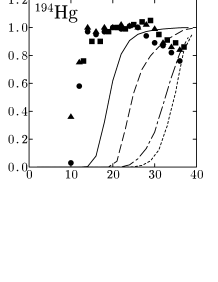
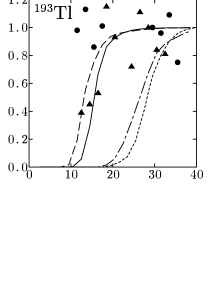
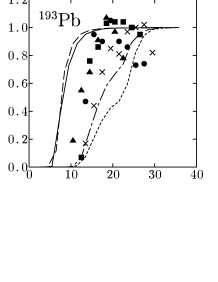
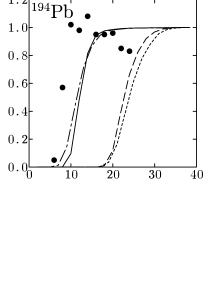
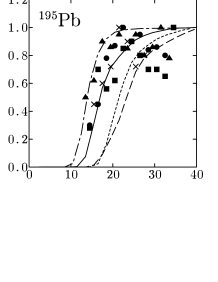
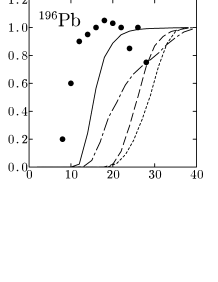
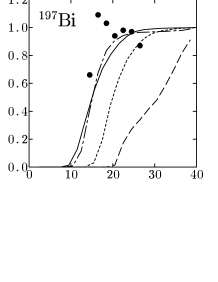
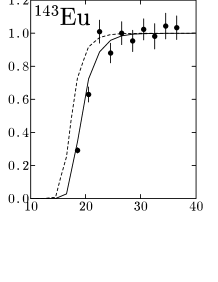
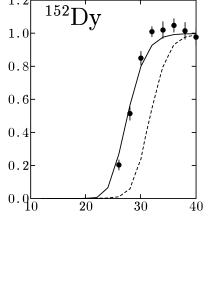
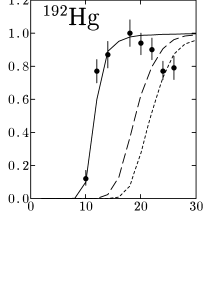
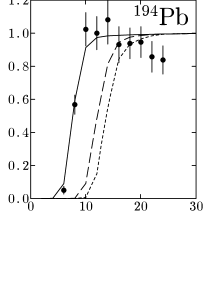
In Figs. 1 and 2 the results of calculation for relative intensities are shown, where those for the lowest band in each parity and signature (four bands) are included in one nucleus. The basic characteristics of intensity pattern are reproduced in both the and 190 regions; especially the rapid decrease of transitions at lower spins. Apparently, however, the decay-out spin does not agree precisely, and the detailed features, like the relative ordering of decay-out for excited bands in one nucleus, or relative difference of neighbouring nuclei, are not well described. Comparing Figs. 1 and 2, decay-out spins are rather well reproduced on average for the nuclei, while the calculated ’s are still higher than the observed ones for the nuclei, even though the back-shift is used for them. Although there are some cases where the yrast SD band decays at higher spin than the excited ones in Figs. 1 and 2, it is because the energy ordering is determined in the feeding-spin region; the ‘real’ yrast band survives longest in most cases.
As is shown in Figs. 1 and 2, the decay-out spin is not precisely reproduced in individual cases: What are the reasons? Possible sources of ambiguity in our model may be the level density and the mass tensor; we believe that the potential energy surface by the Nilsson-Strutinsky method is reliable. As for the change of the level density [2] it was found that, for example, a factor about is enough to fit in 152Dy, while factor is required for 192Hg; the latter may be out of the range of allowed ambiguity. The mass tensor is calculated by using the Fermi-gas estimate of the number of level-crossings [5], and detailed properties of individual nucleus is not included. Therefore, we try to use a mass tensor multiplied by a scaling factor and adjust it so as to fit . Resultant intensities for four selected nuclei are shown in Fig. 3, and the values of and of various quantities at are summarized in Table 1. Again, the correction factor for nucleus is rather small but is considerably larger for nucleus.
| (eV) | (eV) | (meV) | (meV) | (MeV) | |||||
|---|---|---|---|---|---|---|---|---|---|
| 143Eu | 0.7 | 390 | 630 | 1.5 | 1.3 | 3.3 | 2.57 | .52 | |
| 152Dy | 1.6 | 2.2 | 4.8 | 18 | 4.7 | 5.6 | 4.68 | .29 | |
| 192Hg | 2.3 | .11 | 69 | .058 | 5.2 | 6.9 | 4.24 | .33 | |
| 194Pb | 2.0 | .061 | 134 | .011 | 4.3 | 7.2 | 3.89 | .35 |
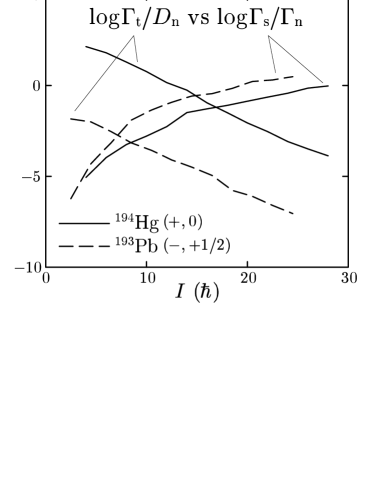
In order to see how the decay-out spin is determined by the four relevant quantities, we note that holds in realistic situations [1, 2]. Two quantities, and , are plotted as functions of spin in Fig. 5. takes appreciable value when , i.e. two curves crosses in Fig. 5, and is roughly determined by their crossing point. Moreover, the decay-out occurs more rapidly as the crossing angle between the two curves gets larger. decreases more rapidly in the low-spin region because of the behaviour of the rotational E2 transitions of SD bands, and therefore the decay-out tends to be more rapid when is lower; this behaviour is well observed in Figs. 1 and 2. takes similar values for SD bands within the or 190 region, while takes variety of values mainly due to the tunneling probability, which reflects the different potential landscapes depending on configurations and nuclei. This is the main reason why the range of calculated spreads rather broadly in contradiction to experimentally observed trend. In contrast, observed hindrance factors for the decay of -isomers take broad range of values in accordance with the results of similar calculations of tunneling [6]. The observed trend that falls in a rather narrow range in both the and 190 regions is not easy to understand.
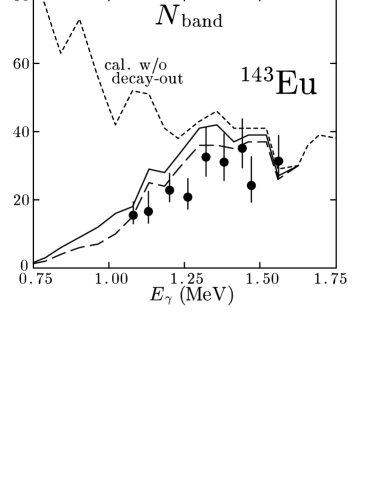
Finally, we have recently developed a microscopic model of thermally excited SD states that describes both the barrier penetration leading to the decay-out to the ND states, and the rotational damping causing fragmentation of rotational E2 transitions [8]. As an example, , the number of rotational SD bands in the quasi-continuum -ray region for 143Eu is shown in Fig. 5, where solid (dashed) curve is a result using Eq. (1c) (Eq. (1b)). Inclusion of the barrier penetration reduces dramatically in the low-spin region and the calculation nicely agrees with experimental data [14], which clearly shows that our model is capable for the unified understanding of feeding and decay of the SD bands.
3 SUMMARY
Systematic comparison of the calculated and observed relative intensities have been performed, and it is found that basic features of the decay-out of SD bands are well understood within our theoretical framework. However, the decay-out spin is not precisely reproduced in the calculation in individual cases. Especially an average value of for the nuclei is somewhat overestimated, and the range of calculated ’s seems too wide in both the and 190 regions. It should, however, be noticed that the average value of calculated in the region is much smaller than that in the region by about 10; the difference in the experiment is even more, about 15, though. As a possible source of improvement a simple scaling of the mass tensor is considered. We believe that microscopic calculations of mass tensor based on counting the number of level crossings has to be done in order to include detailed nuclear structure effects in each SD band. For the detailed comparison, the reproduction of excitation energies of the SD bands is very important, which is not enough in the present calculations; for example, that of 194Pb in Table 1 is about 1 MeV higher than the experimentally deduced value. For this purpose, the improvement of the potential energy surface may also be necessary, e.g. by making use of an another mean-field potential like Woods-Saxon or the one obtained by Skyrme Hartree-Fock method. These are remaining future problems.
As an another possible source of improvement, modification of the compound mixing model [1] may be considered. At higher spins where the excitation energy of SD bands is not so high, the ND states to which the SD band couples are not chaotic, and then strong reduction of mixing amplitudes may be expected [10]. This reduction leads to a delay of decay-out, which hopefully helps to decrease especially in the . There are, however, some ambiguities of the amount of reduction, and a precise modeling of this effect is necessary to draw a definite conclusion. It is also an interesting future problem.
This work is supported in part by the Grant-in-Aid for Scientific Research from the Japan Ministry of Education, Science and Culture (No. 12640281).
References
- [1] E. Vigezzi, R. A. Broglia and T. Døssing, Phys. Lett. B249 (1990) 163; Nucl. Phys. A520 (1990) 179c.
- [2] Y. R. Shimizu, T. Døssing, E. Vigezzi and R. A. Broglia, Nucl. Phys. A557 (1993), 99c; Y. R. Shimizu, F. Barranco, R. A. Broglia, T. Døssing and E. Vigezzi, Phys. Lett. B274 (1992), 253.
- [3] Y. R. Shimizu, T. Døssing and E. Vigezzi, unpublished (1996-97).
- [4] S. Bjørnholm and J. E. Lynn, Rev. Mod. Phys. 52 (1980) 725.
- [5] F. Barranco, G. F. Bertsch, R. A. Broglia and E. Vigezzi, Nucl. Phys. A512 (1990) 253.
- [6] K. Narimatsu, Y. R. Shimizu and T. Shizuma, Nucl. Phys. A601 (1996), 69.
- [7] K. Yoshida and M. Matsuo, Nucl. Phys. A612 (1997) 26; ibid. A636 (1998) 169.
- [8] K. Yoshida, M. Matsuo and Y. R. Shimizu, in preparation.
- [9] J. -Z. Gu, and H. A. Weidenmüller, Nucl. Phys. A660 (1999) 197.
- [10] A. Åberg, Phys. Rev. Lett. 82 (1999), 229.
- [11] S. F. Mughabghab and C. Dunford, Phys. Rev. Lett. 81 (1998) 4083.
- [12] B. Singh, R. B. Firestone and S. Y. F. Chu, “Table of Superdeformed Nuclear Bands and Fission Isomers”, LBL-38004 (1997)[http://ie.lbl.gov/sdband/sdbindex.html].
- [13] D. Curien et al., Phys. Rev. Lett. 71 (1993), 2559.
- [14] S. Leoni, private communication, to be published.