Semiempirical Shell Model Masses with Magic Number for Translead Elements with
Abstract
A semiempirical shell model mass equation based on magic number and applicable to translead elements with is presented. For -decay energies the equation is shown to have a high predictive power and an rms deviation from the data of about 100 keV. The rms deviations for masses and other mass differences are between about 200 and 300 keV.
PACS numbers: 21.10.Dr, 21.60.Cs, 27.80.+w
Recent progress in superheavy elements (SHE) research reaching to and its -decay products [1] makes it necessary to find an appropriate substitute for the semiempirical shell-model mass equation (SSME) [2] (see also ref. [3]) for nuclei in the neighbourhood of and beyond [4]. The energies of the decaying chain vary smoothly from to 269Sg , with no indication of magicity at in these nuclei [1], whereas the SSME assumes that is the next spherical proton magic number after lead and it stops there. Furthermore, the SSME becomes unsuitable for extrapolation already earlier, beyond Hs , as shown by its increasing deviations from the data when increases. (Like in fig. 4 of ref. [1].)
Recent phenomenological studies of BE(2) systematics [5] and of the persistence of the Wigner term in masses of heavy nuclei [6] indicate as the next spherical proton magic number after lead, and this is consistent with considerations based on nuclear diffuseness [7]. Recent self-consistent and relativistic mean-field calculations [8, 9, 10, 11, 12] variously predict proton magicities for and 126.
During the early stages of the SSME [13], when it was adjusted separately in individual shell regions in the plane, both and , which were at the time considered possible candidates for the postlead proton magic number (see, e.g., ref. [14]), were tried as a shell region boundary in each of the two heaviest regions with and respective -boundaries (called here region A) and (called region B). The agreement with the data was about the same for both choices, and the prevailing view in the mid nineteen-seventies led to the choice of for the SSME mass table [2]. In a recent communication [4] we showed that the early results have a high predictive power in the interior of region B and proposed their use there as a predictive tool in SHE research. In the present note we study the predictive power or extrapolatability of the early results in region A and propose a mass equation based on them as a substitute for the SSME [2] in the interior of the region. The study is based on the newer data that became available after the adjustments were made, as was done in refs. [4, 15, 16, 17, 18].
In the SSME the total nuclear energy is a sum of pairing, deformation and Coulomb energies:
| (1) |
The form of is the same in all shell regions:
| (2) |
and that of is the same separately in all diagonal shell regions, where the major valence shells are the same for neutrons and for protons, and in all non-diagonal regions, where the neutron and proton valence shells are different. Unlike in [2], with rather than 114 as an upper proton boundary, region A becomes a diagonal region with
| (3) |
The part for region A with as upper proton boundary is [13]
| (4) |
with
| (5) |
| (6) |
In eqs. (2)(4) and 222In the as yet unknown odd-odd translead nuclei the g.s. is expected to have and seniority zero, whereas eq. (1) with gives the energy of a low excited seniority two state [3]. (See also ref. [19].). The respective values of and are 82 and 164. The coefficients multiplying the functions of and are adjustable parameters which were determined by a least-squares adjustment to the data [13]. Their numerical values resulting from that adjustment are given in the second column of table I. The mass excesses are obtained by adding to eq. (1) the sum of nucleon mass excesses .
The experimental data used in the adjustment included 29 masses and 62 values connecting unknown masses (Ref. [20] augmented by data from the literature up to Spring 1973). Presently there are 150 known experimental masses in region A and 3 values connecting unknown masses (Refs. [21] (excluding values denoted “systematics” (#)) and [22], augmented by data from the recent literature). There are 121 new masses that were not used in the adjustments.
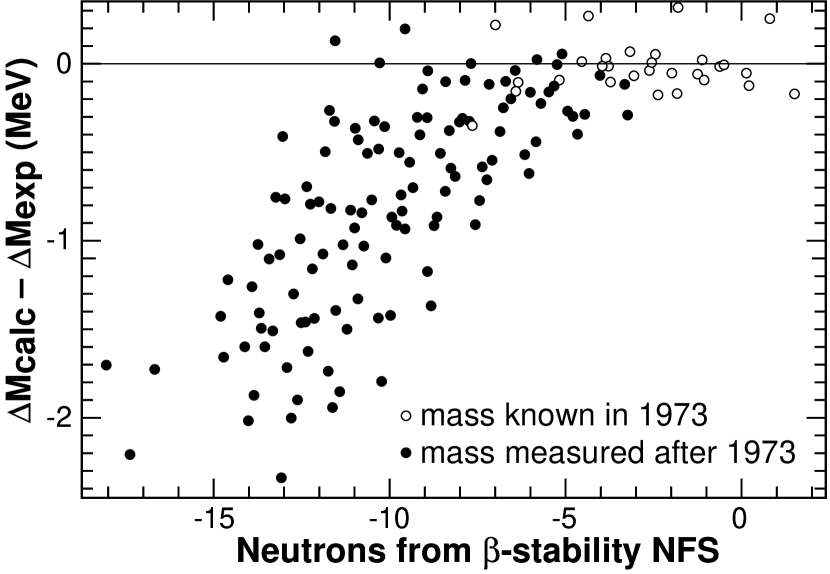
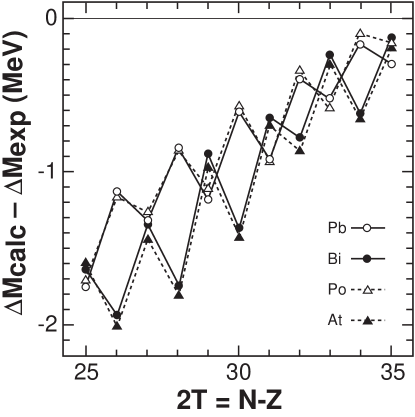
Fig. 1 shows the deviations from the data of the predictions of eq. (1) (with the definitions (2)(4) and the coefficients from the second column of table I) for all the 150 known masses. The deviations are plotted as function of the distance from the line of -stability, denoted “neutrons from stability” () and defined by [15]. Empty circles denote the deviations of the 29 originally adjusted masses and full circles mark the deviations of the 121 new masses. The original deviations are relatively small. The new deviations are mostly considerably larger and are almost all negative. There is a large scatter of the points, superposed on an overall decreasing trend when NFS increases in the negative direction. For closer scrutiny we show in fig. 2 lines connecting deviations of Pb, Bi, Po and At isotopes as function of rather than . Isotopic lines of other elements follow closely. There is an odd-even staggering of the points, where for even-even and odd-odd nuclei the deviations are respectively higher and lower than for odd-mass ones, and there is an overall increasing overbinding when decreases away from stability. The increasing staggering when decreases as compared to the old data indicates increasing pairing parameters (see also ref. [23]) and (even more so) towards the proton drip line. Similarly, the increasing binding when decreases indicates that the symmetry-energy parameter decreases towards the drip line.
Table II, patterned after similar more elaborate ones [16, 17] (see also ref. [4]), shows the values of and , the respective average and rms deviations of eq. (1) from the data, for and . The deviations are shown separately for the older data that were used in the adjustment and for the newer data. The last column shows the error ratios .
For the older data the are few tens keV at most, and the are in the range 100-250 keV. For the newer nuclei the agreement with the data of predicted (fig. 1), and values has much deteriorated. On the other hand, the of the predicted values has even very slightly improved. The deviations, both old and new, are remarkably small.
The high degree of extrapolatability of the values as compared to the poorer predictions of and is presumably due to the composition of the old data set used in the adjustments. The coefficients and , which contribute to both mass and values, and also , which was determined using and [13] (see also ref. [24]), were determined by all the 91 available mass and data. On the other hand, neglecting their -dependence the coefficients and cancel in and they were determined essentially by the smaller group of 29 masses found in the nearest-to-stability corner of the shell region, with too-small values of and and too large value of as compared to more proton-rich nuclei. These values, which to a large extent cancel in , are responsible for the large deviations of the predicted new masses.
One would like to restore to the new and predictions the same degree of agreement with the data as the old predictions had, while at the same time retaining the high quality of predictions. For eq. (1) this goal might most simply be approached by making a least-squares adjustment of eq. (1) to all the 150 known masses, with only four adjustable parameters and , while the other seven coefficients are held fixed on their old values from the second column of table I. The re-adjusted parameters and would correct the systematic overbinding when decreases, and the re-adjusted and would decrease the odd-even staggering of the deviations.
The re-adjusted values of the coefficients and are given in the third column of table I. Their changes compared to the second column are in the anticipated directions. The respective average and rms mass deviations obtained in the adjustment for all the 150 mass data are 2 and 246 keV.
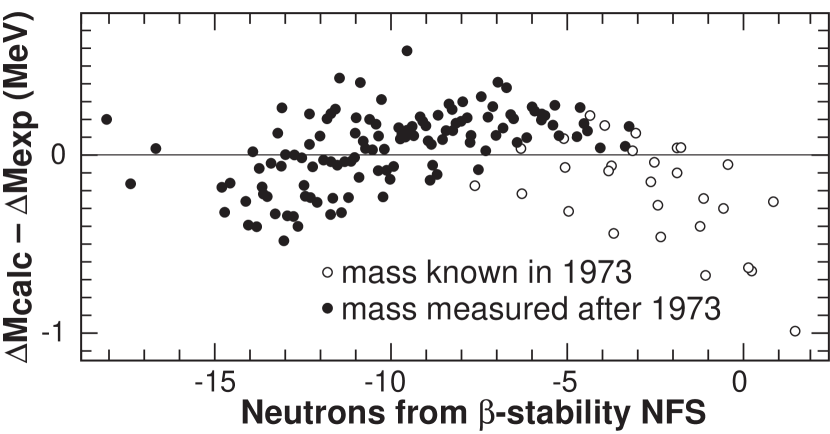
Fig. 3 shows the deviations from the data of the predicted mass values resulting from the new adjustment, similarly to fig. 1. For ease of comparison the same nuclei are denoted by the same kind of circle (empty or full) in the two figures. The deviations for the post 1973 measured nuclei (denoted by full circles) and their odd-even staggering are considerably smaller than in fig. 1, and the overall decreasing trend when decreases has largely disappeared, as was expected. The deviations for the older data have worsened, though, and there is a new overall oscillatory trend not observed in fig. 1, indicating that enlarging eq. (1) by additional particle-hole symmetric terms (eq. (4)) might reduce the deviations further.
Table III shows the resulting and values of the predicted deviations. Like in table II they are shown separately for the old 1973 data nearer to stability and for the new data extending into the interior of region A towards the proton drip line. For and the new deviations are similar to those of the original nuclei in table II. For and the are respectively 1.5 and 1.1 times larger.
The new mass deviations shown in table III are about one half to two thirds of the corresponding deviations of several recent mass models [16, 17, 18, 25, 26], and for they are smaller. The smaller values of the deviations in table III are presumably due mainly to the inclusion of the particle-hole symmetric configuration-interaction terms (eq. (4)) in eq. (1) [4]. Until a new adjustment of the SSME to the data in both regions A and B is undertaken, which would further reduce the deviations in both regions, we propose the use of eq. (1), with the new values of and and the old values of the other coefficients, given in table I, as a predictive tool for masses and their differences , and particularly for the extrapolatable-proven values, in the interior of region A.
It should be emphasized, though, that the above results are not a proof of superior magicity of in region A as compared to other recently proposed prediction [10, 11, 12], because no comparative studies of this kind were made. (See also ref. [4].)
We thank the Atomic Mass Data Center in Orsay for ref. [22] and Stelian Gelberg and Dietmar Kolb for help with the calculations.
References
- [1] V. Ninov et al., Phys. Rev. Lett. 83, 1104 (1999).
- [2] S. Liran and N. Zeldes, At. Data Nucl. Data Tables 17, 431 (1976).
- [3] N. Zeldes, in Handbook of Nuclear Properties, edited by D.N. Poenaru and W. Greiner (Clarendon Press, Oxford, 1996), p. 12.
- [4] S. Liran, A. Marinov and N. Zeldes, arXiv:nucl-th/0006045 and Phys. Rev. C (in press).
- [5] N.V. Zamfir et al., Phys. Lett. B357, 515 (1995).
- [6] N. Zeldes, Phys. Lett. B429, 20 (1998).
- [7] W.D. Myers and W.J. Swiatecki, Phys. Rev. C58, 3368 (1998).
- [8] S. Ćwiok et al., Nucl. Phys. A611, 211 (1996).
- [9] G.A. Lalazissis et al., Nucl. Phys. A608, 202 (1996).
- [10] K. Rutz et al., Phys. Rev. C56, 238 (1997).
- [11] M. Bender et al., Phys. Rev. C60, 034304 (1999).
- [12] A.T. Kruppa et al., Phys. Rev. C61, 034313 (2000).
- [13] S. Liran, Calculation of Nuclear Masses in the Shell Model, Ph.D. Thesis, Jerusalem, 1973. (In Hebrew. Unpublished.)
- [14] K. Kumar, Superheavy Elements (IOP Publishing, Bristol, 1989).
- [15] P.E. Haustein in Atomic Masses and Fundamental Constants 7, edited by O. Klepper, THD-Schriftenreihe Wissenschaft und Technik, Bd. 26 (Darmstadt, 1984), p. 413.
- [16] P. Möller et al., At. Data Nucl. Data Tables 59, 185 (1995).
- [17] P. Möller, J.R. Nix and K.-L. Kratz, At. Data Nucl. Data Tables 66, 131 (1997).
- [18] Y. Aboussir et al., At. Data Nucl. Data Tables 61, 127 (1995).
- [19] N. Zeldes, Phys. Lett. B455 (1999) 7.
- [20] A.H. Wapstra and N.B. Gove, Nuclear Data Tables 9, 265 (1971).
- [21] G. Audi and A.H. Wapstra, Nucl. Phys. A595, 409 (1995).
- [22] T. Radon et al. (submitted to Nucl. Phys. A, January 2000). Obtained from the AMDC Orsay.
- [23] A.S. Jensen, P.G. Hansen and B. Jonson, Nucl. Phys. A431, 393 (1984).
- [24] K. Ashktorab et al., Nucl. Phys. A517 (1990) 27.
- [25] W.D. Myers and W.J. Swiatecki, Nucl. Phys. A601, 141 (1996).
- [26] J. Duflo and A.P. Zuker, Phys. Rev. C52, R23 (1995).
| coefficient | Old Value (keV) | New Value (keV) |
|---|---|---|
| Original nuclei (1973) | New nuclei (1973-2000) | |||||||
| Error | ||||||||
| Data | N | (keV) | (keV) | N | (keV) | (keV) | ratio | |
| 29 | 146 | 121 | 1008 | 6.88 | ||||
| 18 | 39 | 214 | 120 | 406 | 1.90 | |||
| 22 | 9 | 182 | 104 | 132 | 417 | 2.29 | ||
| 15 | 242 | 101 | 248 | 583 | 2.41 | |||
| 78 | 5 | 103 | 31 | 40 | 89 | 0.87 | ||
| Original nuclei (1973) | New nuclei (1973-2000) | ||||||
| Data | N | (keV) | (keV) | N | (keV) | (keV) | |
| 29 | 344 | 121 | 216 | ||||
| 18 | 158 | 416 | 120 | 205 | |||
| 22 | 202 | 104 | 18 | 184 | |||
| 15 | 475 | 101 | 15 | 277 | |||
| 78 | 104 | 31 | 18 | 85 | |||