Semiempirical Shell Model Masses with Magic Number Z = 126 for Superheavy Elements
Abstract
A semiempirical shell model mass equation applicable to superheavy elements up to Z = 126 is presented and shown to have a high predictive power. The equation is applied to the recently discovered superheavy nuclei and and their decay products.
PACS numbers: 21.10.Dr, 21.60.Cs, 27.90.+b
Recently [1] an -decay chain consistent with the formation of and its sequential decay to and has been observed. The -decay energies vary rather smoothly along the chain. If the above assignments are confirmed, and the decaying nuclei are formed in or near their ground states (g.s.) [2], then the smooth variation seems to preclude the traditional macroscopic-microscopic [3, 4] Z = 114 as a magic proton number in these nuclei.
Recent phenomenological studies of BE(2) systematics [5] and of the persistence of the Wigner term in masses of heavy nuclei [6] indicate Z = 126 as the next spherical proton magic number after lead, and this is consistent with considerations based on nuclear diffuseness [7]. Recent self-consistent and relativistic mean field calculations [8, 9, 10, 11] variously predict proton magicities for Z = 114, 120, 124 and 126.
These new developments are contrary to the assumption made in the semiempirical shell-model mass equation (SSME) [12] (see also ref. [13]) that Z = 114 is the next proton magic number beyond lead. The equation stops at Z = 114, and it is unsuitable for extrapolation already earlier, beyond Hs (Z = 108), as shown by its increasing deviations from the data beyond that (like in fig. 4 of ref. [1]). One has to find an appropriate substitute for the equation in the neighbourhood of Z = 114 and beyond.
During the early stages of the SSME [14], when it was adjusted separately in individual shell regions in the N Z plane, both Z = 114 and Z = 126, which were at the time considered possible candidates for the post-lead proton magic number, were tried as a shell region boundary in each of the two heaviest regions with Z 82 and respective N boundaries 82 N 126 (called here region A) and 126 N 184 (called region B). The agreement with the data was about the same for both choices, and considering the prevailing view in the mid nineteen seventies Z = 114 was chosen for the SSME mass table. In this Letter we consider the possibility of substituting the SSME [12] in region B with the early results obtained with Z = 126. In particular we study the predictive power or extrapolatability of these results by using the newer data accumulated after the adjustments were made, like in refs. [15, 16, 17, 18]. Then we apply the equation to the results of two recent superheavy elements (SHE) experiments [1, 19]. Region A will be considered elsewhere.
In the SSME the total nuclear energy E is written as a sum of pairing, deformation and Coulomb energies:
| (1) |
The form of is the same in all shell regions:
| (2) |
and that of is the same separately in all diagonal shell regions, where the major valence shells are the same for neutrons and protons, and in all non-diagonal regions, where the neutron and proton valence shells are different. In a non-diagonal region like B it is
| (5) | |||||
The part for region B with Z = 126 as upper proton boundary is [14]
| (6) |
with
| (7) |
| (8) |
| (9) |
The respective values of and are 126, 82 and 208. The coefficients multiplying the functions of N and Z are adjustable parameters which were determined by a least-squares adjustment to the data [14]. Their numerical values are given in table I. The mass excesses are obtained by adding to eq. (1) the sum of nucleon mass excesses .
The experimental data used in the adjustments included 211 masses. (Ref. [20] augmented by data from the literature up to Spring 1973.) Presently there are 267 known experimental masses in region B. (Ref. [21] (excluding values denoted “systematics” (#)) augmented by data from the literature.) They include 56 new masses that were not used in the adjustments.
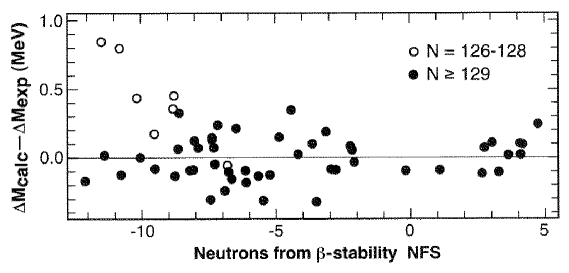
Unlike the SSME [12], when the corresponding 56 deviations of the predictions of eq. (1) (with the definitions (2)-(6)) from the data are plotted as function of Z they do not increase when Z increases towards 114. On the other hand, there are conspicuously large deviations of 218,219U and also 217,219Pa, with respective neutron numbers 126, 127, 126 and 128.
Fig. 1 shows the deviations as function of the distance from the line of -stability, denoted “neutrons from stability” (NFS) and defined by NFS = [15]. Empty circles denote the deviations of the nuclei 216Ac, 218Pa, 216Th, 217Pa, 219Pa, 219U and 218U, which increase in this order. These deviations indicate increasing underbinding of extrapolated nuclei when Z increases. They are related to the increasing discontinuity of the extrapolated mass surface along the common boundary N = 126 of regions A and B away from the data, when the two regions are adjusted separately [14, 22, 23]. (Such deviations can be avoided by adjusting the data in the two regions simultaneously, with continuity requirements along the boundary imposed as additional constraints [12].)
The deviations of the remaining 49 nuclei with , which do not follow the boundary but extend into the interior of the shell region, are marked by full circles. They are about equally positive and negative, have similar magnitudes, and do not seem to be correlated with NFS.
Table II, patterned after similar more elaborate ones [16, 17], shows and , the respective average and rms deviations of eq. (1) from the data, for and . The deviations are shown separately for the older data that were used in the adjustments and for the newer data. The last column shows the error ratios .
For the old data the magnitudes of the are single keVs, and for the they are in the range 110170 keV. For the new data they are larger, with respective highest values of 53 and 236 keV for and smaller values for and .
The table shows as well in brackets the corresponding deviations for the 49 nuclei extending into the interior of the shell region, where SHE are presently searched for. Except for they are smaller than the unbracketed deviations.
The deviations shown in table II are about one half of the corresponding deviations for several recent mass models [16, 17, 18, 24, 25]. The main reason for these smaller deviations is presumably the inclusion in eq. (1) of the particle-hole-symmetric configuration interaction terms (eq. (6)). (Without these terms the rms deviation from the original data of the part (eqs. (5) and (2) alone) is 1076 keV [14], as compared to the rms deviation of 126 keV from the original data in table II for the complete eq. (1). See also ref. [26].)
Until a new SSME adjustment to the data in both regions A and B is undertaken we propose the use of eq. (1) with the coefficients of table I instead of the SSME [12] as an appropriate predictive tool in SHE research in the interior of region B. It is important to emphasize, though, that the above rather suggestive results are not a proof of superior magicity of Z = 126 as compared to other recently proposed predictions [9, 10, 11], because no comparative mass studies of this kind were made. These are beyond the scope of the present work.
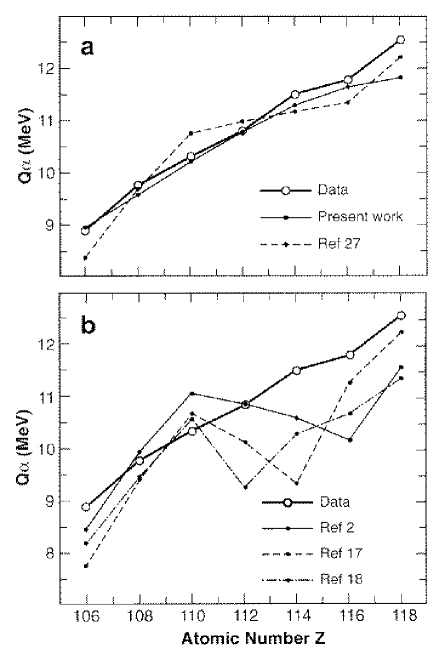
We now apply the equation to the results obtained in [1]. Panel a of fig. 2 shows the chain of -decay energies measured in [1], and the values predicted for them by eq. (1) when the data are interpreted as g.s. transitions of the nuclei assigned in [1]. (In ref. [2] some alternative possibilities of transitions between low-lying Nilsson levels are considered.) The figure shows as well the predictions [27] which motivated the search undertaken in [1]. The respective average and rms deviations of the predicted values from the data are and 308 keV for eq. (1) and and 357 keV for ref. [27]. The rms deviation of eq. (1) is consistent with table II, but the average deviation is too negative.
The variation of the predicted values of eq. (1) along the chain is smoother than that of the data. The kinks in the data at Z = 112 and 116 are not reproduced. Such kinks are usually interpreted as submagic number effects, and in the SSME these are assumed to have been obliterated by configuration interaction between subshells, described by the terms , eq. (6). The inadequacy of the SSME to describe abrupt local changes associated with subshell structure is detailed in figs. 2a-c of ref. [12].
On the other hand, the microscopic energies calculated in ref. [27] are basically sums of (bunched minus unbunched) single nucleon energies, and as such have (magic and) submagic gap effects built in. The corresponding predicted line in fig. 2 has kinks at Z = 110 and 116, corresponding to the predicted submagic numbers Z = 108 and 116 indicated by increasing vertical distances between isotopic lines in fig. 4 of [4].
Most of the smoothing effect of configuration interaction is missing in macroscopic-microscopic Strutinsky type and in self-consistent mean field calculations. The included pairing correlations seem not to be enough. This might result in calculated submagic gaps and associated kinks which are too large compared to the data. Panel b of fig. 2 shows large kinks at respective proton numbers Z = 112, 114 and 116, predicted by refs. [18], [17] and [2]. The kinks at Z = 114 and 116 were observed before [1, 28].
Finally we mention the -decay chain observed in ref. [19], which is considered a good candidate for originating from 289114 and its sequential decay to 285112 and 281110. The respective average and rms deviations of the predictions of eq. (1) from the measured energies are 847 and 905 keV, which considerably exceed the deviations expected from table II for g.s. transitions. If the above assignments are confirmed, the large deviations might indicate that the decay chain does not go through levels in the vicinity of the g.s.
It might also be worthwhile mentioning that for the conceivable parents 288112 or 291113 which can be obtained from the compound nucleus 292114 by respective or evaporation, the corresponding average and rms deviations of eq. (1) from the measured energies are and 366 keV and and 417 keV, which are more than twice smaller than for the parent 289114.
We thank Stelian Gelberg and Dietmar Kolb for help with the calculations.
REFERENCES
- [1] V. Ninov et al., Phys. Rev. Lett. 83, 1104 (1999).
- [2] S. Ćwiok, W. Nazarewicz and P.H. Heenen, Phys. Rev. Lett. 83, 1108 (1999).
- [3] P. Möller and J.R. Nix, J. Phys. G20, 1681 (1994).
- [4] R. Smolańczuk, Phys. Rev. C56, 812 (1997).
- [5] N.V. Zamfir et al., Phys. Lett. B357, 515 (1995).
- [6] N. Zeldes, Phys. Lett. B429, 20 (1998).
- [7] W.D. Myers and W.J. Swiatecki, Phys. Rev. C58, 3368 (1998).
- [8] S. Ćwiok et al., Nucl. Phys. A611, 211 (1996).
- [9] K. Rutz et al., Phys. Rev. C56, 238 (1997).
- [10] M. Bender et al., Phys. Rev. C60, 034304 (1999).
- [11] A.T. Kruppa et al., Phys. Rev. C61, 034313 (2000).
- [12] S. Liran and N. Zeldes, At. Data Nucl. Data Tables 17, 431 (1976).
- [13] N. Zeldes, in Handbook of Nuclear Properties, edited by D.N. Poenaru and W. Greiner (Clarendon Press, Oxford, 1996), p. 12.
- [14] S. Liran, Calculation of Nuclear Masses in the Shell Model, Ph.D. Thesis, Jerusalem, 1973. (In Hebrew. Unpublished.)
- [15] P.E. Haustein in Atomic Masses and Fundamental Constants 7, edited by O. Klepper, THD-Schriftenreihe Wissenschaft und Technik, Bd. 26 (Darmstadt, 1984), p. 413.
- [16] P. Möller et al., At. Data Nucl. Data Tables 59, 185 (1995).
- [17] P. Möller, J.R. Nix and K.-L. Kratz, At. Data Nucl. Data Tables 66, 131 (1997).
- [18] Y. Aboussir et al., At. Data Nucl. Data Tables 61, 127 (1995).
- [19] Yu.Ts. Oganessian et al., Phys. Rev. Lett. 83, 3154 (1999).
- [20] A.H. Wapstra and N.B. Gove, Nuclear Data Tables 9, 265 (1971).
- [21] G. Audi and A.H. Wapstra, Nucl. Phys. A595, 409 (1995).
- [22] N. Zeldes, Ark. Fys. 36, 361 (1967).
- [23] E. Comay et al. in Int. Conf. on the Properties of Nuclei Far from the Region of Beta-Stability, CERN 70-30 (Geneva, 1970) p. 165.
- [24] W.D. Myers and W.J. Swiatecki, Nucl. Phys. A601, 141 (1996).
- [25] J. Duflo and A.P. Zuker, Phys. Rev. C52, R23 (1995).
- [26] N. Zeldes, M. Gronau and A. Lev, Nucl. Phys. 63, 1 (1965).
- [27] R. Smolańczuk, Phys. Rev. C60, 021301 (1999).
- [28] M. Bender, Phys. Rev. C61, 031302 (R) (2000).
| Coefficient | Value (keV) | ||
|---|---|---|---|
| Original nuclei (1973) | New nuclei (1973-1999) | |||||||
|---|---|---|---|---|---|---|---|---|
| Error | ||||||||
| Data | N | (keV) | (keV) | N | (keV) | (keV) | ratio | |
| 211 | 2 | 126 | 56 (49) | 53 () | 236 (155) | 1.87 (1.23) | ||
| 169 | 1 | 117 | 45 (38) | 12 | 171 (145) | 1.46 (1.24) | ||
| 162 | 121 | 52 (44) | (15) | 184 (148) | 1.52 (1.22) | |||
| 146 | 158 | 51 (44) | (14) | 209 (169) | 1.32 (1.07) | |||
| 174 | 162 | 57 (55) | 220 (220) | 1.36 (1.36) | ||||
(a) Predictions of eq. [1] and of ref. [27].
(b) Predictions of refs. [2,17,18].