Recent results from Pb-Au collisions at
158 GeV/c per nucleon
obtained with the CERES spectrometer
Abstract
During the 1996 lead run time, CERES has accumulated 42 million events, corresponding to a factor of 5 more statistics than in 1995 and 2.5 million events of a special photon-run. We report on the results of the low-mass e+e--pair analysis. Since the most critical item is the poor signal-to-background ratio we also discuss the understanding of this background, in absolute terms, with the help of a detailed Monte Carlo simulation. We show preliminary results of the photon analysis and summarize the results of the hadron analysis preliminarily reported on already at QM’97 [2].
1 Introduction
Since electromagnetic probes have a mean free path which is much larger than the size of the reaction volume of a heavy ion collision, they carry direct information also from the earliest stages of the collision. The CERES spectrometer is optimized to measure low-mass e+e--pairs, including the low pair-p⟂-region which was not accessible in previous dimuon experiments at CERN. Also photons can be detected by the conversion method ( e+e-). The main advantage of dilepton pairs over photons is that they carry invariant mass which helps to distinguish between different production processes, and in particular to observe vector mesons by their direct decay. In order to extract signals from the early stages of the collision, detailed knowledge of the electromagnetic decays of hadrons after freezeout is necessary. Such a reference was provided by measuring the inclusive pair production in p-Be collisions [3]. Together with an electromagnetic calorimeter (TAPS), we have exclusively reconstructed the - and -Dalitz decays. It was found that the inclusive pair yield per charged particle can be fully understood by hadron decays in p-Be collisions as well as in p-Au collisions. It is with respect to this reference that CERES has observed an enhanced pair production, first in S-Au collisions [4] and later also in Pb-Au collisions [5]. The inclusive photon analysis of the S-Au data did not show a significant excess compared to the expectations from hadron decays [6].
2 Experimental Setup
A main experimental problem a dilepton experiment in nucleus-nucleus collisions has to deal with, is the small amount of leptons compared to the huge number of charged hadrons (N/Nch 10-5). This problem is attacked by using two Ring Imaging CHerenkov detectors with a = 32, such that 95% of all charged hadrons do not produce Cherenkov
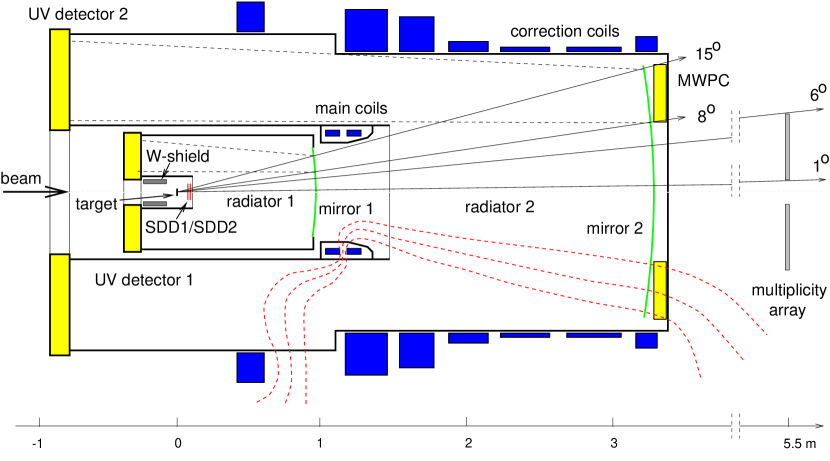

light. As shown in Fig. 1, these RICH detectors are assisted by three external tracking detectors, two Silicon Drift Detectors (SDD1,2) 10 cm behind the target and a Multi-Wire Proportional Chamber (MWPC) at the end of the spectrometer. The signatures of charged-particle tracks are shown in Fig. 2. While the 95 % of all charged hadrons below the Cherenkov threshold are only visible in the external tracking detectors, the pions with a momentum larger than 4.5 GeV/c are also visible in the RICH detectors where they produce a ring the radius of which depends on the relativistic factor of the pion and is significantly smaller than the asymptotic radius. Therefore, pion rings are well distinguished from electron/positron rings, which always have asymptotic radii. The large number of photons per e+e--pair, also of order 105 demanded to strictly minimize the radiation length within the detector acceptance (X/X0 1 %), so that only 1% of the photons convert into a e+e--pair. This is still, together with the decay e+e, the dominant source for dielectron pairs, both producing pairs with a mass smaller than typically 200 MeV/c2 (N(m200MeV/c2 )/N(m200MeV/c2 ) 10-4). Since it is impossible to observe on top of such sources an additional source from an earlier stage of the collision, we are mainly interested in pairs with mass larger 200 MeV/c2. Because of our limited track reconstruction efficiency and our limited acceptance, it occurs very often that from a physical pair only one leg is reconstructed (as indicated in Fig. 2). Two of such partially reconstructed pairs in the same event produce a combinatorial background pair. To avoid this background a more efficient recognition especially of pairs with mass smaller 200 MeV/c2 is required. Therefore the third main idea of the setup is to have three detectors (2 SDD’s and RICH1) which are able to observe the original small opening angle of these pairs which is later used for background rejection. Therefore the shape of the magnetic field is such that up to RICH1 the spectrometer is field-free, between RICH1 and RICH2 the charged particles get a deflection in azimuthal direction and afterwards the field-lines point to the target (see Fig. 1), such that the particles have again straight tracks. The momentum resolution due to detector resolution and multiple scattering is p/p = ((2.3% p)2 + (3.5%)2 )1/2, with p in GeV/c. For a 5 days running period we took data with a slightly changed setup: between the 2 SDD’s we put a 100 m steel foil as photon converter. Photons have a very characteristic signature in this setup (see Fig. 2): they have no hit in the first SDD, a double minimum ionization pulse hight signal in the second SDD, a double ring in the first RICH and two well separated rings in the second RICH accompanied by corresponding hits in the MWPC.
3 Contributions from hadron decays
As already mentioned the contributions of hadron decays to the dilepton and photon yield can be well understood in proton-induced collisions. They depend on the yield of the hadrons, the decay branching ratio and, since we have a limited kinematic and geometrical acceptance, also on the p⟂ and rapidity distributions of the hadrons. Except for the branching ratios all other ingredients are changing when going from proton-induced to lead-induced collisions, as observed by several CERN-SPS experiments:
- •
-
•
The inverse m⟂-slope is systematically increasing with the mass of the hadron [11], which is a hint for radial flow. The functional behaviour is:
inverse m⟂-slope (masshadron) = 0.175 MeV + 0.115 MeV/GeV masshadron -
•
While the widths of the hadron rapidity distributions decrease with particle mass in proton induced collisions, this is not observed in lead induced collisions [12].
All these observed changes are implemented in the generator simulating the contributions of hadron decays and all the data shown in this paper are compared to the outcome of this generator. Compared to the pure p-p cocktail used previously this generator predicts a 30% larger yield for m 0.2 GeV/c2 (see Fig. 5). For the photon yield the correct description of the distributions in our acceptance is most important, since the decay dominates the yield (see Fig. 8).
4 Low-mass e+e--pair analysis
The main challenge in the low-mass pair analysis is to reject the partially recognized pairs with small opening angle (as indicated in Fig. 2), while keeping a high reconstruction efficiency for pairs with large opening angle [13]. To understand the sources of background quantitatively, we have done a detailed MC simulation using a generator for the composition of the sources and the decay kinematics. The trajectories of these particles are traced through a GEANT simulation of our spectrometer. The resulting dE/dx and Cherenkov photon signal is then digitized in the same way as the data. The results are overlaid on real events, such that they can be analyzed in the same way as the data. Doing this for conversions and -Dalitz decays on one hand and for pairs with masses larger 200 MeV/c2 on the other hand, one obtains an objective tool to optimize the cuts.

The rejection power of these cuts can be seen from Fig. 3 where the absolute contributions of all background sources are followed in chronological order over the different rejection steps. The most important rejection steps are called ”dE/dx” and ”conversion” which use the property of the two SDD’s to show a double amplitude for two very close tracks and ”dalitz” which tries to identify close pairs by a close partner ring in RICH1. The MC simulation is compared with the observed background in the data. The data follow very well the trend of the simulation even in absolute terms. At the end of all steps the signal-to-background ratio for pairs with mass larger 200 MeV/c2 is 1/13, with a mean reconstruction efficiency of 13%. The signal is extracted by subtracting the number of like-sign pairs from the number of unlike-sign pairs. By doing this one has to be sure that the combinatorial background is equal in these two samples. This has been verified on the data by reversing all rejection cuts, such that one obtains a ”clean” background sample. This study indicates, that we can exclude an asymmetry of more than 1% with a 90% confidence level.
4.1 Results
Fig. 5 shows the resulting invariant mass distribution of the observed pair yield in comparison to the expectations from hadron decays. As previously reported by CERES we again observe an enhanced dilepton production in the mass window starting around 200 MeV/c2 up to the peak. For comparison the earlier results [5] are also shown. The centrality selection of the two data sets is slightly different, the mean number of charged particles per unit of rapidity is N = 250 and 220 for ′96 and ′95, respectively. The enhancement factor defined by N/N within the mass range 0.25 m 0.7 GeV/c2 is 2.6 0.5 (stat.) 0.6 (syst.) for the ’96 data.
![[Uncaptioned image]](/html/nucl-ex/9910015/assets/x4.png)
![[Uncaptioned image]](/html/nucl-ex/9910015/assets/x5.png)
The pair yield as a function of the accompanying number of charged particles may be used as a tool to disentangle different production mechanisms for the pairs. This dependence is shown in Fig. 5 where the ratio between the measured and generator pair yield is shown as a function of multiplicity. Since the expectations from decays of produced hadrons grow linearly with the multiplicity, a constant enhancement indicates a linear dNch/d dependence. Such ’normal’ behaviour is displayed by the Dalitz decays dominating the two lowest mass bins in Fig. 5, where we do not observe an enhancement. In contrast, in the mass bin 0.25 MeV/c2 m 0.68 MeV/c2 where the strongest


enhancement is observed, the pair yield grows stronger than linear. We also observe that the enhancement is most pronounced for pairs with a small transverse momentum (see Fig. 6). While for pairs with p 500 MeV/c we observe an enhancement 5 1.5 for the ’96 data, we find only a very modest enhancement under the complementary conditions. This enhancement is consistent with the small enhancement in the low-mass region reported by the muon experiments [8, 14] which have no acceptance for low p⟂. In comparison with the previously published data the new high-statistics analysis show a statistically consistent but systematically somewhat smaller yield. Therefore we studied the stability of the result as a function of the background-to-signal ratio for different cut-tuning strategies of the two data samples. The results are summarized in Fig.7. First of all, the results of the ’95 sample are seen to vary considerably between the two choices of cut-tuning strategies, whether one tunes the cuts partially on the data (which was done historically) or with the MC (as described above). These variations are much smaller in the ’96 sample which is simply a fact of the larger statistics. Much more important is, that the signal is stable and does not increase with the B/S ratio. This makes very unlikely the hypothesis, that the observed enhancement is due to a incorrectly subtracted background. Another stability test we did was operating our spectrometer with different polarities of the magnetic field. Both polarities show the same result within the statistical errors.
5 Search for direct photons
Out of 2.5 million events we reconstructed 34 000 photons which converted into electron pairs in the converter foil between the two silicon drift detectors. Due to the clear signature shown in Fig. 2, the background is negligible here [15].
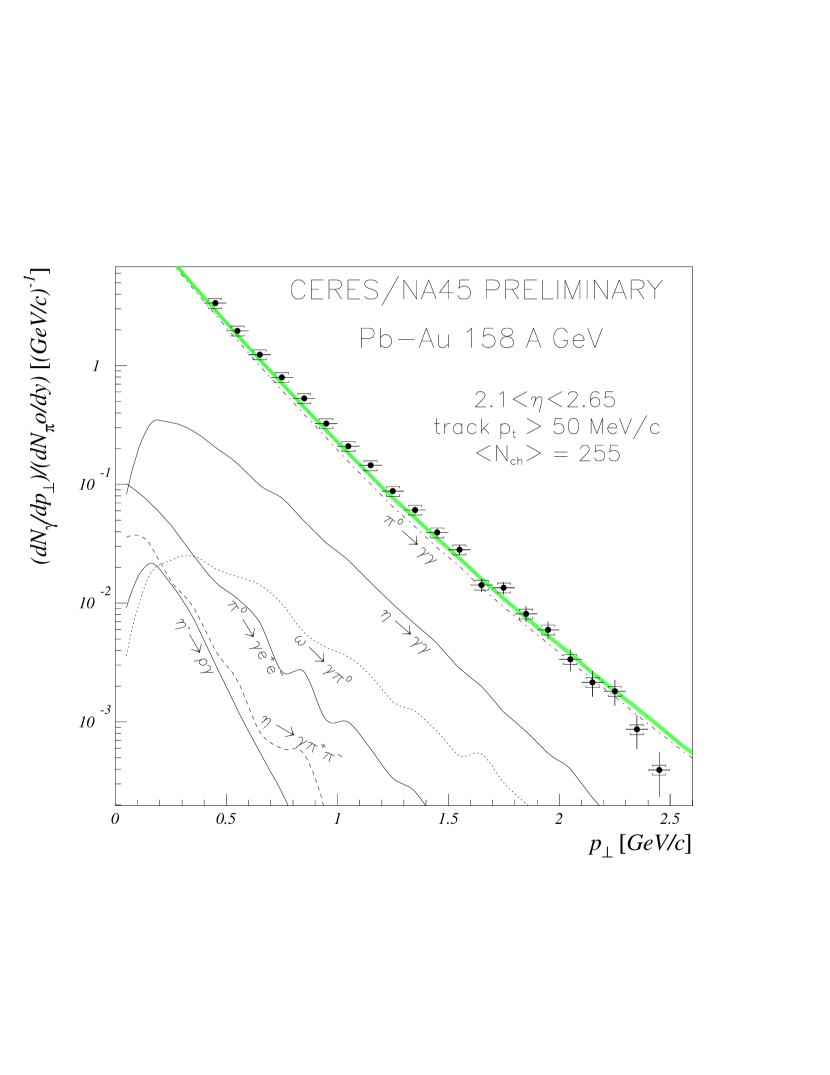
Before obtaining the p⟂ distribution one has to correct the data for detector inefficiencies and momentum resolution. This correction is obtained with the same MC simulation used for the low-mass pair analysis. The corrected p⟂-distribution is shown in Fig. 8. The lower bound of 400 MeV/c is due to the poor efficiency for very low-momentum (large-deflection) tracks, while the upper bound is due to limited statistics. In this interval the data closely follow the expectations from hadron decays. It is the challenge of the photon analysis to do the normalization of both yields as accurately as possible and to minimize the systematic errors such that one is sensitive to an additional source on the per cent level (corresponding to a low-mass pair enhancement on top of the -Dalitz peak). The normalization is done with respect to the number of photons counted per in the same acceptance with a p⟂ 400 MeV/c. Therefore we need to know the -p⟂-distribution for our centrality and acceptance. This can be at best estimated from our measured h--spectrum (as described below) by correcting it for contributions from , K- and secondaries from the 3 decay. In addition we have also investigated charged pion and uncharged pion distributions from other SPS experiments; these serve to estimate the systematical errors connected with our choice. As indicated in Fig. 8 the statistical errors of the measurement are negligible. More critical are the systematic errors due to the Monte Carlo correction (6.3 %), the uncertainty in the absolute normalization (6.6 %) and the uncertainty of the conversion length (2.6 %). The expectations from hadron decays also contain a systematic error originating from the uncertainty in the p⟂ distribution and the / ratio (4 %). Within these errors we obtain a non-significant excess for photons with p⟂ 400 MeV/c of (Nγmeasur.-Nγhadr.)/Nγhadr. = 12 % 0.8%stat 10.9%syst.. Within the errors this excess is constant as a function of multiplicity. Further studies will verify this result with an independent data sample taken with a different magnetic field, to reduce thereby the systematic uncertainties.
6 Hadron analysis
As indicated in Fig. 2, we use two independent methods of reconstructing charged hadrons [16]. First we can reconstruct low-momentum hadrons by matching tracks in the SDD’s to hits in the MWPC and determine the momentum by the deflection between them. This method suffers from the large background

(S/B = 2:1), which is determined by the event-mixing method. The second method is sensitive to pions with p 4.5 GeV/c, since these pions emit Cherenkov light. The Cherenkov ring radius is used for the momentum determination. The p⟂-slopes of both methods show a very good agreement in the overlapping region (see Fig. 9). In the region 1.5 p⟂ 3.5 GeV/c of the inclusive spectra, the inverse slope is 245 5 MeV and increases by 2.4 % with increasing centrality, in the range of the most central 35% of the geometric cross section. Identified and show the same slope and the ratio / = 1.030 0.005 for 1 p⟂ 2.4 GeV/c. Compared to our previous pion analysis done for S-Au collisions the inverse slope as a function of m⟂ does not follow the systematics of the Cronin effect, since the slope at small m⟂ is much higher. This is a hint for radial flow in Pb collisions already observed by other experiments [17]. We also studied anisotropic transverse flow by using only the SDD’s in terms of a Fourier decomposition of the azimuthal charged multiplicity distribution. Our preliminary results show an anisotropic flow up to the 4th harmonic, with the higher harmonics having nearly the same strength than the first two.
7 Conclusion and Outlook
We have corroborated the low-mass pair enhancement previously observed by CERES.
This enhancement is most pronounced in the mass window from
200 m 700 MeV/c2,
at low p⟂ and in events with a high charged particle multiplicity. In order to draw
final conclusions on whether these data exhibit a signal for the
restoration of chiral symmetry
[18] better data are necessary. Therefore CERES has upgraded with a TPC installed
at the downstream end of the present spectrometer [19]
to improve the signal-to-background ratio and the mass resolution. This
TPC was first tested in 1998 [20]. CERES will continue
data taking in the
next two years with higher statistics and at two different beam energies
(40 and 158 GeV per nucleon).
The authors wish to thank the CERN staff for the good support.
We are grateful for the financial support by the German BMBF, the US DoE,
the MINERVA foundation, the Israel Science Foundation and the EC under
contract FMBICT972104.
References
- [1]
- [2] F. Ceretto et al. (CERES-Collaboration), Nucl. Phys. A638 (1998) 467c.
- [3] G. Agakichiev et al. (CERES/TAPS-Collaboration), Eur. Phys. J. C4 (1998) 231.
- [4] G. Agakichiev et al. (CERES-Collaboration), Phys. Rev. Lett. 75 (1995) 1272.
- [5] G. Agakichiev et al. (CERES-Collaboration), Phys. Lett. B422 (1998) 405.
- [6] R. Baur et al. (CERES-Collaboration), Z. Phys. C 71 (1996) 571.
- [7] T. Peitzmann et al. (WA98-Collaboration), proceedings ICHEP98, Vancouver (1998).
-
[8]
D. Jouan et.al. (NA50-Collaboration), Nucl. Phys. A638 (1998) 483c.
A. de Falco et.al. (NA50-Collaboration), Nucl. Phys. A638 (1998) 487c. - [9] F. Pühlhofer et.al. (NA49-Collaboration), Nucl. Phys. A638 (1998) 431c.
- [10] P. Braun-Munzinger, I. Heppe, J. Stachel, nucl-th/9903010.
- [11] J. Stachel, to be published in proceedings INPC’98, Paris, Nucl. Phys. A (1999)
- [12] C. Höhne et.al. (NA49-Collaboration), these proceedings
- [13] B. Lenkeit, Doctoral Thesis, Heidelberg (1998).
- [14] A. Angelis et.al. (HELIOS/3-Collaboration), CERN-EP/98-82
- [15] M. Messer, Doctoral Thesis, Heidelberg (1998).
- [16] F. Ceretto, Doctoral Thesis, Heidelberg (1998).
- [17] H. Appelshäuser et.al. (NA49-Collaboration), Eur. Phys. J. C2 (1998) 661.
- [18] R. Rapp, these proceedings.
- [19] Addendum to proposal SPSLC/P280: CERN/SPSLC 96-35/P280 Add.1.
- [20] A. Marin, these proceedings.