Elliptic flow of and Mesons
in Heavy-Ion Collisions at 2 AGeV
Abstract
Azimuthal distributions of and mesons emitted at midrapidity in collisions of 1.9 AGeV 58Ni+58Ni and 2 AGeV 40Ca+natCa are studied as a function of the number of projectile-like spectator nucleons. The observed anisotropy corresponds to a negative elliptic flow signal for mesons, indicating a preferred emission perpendicular to the reaction plane. In contrast, only small azimuthal anisotropies are observed for mesons. This may indicate that mesons freeze out earlier from the fire ball than pions.
1 Introduction
Heavy-ion collisions at incident energies of 1-2 AGeV (Bevalac/SIS energy regime) are a unique tool to study nuclear matter at high density and temperature. According to various theoretical model calculations [1, 2, 3] nuclear matter can be compressed to 2-3 times the normal nuclear density and heated to temperatures in the order of 100 MeV in this energy regime. In addition, a fraction of 10-30 of the participating nucleons is excited to short-lived resonance states, mainly and resonances, which subsequently decay via meson emission [4, 5]. Thus the meson observables can provide information on the dynamical evolution of the resonance population in compressed and excited nuclear matter.
The production and decay of the resonance is responsible for the production of pions, which are the most abundantly produced secondary particles in the 1-2 AGeV energy regime [6, 7, 8]. A clean signature for the excitation of a high lying resonance is the detection of mesons [5]. They originate almost exclusively from the decay of the resonance and thus are sensitive to the abundance of this resonance [9, 10]. After the initial production through resonance decays, pions and mesons strongly interact with the surrounding hot nuclear matter in the interaction region and in cold spectator matter. The interactions in hot nuclear matter are the result of a complex cyclic process of generation, absorption, and re-emission of mesons [3, 10], while in cold nuclear matter absorption dominates. These processes will influence experimental observables like the meson abundance as well as the azimuthal angle distributions of mesons with respect to the reaction plane.
Azimuthal anisotropy in the emission of pions in symmetric as well as in asymmetric non-central heavy-ion collisions is a clearly established effect and was observed in a wide range of beam energies from 0.1 A GeV to 160 A GeV [11] – [23]. Similar to the anisotropy of baryons [24], the effect is usually discussed in terms of directed and elliptic flow [25, 26]. In a Fourier expansion of the azimuthal angle distribution of particles ) with respect to the reaction plane
| (1) |
the first term () corresponds to the directed flow, while the second term () represents the elliptic flow [26]. At midrapidity the directed flow of emitted particles vanishes for symmetry reasons and only the elliptic flow is present [25].
In the Bevalac/SIS energy regime the elliptic flow of participant baryons emerging from the collisions at midrapidity was found to be oriented perpendicular to the reaction plane (negative elliptic flow, ) [15, 27, 28, 29]. This effect was interpreted as a dynamical squeeze-out of nuclear matter due to the build-up of pressure in the interaction zone between two colliding nuclei [30]. Similar to baryons, negative elliptic flow was observed for high transverse momentum neutral and charged pions emitted at midrapidity in 1 AGeV Au+Au collisions at SIS (GSI) [16, 17]. However, the observed pion anisotropy was not been attributed to the expansion of nuclear matter, but rather to the strong final state interactions of pions with cold spectator matter transiently concentrated in the reaction plane (”shadowing”). Consequently, the chance for pion absorption is higher in the reaction plane than out-of-plane [31, 32]. The negative elliptic flow of high energy pions observed in the Bevalac/SIS energy regime indicates that they freeze-out while the spectators are still close to the participant zone [33]. At ultrarelativistic energies the time required for spectator fragments to pass the reaction zone (passage time) is so short that the shadowing effect is reduced. In this case the geometry of the participant zone favors the preferential in-plane emission of pions [25, 34, 35] and hence positive elliptic flow, which was observed recently at AGS [21] and SPS [22, 23] energies. However already at SIS in-plane emission of low energy pions were observed, see [16]. Hence similar scenario can hold for low energy pions even at SIS energies.


The elliptic flow of pions is well established and can qualitatively be described in the frame of transport model calculations [31, 32, 34, 35], but the elliptic flow of mesons has not been observed before. While the absorption of pions in hot nuclear matter proceeds via the (1232) resonance which decays dominantly by pion emission, only about 50 of all N∗(1535) resonances excited by -meson absorption will reemit mesons [10]. However, the mean free path of both mesons in cold nuclear matter is comparable [36, 37]. Therefore, a comparison of the - and -elliptic flow may yield information on the propagation of these mesons, as well as on the dynamics of the parent baryon resonances.
Moreover, and mesons can be measured simultaneously in the same experiment via their two-photon decay channel (branching ratios: 39.3 and 98.8 for and , respectively [9]). Below we present results of the first experimental study of azimuthal distributions of mesons emitted in collisions of 1.9 AGeV 58Ni+58Ni and 2 AGeV 40Ca+natCa nuclei and compare them with azimuthal distributions of mesons in the same colliding systems.
2 Experiment
The experiments were performed at the Heavy-Ion Synchrotron SIS at GSI Darmstadt. The experimental setup is sketched in Fig. 1. In the first experiment a 1.9 AGeV 58Ni beam with an intensity of particles per spill (spill duration 8 s and repetition rate 15 s) was incident on a 58Ni target (502 mg/cm2). In the second experiment, a natCa target (320 mg/cm2) was bombarded by a 40Ca beam with kinetic energy 2 AGeV and an intensity of particles per spill (spill duration 10 s and repetition rate 14 s).
Photon pairs from the neutral-meson decay were detected in the Two-Arm Photon Spectrometer (TAPS) [38]. This detector system consisted of 384 BaF2 scintillators arranged in 6 blocks of 64 modules with individual Charged Particle Veto detectors (CPV) in front of each module. The blocks were mounted in two towers positioned at 40∘ with respect to the beam direction at the distance of 150 cm. Three blocks were positioned in each tower at +21∘, 0∘ and -21∘ with respect to the horizontal plane. In this setup, only neutral mesons around mid-rapidity were detected. The geometrical acceptance of TAPS for the and detection was roughly .
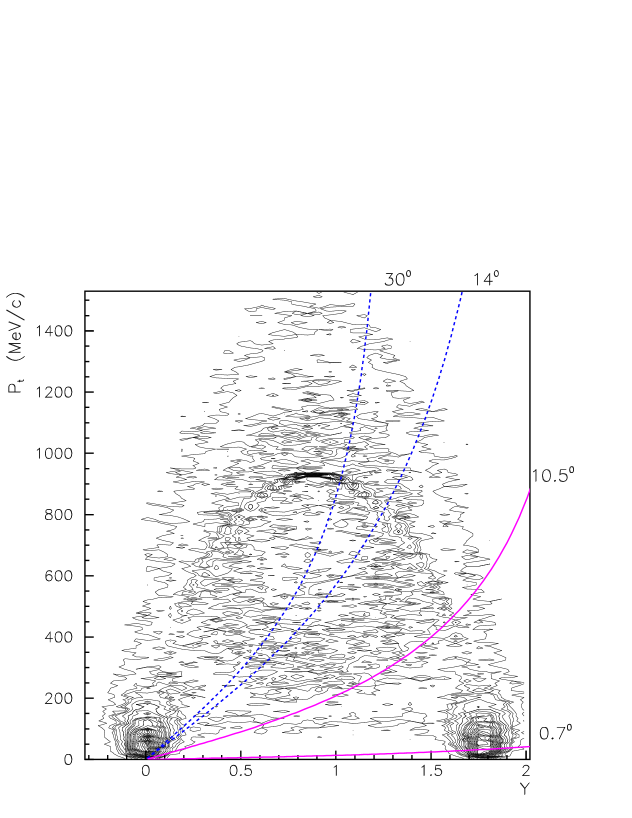
An in-beam plastic scintillator (BC-418) of 200 m thickness was used to provide a time-zero signal for the time-of-flight measurements as well as to count beam particles. The plastic Forward Wall (FW) of the KaoS collaboration, see [39], comprising 380 plastic scintillators (BC408) was positioned 520 cm downstream of the target. The modules have a thickness of 2.54 cm with sizes 4x4 cm2 in the center, followed by 8x8 cm2 and 16x16 cm2 elements in the outer region. Four modules in the center of the wall are removed for a beam pipe made of a carbon fibre tube (diameter 70 mm, thickness 1 mm). The actual measurements were performed with 320 detectors to obtain a nearly azimuthally symmetric coverage. In this arrangement the FW covered the polar angles from 0.70 to 10.50. Particles emitted in this angular range are predominantly projectile-like spectator nucleons, see Fig. 2. The FW provided the information on emission angle, multiplicity, charge and time-of-flight of protons and light charged fragments up to Z=8, see Fig. 3.
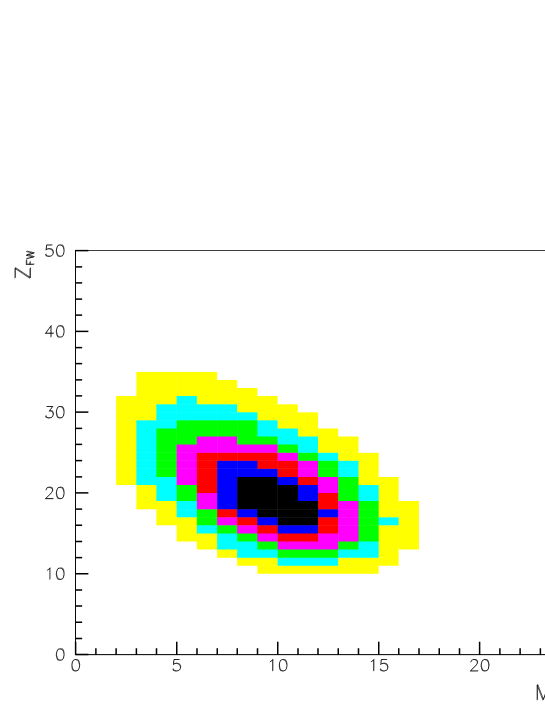
The reaction detector, comprising 40 small plastic scintillators (NE102A), was positioned close to the target and covered the polar angles from 14∘ to 30∘. Most of the particles emitted in this angular range are participant nucleons, see Fig. 2. For the selection of events according to the reaction centrality and for the estimation of the average number of projectile-like spectator nucleons the information from the reaction detector and the FW were used. The performance of these two detectors is shown in Fig. 4, where the total charge ZFW of the particles detected by the FW is plotted as a function of the charged-particle multiplicity Mreact in the reaction detector, measured in coincidence with two neutral hits in different blocks of TAPS.
Events were selected according to the reaction centrality by requiring equal statistics of mesons in each bin, ranging from peripheral reactions with low multiplicity Mreact to central reactions with high multiplicity Mreact. The total charge ZFW of particles detected by the FW allowed us to estimate the mean number of projectile-like spectators for each studied bin in Mreact as determined by the reaction detector. We used the relation
| (2) |
where and are the mass number and charge of the projectile, respectively. The distributions of the total charge are shown in Fig. 5 for both the Ni+Ni and Ca+Ca collisions. The resulting values of the mean number of projectile-like spectators are listed in the Table 1. The systematic error of the values was found [41] to be less than 4 units.
| Reaction | 58Ni+58Ni at 1.9 A GeV | 40Ca+natCa at 2 GeV | |||
| Mreact | 2 - 6 | 7 - 10 | 11 | 1 - 3 | 4 |
| 51 | 44 | 37 | 34 | 28 | |
Neutral-meson candidate events were selected by special triggers exploiting
the kinematical constraints of meson decay into photons. For each TAPS block the
hit information for the BaF2 signals above a certain threshold energy and for
the corresponding CPV modules were fed to a multiplicity/pattern unit. This unit performed an
on-line selection of events induced either by a charged particle (if the BaF2 scintillator
and the corresponding CPV module have fired simultaneously) or by a neutral particle
(if the BaF2 scintillator has fired without a corresponding CPV signal).
For the analysis of the present data the following triggers were chosen:
For the reaction 40Ca+natCa at 2.0 A GeV the event-selection trigger required
a) hits with an energy E15 MeV in any two TAPS blocks for the measurement, and
b) at least one neutral hit in each tower with an energy E90 MeV for mesons.
For the reaction 58Ni+58Ni at 1.9 A GeV the trigger required
a) one neutral hit with an energy E90 MeV and one hit with an energy E15 MeV in any
two TAPS blocks for a candidate, and
b) two neutral hits with an energy E90 MeV in any two TAPS blocks for selection of
meson candidate events.
In addition, all triggers mentioned above required the coincidence with a signal from the
reaction detector and the FW.
In both reactions downscaled data were taken corresponding to minimum bias trigger requiring
coincidence between the reaction detector and the FW.
3 Data Analysis and Simulation
3.1 Reaction-plane determination
The study of event anisotropy requires the determination of the orientation of the reaction plane. With respect to this plane the preferred emission of some subset of particles can be analysed. The reaction plane was determined by a modified version [42] of the transverse-momentum method [43]. For each event the reaction plane was defined by the incident beam direction and the vector , which is the weighted sum of the transverse momentum vectors of all charged particles detected in an event. Since almost all particles detected by the FW have nearly the same velocity (see Fig. 3.), the transverse velocity vector will be oriented parallel to the position vector of the particle in the x-y plane (perpendicular to the beam direction) of the FW. Here it is assumed that the beam position in the plane of the FW is (0,0). Therefore, in our analysis the vector is defined as
| (3) |
where the sum runs over all particles detected by the FW in the event, is the position vector of particle in the x-y plane and is the weight factor, which depends on the rapidity of the emitted particle. Since the coverage of the FW excludes nearly all particles with the position vectors in Eq. 3 will be summed with a positive weight . In order to provide the best reaction plane resolution the weight factor was chosen to be =, where is the charge of particle detected by the FW.
Since the coverage of the FW does not overlap with the TAPS spectrometer (used for the neutral meson reconstruction), the analysis of azimuthal angle distributions of and mesons with respect to the reaction plane is free from autocorrelation effects. The analysis of azimuthal anisotropies is rather sensitive to different kinds of experimental biases, which could simulate an event anisotropy. Such artificially created anisotropies can be removed by requiring the distribution of the reaction plane to be isotropic for unbiased events. The off-line data analysis revealed that the actual beam position in the plane of the FW with respect to the geometrical center of the FW varied with time. Consequently, the distribution of the reconstructed reaction-plane angle is not flat. This effect required a correction of the vector for each particle in an event. The offset values (, ) were determined by averaging over event samples in fixed time intervals. The required corrections (, ) stayed below 1 cm. As an example of this procedure, Fig. 6 shows the distributions of the reaction-plane angle () for peripheral () Ni+Ni reactions at 1.9 AGeV before and after including the beam-offset correction. The corrected distribution (Fig. 6b) is free from significant distortions which could influence the study of azimuthal anisotropies.
3.2 Reaction-plane resolution


Because of finite multiplicity fluctuations, the azimuthal angle of the vector can differ from the azimuthal angle of the true reaction plane by a deviation . For corresponding coefficients and of Fourier expansion of azimuthal angle distribution of particles with respect to the ”true” reaction plane then holds = / and = /.
For the determination of these corrections we follow the procedure as detailed in ref. [44, 45]. The distribution of can be presented as a function of a single dimensionless parameter which measures the accuracy of the reaction-plane determination. For a large sample of events within the same centrality window, according to the central limit theorem, the fluctuations of the length of the reaction-plane vector around its average value, , are distributed as a Gaussian:
| (4) |
The fluctuations with standard deviation are assumed to be isotropic since the azimuthal anisotropies are small. The dimensionless parameter = scales with the particle multiplicity like . Integration of Eq. 4 over both and yields the value , which will be used later for the correction of the measured azimuthal anisotropies. According to the ”Ollitrault method” we find:
| (5) |
where is the modified Bessel function of the order k.
Fig. 7 shows the variations of the first two correction coefficients for n=1 (correction for the directed flow signal) and n=2 (correction for the elliptic flow signal) with .
In order to determine the parameter we randomly divided the hits in each event into two subgroups containing each one half of the number of particles. For each of the two subevents one can construct according to Eq. 3 the two independent vectors and , respectively, and extract the angle = between the two vectors. Fig. 8 shows the distribution of the relative azimuthal angle .
The ratio of events with to the total number of events allows to determine the parameter from Eq. 6:
| (6) |
Alternatively, these corrections can be estimated by the adapted [46] – [48] transverse-momentum method of Danielewicz and Odyniec [43]. First, we determined the average of the weighted unit vector of transverse velocity of each charged particle, projected on the reaction plane. The orientation of the reaction plane is estimated by the vector , determined here by excluding the considered charged particle in order to remove autocorrelations:
| (7) |
Then, we calculated the average of the unit vector of transverse velocity projected on the ”true” reaction plane,
| (8) |
The corrections due to finite reaction-plane resolution for the directed-flow signal (n=1) and the elliptic-flow signal (n=2) can be determined from the following equations:
| (9) |
| Reaction | 58Ni+58Ni at 1.9 A GeV | 40Ca+natCa at 2 GeV | |||
| Mreact | 2 - 6 | 7 - 10 | 11 | 1 - 3 | 4 |
| 43∘ | 46∘ | 50∘ | 52∘ | 55∘ | |
| 0.37 | 0.32 | 0.26 | 0.22 | 0.19 | |
| 0.33 | 0.28 | 0.23 | 0.18 | 0.16 | |
Our further analysis was restricted to a sufficient vector length in order to reject the most central events lacking spectator flow. This selection rejects 25 of all registered events. The resulting values of the correction coefficient for the elliptic-flow signal due to finite reaction-plane resolution , determined by both methods, are given in Table 2 for each bin in hit multiplicity Mreact of the reaction detector for both systems studied. The systematic error of these values was estimated from the difference and is found to be less than 15. We also studied the influence of the cut on these values. The removal of the cut leads to decrease in the correction value, see left panel of Fig. 8. and Eq.6. But simultaneously also deduced values of decrease and hence the values remain unchanged.
For comparison with previous studies we calculated also reaction plane resolution , where standard deviation is extracted from a Gaussian fit to the distributions. Reaction plane resolution varies between and depending on the reaction centrality and the colliding system (see Table 2). These values agree with published data from studies of charged-baryon flow in similar colliding systems [43, 49]. Moreover, the the directed flow of charged baryons in the target-like rapidity region was observed for both colliding systems (see Appendix A). This verification demonstrates the quality of the reaction-plane determination.
3.3 Photon-particle discrimination
Efficient photon-particle discrimination in TAPS can be achieved by the combination of three methods [51] – [54]:
- 1)
-
The anticoincidence between the BaF2 and the corresponding CPV was required to discriminate charged particle hits.
- 2)
-
The time-of-flight analysis allowed to separate photons from massive particles (with non-relativistic velocities).
- 3)
-
The pulse-shape of the BaF2 energy signal was analyzed. The scintillation light in the BaF2 crystal exhibits two components with different time constants , one fast (=0.6 ns) and one slow (=620 ns). The intensity ratio of fast to slow component depends on the ionization density of the incident radiation: it is larger for leptons (electrons following photon interactions) than for other charged particles (p,d,t,…). The pulse-shape (PSA) parameter is defined as the angle = , where Eshort is the fraction of energy obtained by integrating the analog signal within the first 30 ns, and Etotal is the total energy obtained by integrating the analog signal within 2s. Fig. 9a presents a two-dimensional graph of Eshort versus Etotal for all BaF2 modules, and the distribution of the corresponding PSA parameter is shown in Fig. 9b. The separation between photons and charged particles is obvious.

3.4 Shower reconstruction by cluster analysis
Hadrons, like protons and charged mesons, lose their energy by excitation and ionization. On the other hand, high energy photons impinging on TAPS crystals generate an electromagnetic shower which fires several neighbouring detector modules. Therefore, the reconstruction algorithm to separate photons and hadrons and to recover position and energy of the incident photon is based on defining a shower as a continuous cluster of individual responding detectors [52, 54, 55, 56]. In the first step, the fired detector modules are sorted according to the deposited energy. The combination to clusters starts with the detector which indicates the maximum energy deposit in a block of crystals above a certain energy threshold Ehigh (typically 20 MeV). This so-called central detector is combined with all directly neighbouring detectors (maximum 6 modules in the first ring of neighbours). However, these modules are only accepted in the cluster if the time difference between the neighbouring and the central module is within the allowed time window and an energy deposition above the lower threshold Elow (typically 3 MeV) is encountered. If the sum energy of this minimal cluster exceeds a threshold of typically 400-500 MeV or if the fraction of the energy deposited in the central module is lower than 60-70 of the sum energy, then the second ring of neighbouring detectors (up to 12 modules) is inspected for addition to the existing cluster. All allocated detectors are then removed from the detector hit pattern and the cluster search continues with the remaining highest-energy module. This procedure limits the cluster size to a maximum of 19 detector modules which is, however, sufficient to reconstruct even the highest energy photons encountered in this experiment.
In the second step the characteristics of all modules within a cluster were compared to distinguish different types of showers. The cluster is called a photon-like cluster if:
- 1.
-
the hit in the central detector is neutral, i.e. no CPV signal was found in the corresponding CPV module or the CPV’s of the neighbouring detectors.
- 2.
-
the pulse shape corresponds to the hit of a photon (see Fig. 9).
- 3.
-
the time-of-flight is within the prompt time window. The neighbouring energy deposition is added only if the neighbours also have photon-like characteristics.
The average particle occupancy in TAPS reaches values of 7 per module. This leads to a finite probability that the clusters in the TAPS block are connected or partly overlapping. However, in general connected or overlapping clusters have a second maximum and there will be more energy deposited in the second ring as is expected from a single hit. The clusters with a second maximum were removed from the further analysis. The energy of the cluster results from the sum of energies deposited in the individual detectors, and the direction of the incident photon is reconstructed from an energy-weighted sum over the vectors pointing from the target to each responding detector from the cluster [57].
| (10) |
Parameter controls the importance of the positions of the neighbouring modules with respect to the position of the center module.
3.5 Neutral-meson reconstruction
Neutral pions and -mesons can be detected by the measurement of their two-photon decay, which still carries the signature of the meson in its invariant mass. For each pair of detected photons in a given event we calculated the invariant mass and the momenta using the following relations:
| (11) |
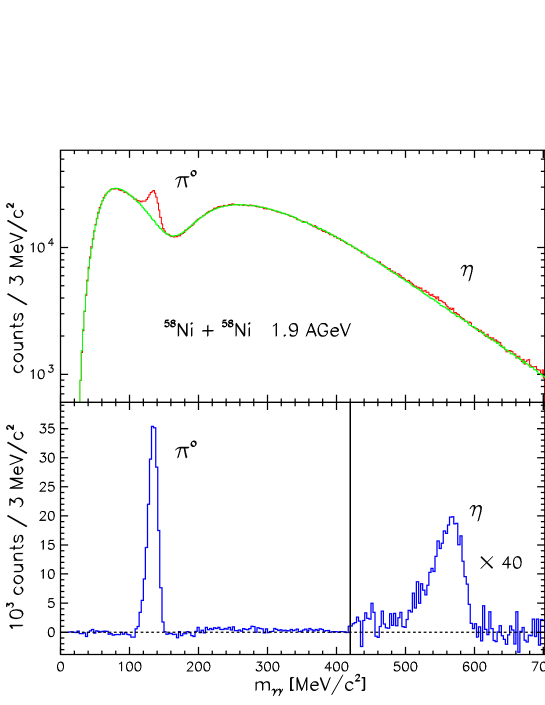
where , and , are the energies and momenta of the corresponding photons, and is the opening angle of the photon pair. We analysed only neutral mesons in a narrow rapidity window ( 0.1). The resulting invariant-mass distributions (Fig. 10 – 12) reveal peaks centered at values of the - and -meson rest mass. These peaks are located on top of a large combinatorial background which originates from uncorrelated photon pairs.


The high particle multiplicity in heavy-ion collisions, limited acceptance and the detector efficiency usually lead to very low signal-to-background ratios, especially at lower transverse momenta. Therefore, the precise knowledge of the shape and magnitude of the combinatorial background is required for a reliable evaluation of the neutral-meson peak contents. The analysis quality can be improved by increasing the purity of the photon sample, i.e., by reducing the combinatorial background. Therefore, all cuts in the pulse-shape analysis and cluster reconstruction scheme were optimized for a maximum signal-to-background ratio in the invariant-mass spectrum. The resulting signal-to-background ratios for the studied bins in reaction centrality Mreact and transverse momentum pt are listed in the Table 3 for both reactions studied. If the background has a monotonous falling or rising shape it will not be difficult to approximate the shape of the background with an analytic function. However, usually the artificial structure in the invariant-mass spectra created by limited detector acceptance could not be reproduced by any analytical fit of the background.
| Reaction | 58Ni+58Ni at 1.9 A GeV | 40Ca+natCa at 2 GeV | |||
| Mreact | 2 - 6 | 7 - 10 | 11 | 1 - 3 | 4 |
| pt (MeV/c) | |||||
| 0 - 600 | 3.9 | 3.1 | 2.5 | 8.9 | 4.5 |
| 0 - 200 | 9.5 | 6.2 | 4.3 | 15 | 10 |
| 200-400 | 21 | 13 | 9.2 | 36 | 24 |
| 400-600 | 61 | 33 | 24 | 99 | 65 |
| 600-800 | 83 | 47 | 36 | 140 | 110 |
3.6 Method of event mixing
Since the combinatorial background consists of pairs of uncorrelated particles, the natural way of its reconstruction is the use of the so-called ”event-mixing” technique by combining photons randomly selected from different events [58] – [60]. This method is based on the assumption that photons from different events are not correlated. Therefore, the mass signals ( , -mesons) are absent when we construct a two-photon invariant mass distribution by taking photons from different events. This procedure automatically takes into account the detector acceptance and the detection efficiency. Such combinations can be formed in large numbers, so that the combinatorial background can be determined with high statistical accuracy. Then the background distribution is normalized outside of the meson-mass window to the measured invariant-mass distribution and subtracted from the latter. The meson-peak contents can be extracted from the background-free invariant-mass spectra by integrating within the meson-mass window.
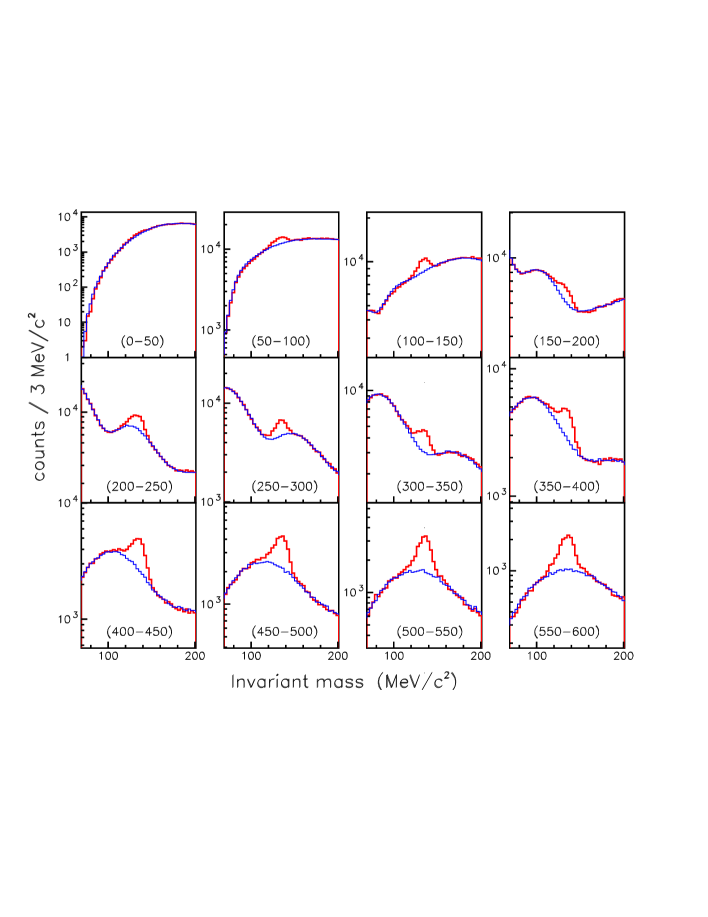
However, for a perfect description of the combinatorial background special care has to be taken to ensure that the data and background distributions are generated for the same class of events with very similar event characteristics. Therefore, only photons from the same event class may be mixed. An event class is defined by the analysed trigger TRG and the photon multiplicity Mγ found in the event. Including the constraint on Mγ in the event classification is important as the signal-to-background ratio (S/B) depends on Mγ [61]. The phase-space distribution of the mixed photon pairs must correspond to the measured ones. The phase space covered by TAPS allows the identification of neutral mesons emitted in a narrow window around midrapidity only. As a result, the transverse momentum of the photon pair can classify the phase space allocation. Therefore, if one divides the photon pairs in the classes according to TRG and Mγ into groups according to their transverse momenta pt, an identical phase space allocation for mixed and measured pairs can be expected. As an example, Fig. 13 shows the invariant-mass distributions for different pt-classes and the photon-multiplicity class Mγ=2 ( trigger for the experiment Ni+Ni at 1.9 A GeV). The normalized combinatorial background is shown as a dashed line together with the histogram for the experimental data in each case. The spectral form of the distributions varies strongly with the transverse momentum which reflects the opening angle acceptance of TAPS.
Subsequently, the mixed photon pairs were selected to have an opening-angle distribution close to the opening angle of the original pair. This selection can be implemented by an additional classification according to the TAPS block combination. However, the initial concept of a good reproduction of the phase-space occupancy of the invariant-mass distribution in the combinatorial background by the method of event mixing can still suffer in some cases. Besides the true correlations due to the neutral-meson decay there are some additional correlations due to reaction dynamics or detector effects. These correlations are also destroyed by event mixing and therefore are not removed from the data.
In a mixed event two photons can be very close to each other in space. In a real event, if two photons are too close to each other, they are not resolved, and are counted as one photon. This effect was reduced by storing photons only when they belong to different detector blocks as in the experiment. This leads to a small under-estimation of the background from mixing events, but only for very small invariant masses (below 50 MeV). The photon pairs from meson-peak regions (,) will be more abundant than photon pairs from the regions outside of it [58]. Therefore, if the combinatorial background will be generated from all photon pairs from the meson-peak regions, we will overestimate the contribution from these photons. The ratio of the yield of the meson peak to the yield of the total invariant mass S/T=Signal/(Signal+Background) was used to suppress photon pairs from the resonance regions for each event class (TRG, Mγ, pt).
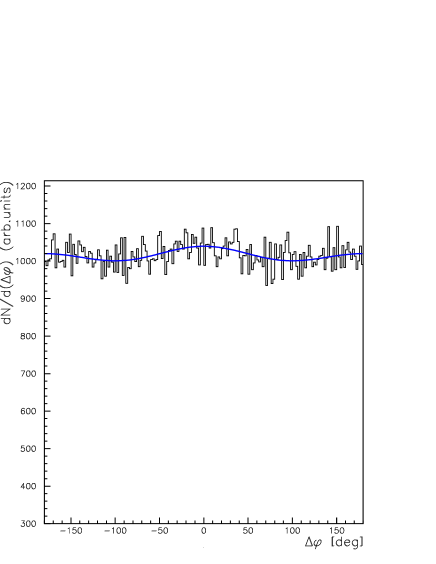
We observed weak azimuthal anisotropy found in the yield of inclusive photons detected by TAPS. As an example, Fig. 14 shows the azimuthal angle distributions of inclusive photons detected by TAPS with respect to the reaction plane from peripheral (26) Ni+Ni reactions at 1.9 A GeV averaged over photon transverse momentum. The Fourier analysis of this distribution shows the presence of weak positive elliptic flow of inclusive photons , indicating a preferred emission of photons in the reaction plane. Furthermore, the detailed analysis revealed that the magnitude of the combinatorial background is also weakly dependent () on the azimuthal angle of meson emission relative to the reaction plane. As the main source of photons in our case is due to decay, both these anisotropies can be attributed to the anisotropy in the pion emission. As the integrated pion yields are dominated by pions with low transverse momentum pt, the elliptic flow of low pt neutral pions is also expected to be weak and positive. The performed Monte-Carlo simulation confirmed this assumption. The simulation also shows that the correction for this effect can be done by normalizing the combinatorial background for each bin in azimuthal angle separately.
In our analysis we used 12 equal intervals in azimuthal angle of meson emission relative to the reaction plane . The normalization factor was found to be a smooth function of .
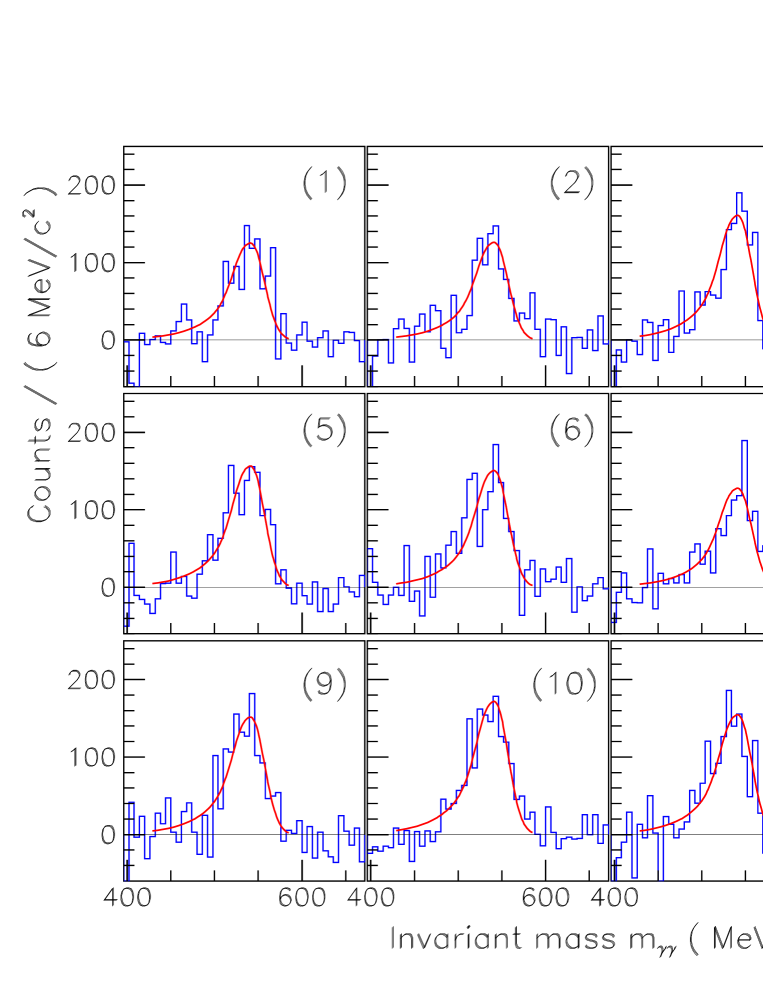
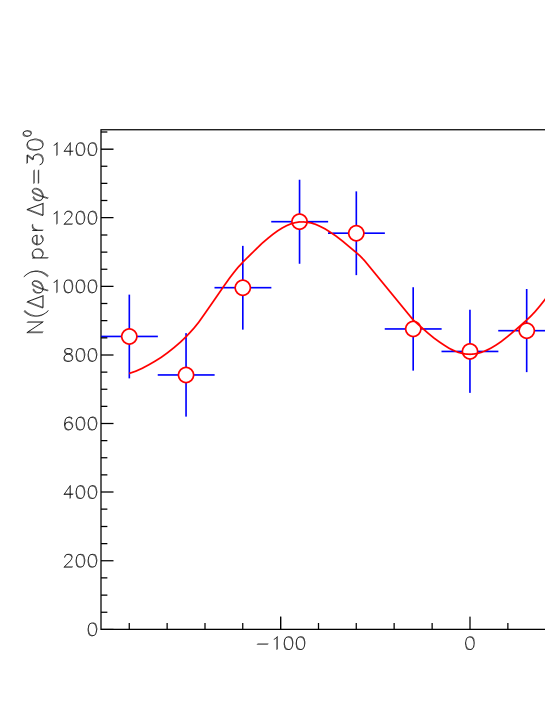
In order to extract the azimuthal-angle distributions of mesons the following algorithm was used: In a first step, the calculated invariant-mass distributions for each studied trigger and reaction-centrality window were divided into several sections according to the photon multiplicity , transverse momenta pt, TAPS block combination and azimuthal angle . Then the combinatorial background was generated by the outlined scheme of event mixing, normalized outside of the meson-mass windows and subtracted from the invariant-mass spectra for each section separately. Then the background-free invariant-mass spectra from each section were summed. As an example, Fig. 15 shows the resulting background-free invariant mass spectra in the meson mass region for 12 equal intervals in summed over the reaction centrality Mreact and transverse momentum pt. The meson peak content was obtained by integrating over the mass window 470 MeV/cM570 MeV/c2, and for the mesons we used the mass window 100 MeV/cM150 MeV/c2. The resulting azimuthal-angle distribution of mesons is shown in Fig. 16.
The uncertainty in the meson-yield extraction is determined by the statistical errors
in the contents of the total mass distribution in between the integration limits and the number
of entries in the (scaled) combinatorial background distribution. The combined statistical
error is taken to be the square root of the quadratic sum of these contributions.
3.7 Simulation
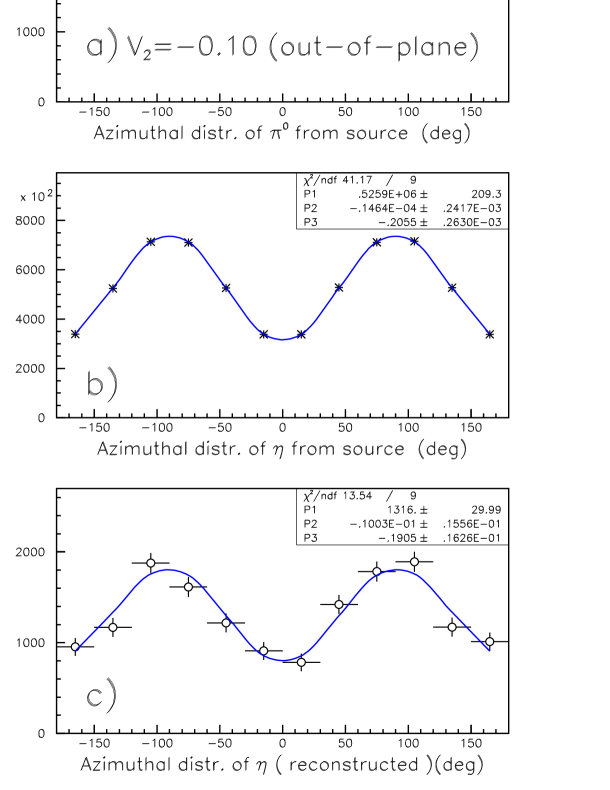
As the main source of combinatorial background in our case are uncorrelated photon pairs which mainly originate from decay, the weak anisotropy of the background can be attributed to the anisotropy in pion emission. To test this assumption and to check the accuracy of the proposed procedure of event mixing a Monte-Carlo simulation was performed in which the emission of and mesons is governed by a thermal distribution
| (12) |
where and are the total energy of the meson ( M is the meson mass ) and its reduced total energy in the center-of-mass system, respectively. The meson ( , ) source parameters, i.e. temperature and meson production probability per participant were chosen consistently with those measured [64]. The polar-angle distribution of the emitted mesons is isotropic in the center-of-mass system.
The azimuthal-angle distribution ) of the emitted mesons with respect to the reaction plane is not isotropic and is given by :
| (13) |
where the parameter reflects the strength of elliptic flow. The anisotropy in the emission of mesons was assumed to be =-0.2, close to the experimental value. The simulations were performed with several values of the anisotropy in the emission of pions (), see below range of values actually observed in the experiment. Geometrical acceptance, on-line trigger schemes and realistic detector resolution effects (time-of-flight and energy resolution of BaF2 modules) were taken into account. We used the identical procedure of analysis for the simulated data as for the experimental ones. The statistics in the simulated data was chosen close to that of the experimental data. The results of the simulation show that
-
•
the azimuthal anisotropy of the combinatorial background is an indication of the collective flow of pions, and its sign and magnitude are determined by the anisotropy of the pionic flow. Isotropy in the emission of pions leads to an azimuthally isotropic combinatorial background.
-
•
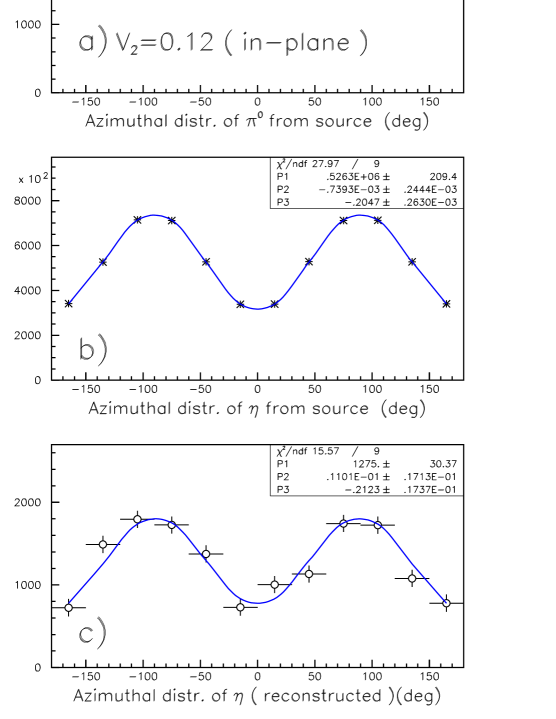
the extracted values for the elliptic-flow signal of and mesons are, within statistical errors, comparable with source parameters; the proposed method of event mixing works correctly in case of different anisotropies of the pion source. As an example we present the results of such simulations for a pion source with strong positive (see Fig. 17) and negative elliptic flow (see Fig. 18)
Based on these simulation we estimate a systematical error in the parameter for the experimental data, which are influenced by much smaller mean pion anisotropy and hence also combinatorial background anisotropy , to be below 2.
4 Results
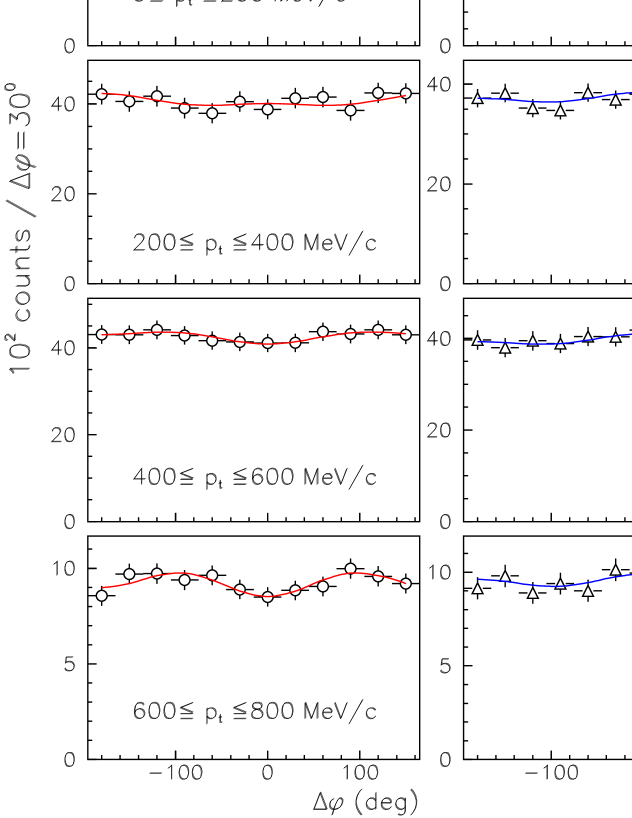
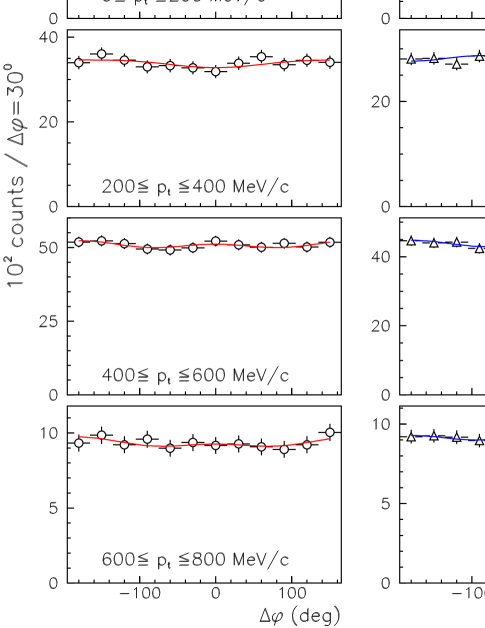
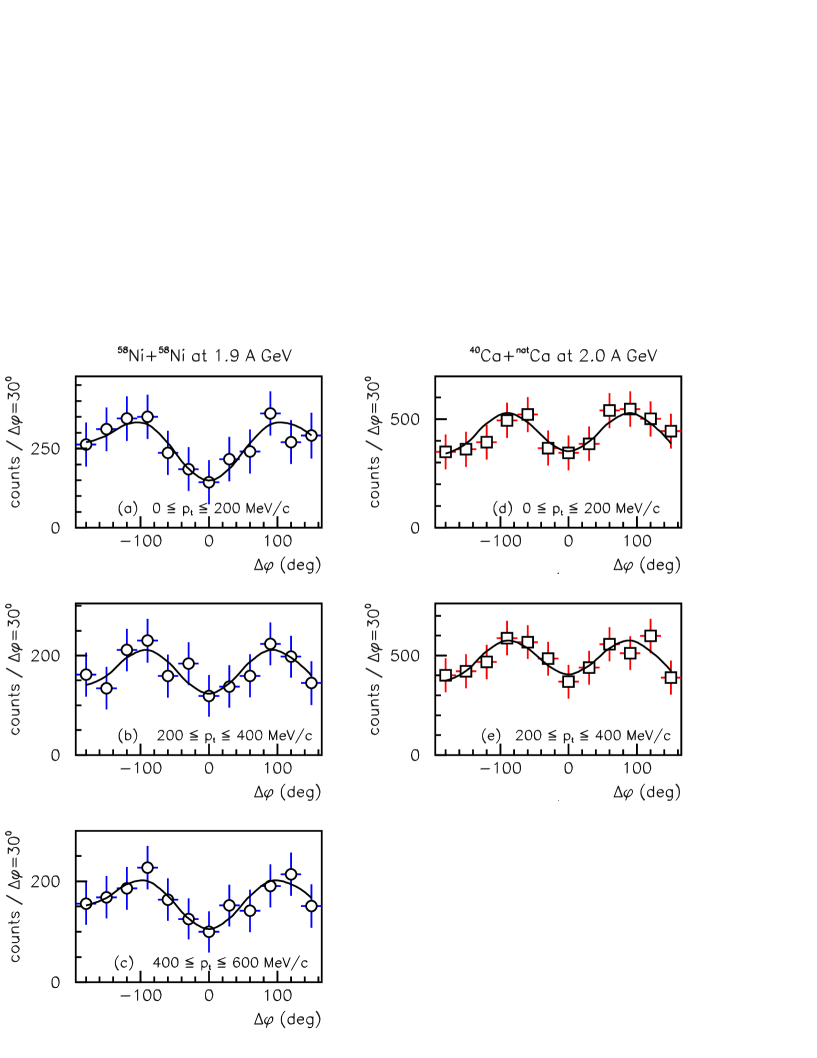
We present in Fig. 19 – 22 the resulting azimuthal yields of and mesons for different bins in Mreact and transverse momentum pt for both systems studied. Because of low statistics for mesons we present the pt dependence (see Fig. 20) without a selection on the reaction centrality Mreact, and the reaction centrality dependence without a selection on the transverse momentum pt (see Fig. 21). We fitted the azimuthal yields of and mesons by the first two terms of a Fourier expansion in the azimuthal angle:
| (14) |
The first coefficient () is used to parametrize the in-plane emission of the particles parallel () or antiparallel () to the impact-parameter vector (directed flow), whereas the second coefficient () quantifies an elliptic flow, which is negative for out-of-plane emission and positive for an in-plane emission [25, 26]. The extracted values of are zero within the error bars, as should be expected since we study symmetric colliding systems at midrapidity, see Tables 4–5. The resulting values of the parameter for and mesons are given in Table 4 and 6.
| Reaction | 58Ni+58Ni at 1.9 AGeV | 40Ca+natCa at 2 AGeV | |||
|---|---|---|---|---|---|
| pt (MeV/c) | 0-200 | 200-400 | 400-600 | 0-200 | 200-400 |
| -0.080.07 | -0.030.05 | -0.070.08 | 0.010.04 | 0.020.04 | |
| 0.100.06 | 0.110.05 | 0.100.05 | 0.110.04 | 0.100.04 | |

| Reaction | 58Ni+58Ni at 1.9 AGeV | 40Ca+natCa at 2 AGeV | |||
|---|---|---|---|---|---|
| Mreact | 2 - 6 | 7 - 10 | 11 | 1 - 3 | 4 |
| pt (MeV/c) | for mesons | ||||
| 0-600 | 0.010.06 | 0.060.10 | 0.110.16n | 0.050.06 | -0.020.08 |
| for mesons | |||||
| 0 - 200 | -0.0210.026 | 0.0110.022 | -0.0310.042 | -0.0210.022 | 0.0210.022 |
| 200-400 | -0.0160.017 | 0.0160.017 | -0.0110.021 | 0.0060.011 | -0.0110.012 |
| 400-600 | -0.0170.032 | 0.0100.022 | 0.0060.017 | -0.0050.011 | -0.0050.011 |
| 600-800 | -0.0120.021 | 0.0160.017 | 0.0160.032 | 0.0060.012 | -0.0160.021 |
| Reaction | 58Ni+58Ni at 1.9 AGeV | 40Ca+natCa at 2 AGeV | |||
|---|---|---|---|---|---|
| Mreact | 2 - 6 | 7 - 10 | 11 | 1 - 3 | 4 |
| 51 | 44 | 37 | 34 | 28 | |
| pt (MeV/c) | for mesons | ||||
| 0-600 | -0.080.04 | -0.120.05 | -0.100.06 | -0.090.03 | -0.090.04 |
| for mesons | |||||
| 0 - 200 | 0.0330.017 | 0.0210.019 | 0.0260.031 | 0.0120.016 | -0.0060.021 |
| 200-400 | 0.0050.007 | 0.0070.009 | 0.0110.016 | -0.0110.006 | -0.0050.011 |
| 400-600 | -0.0040.005 | 0.0080.011 | -0.0180.016 | 0.0060.007 | 0.0160.007 |
| 600-800 | -0.0310.012 | 0.0120.013 | 0.0220.021 | 0.0050.012 | 0.0070.012 |
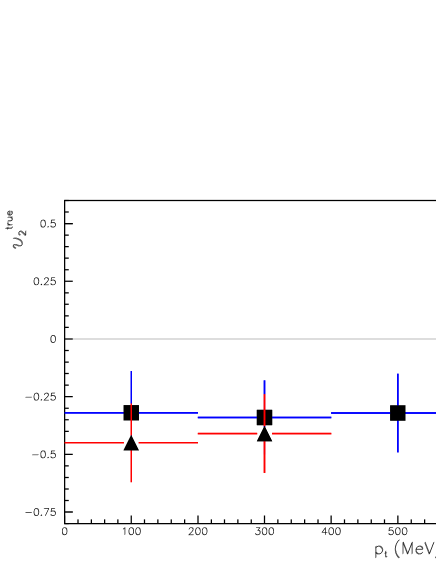
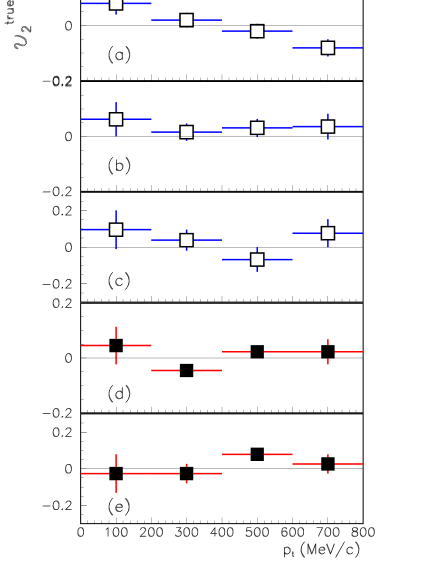
The obtained coefficients were corrected for the reaction-plane resolution as = /, where is the fluctuation of the azimuthal angle of the reconstructed reaction plane with respect to the true one, see sect. 3.2. The resulting dependence of as a function of transverse momentum pt is shown in Fig. 23 – 24 for and mesons for both the Ni+Ni and Ca+Ca collisions. Note that the error-bars shown in Fig. 23 – 24 represent statistical errors only. The systematical errors in the resulting parameter are dominated by two sources:
i) the uncertainty in the determination of the reaction-plane resolution ( see sect. 3.2), which leads to a relative error in of the order of 15;
ii) the uncertainty induced by the variation of the azimuthal anisotropy of the combinatorial background with which was estimated from a Monte-Carlo simulation and leads to relative errors in of approximately 2.
Other sources of systematical errors like detector non-uniformities and occupancy of the TAPS spectrometer are found to be even smaller.
5 Discussion
The data shows strong negative elliptic flow of mesons ( ) for all studied bins in transverse momentum pt and reaction centrality, indicating a preferred emission of mesons perpendicular to the reaction plane. In contrast, the values for are close to zero within the error bars except for peripheral Ni+Ni collisions (), where a weak elliptic-flow signal is observed, changing from positive to negative sign with increasing pion transverse momentum pt, see Fig. 24.
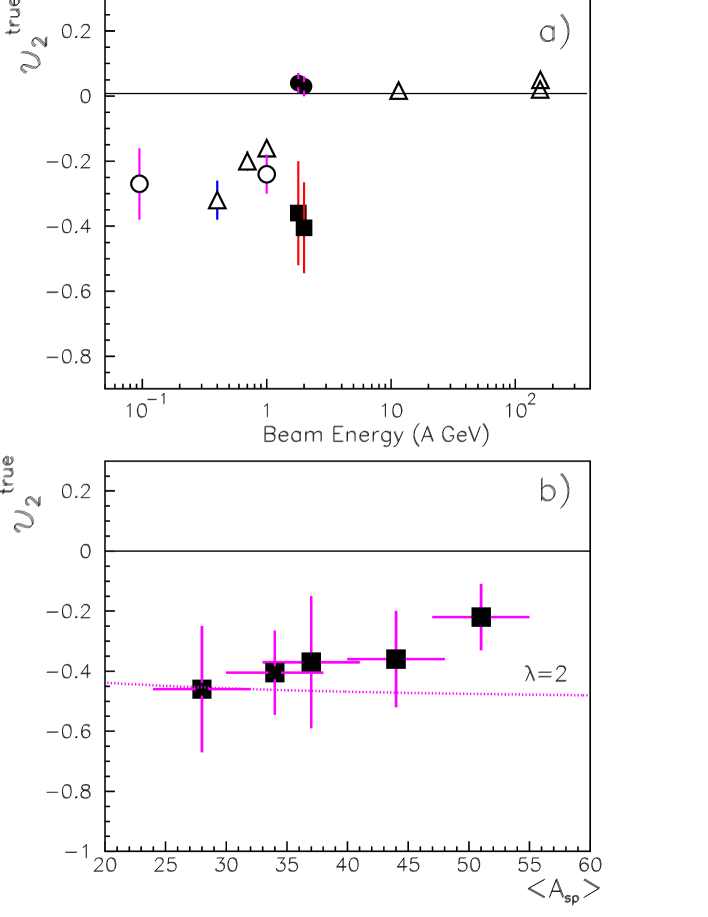
In order to compare the present results with previous measurements of elliptic flow [13, 16, 18, 21, 22, 23] (see Table 7), we plotted the values for neutral and charged pions near midrapidity as a function of the beam energy, see Fig. 25a. It can be seen that the pion elliptic flow undergoes a transition from out-of-plane to in-plane emission around beam energy of 2 AGeV, which can be compared with theoretical prediction [35]. This effect can qualitatively be understood by taking into account the collision dynamics. The spectator nucleons leave the interaction region after the so-called passage time tpass of the order 2R/ (where R is the nuclear radius and is the Lorentz-contraction factor), and the interaction with the spectator matter of particles produced later are not significant [25, 34, 35, 62]. Recent RQMD model calculations for the Au+Au system at a beam energy of 2 AGeV [34] show that the time-averaged values of for both pions are positive (indicating a preferred emission in the reaction plane), but pions emitted at the time scale less than t13.5 fm/c (see Table 8) exhibit negative elliptic flow. It is known that the freeze-out time of pions is strongly dependent on their transverse momentum and that most of the high pt pions freeze out early in the reaction [3, 33, 35]. Therefore, the observed nearly isotropic emission of neutral pions, except the high pt pions in light colliding systems at 2 AGeV, can qualitatively be understood.
| A+A | E (AGeV) | centrality | pt (MeV/c) | Ref. | ||||
|---|---|---|---|---|---|---|---|---|
| Ar+Au | 0.095 | semiperiph. | 200 | -0.120.05 | 0.441 | -0.270.11 | [13] | |
| ZPLF=11-12 | ||||||||
| Ar+Au | 0.095 | peripher. | 200 | -0.230.09 | 0.441 | -0.520.21 | [13] | |
| ZPLF=14-17 | ||||||||
| Ar+Al | 0.095 | semicentr.. | – | -0.200.08 | 0.491 | -0.420.16 | [14] | |
| Bi+Bi | 0.4 | MUL2 | 360-600 | -0.150.02 | 0.35 2 | -0.430.06 | ||
| MUL3 | 360-600 | -0.130.02 | 0.41 2 | -0.320.05 | [18] | |||
| Bi+Bi | 0.7 | MUL2 | 360-600 | -0.120.01 | 0.49 2 | -0.240.02 | [18] | |
| MUL3 | 360-600 | -0.100.01 | 0.51 2 | -0.200.02 | ||||
| Bi+Bi | 1.0 | MUL2 | 360-600 | -0.080.01 | 0.50 2 | -0.160.02 | ||
| MUL3 | 360-600 | -0.090.01 | 0.55 2 | -0.160.02 | [18] | |||
| Au+Au | 1.0 | semicentr. | 400-600 | -0.190.07 | 0.711 | -0.270.10 | [16] | |
| Au+Au | 11.5 | peripher. | 400-500 | – | – | 0.01-0.02 | [21] | |
| Pb+Pb | 158 | semicentr. | 400-600 | – | – | 0.020.01 | [23] | |
| Pb+Pb | 158 | semicentr. | 50-800 | – | – | 0.050.02 | [22] |
On the other hand, the observed strong negative elliptic flow of mesons indicates that a significant part of them freezes out while the spectators are still close to the participant zone. The magnitude of elliptic flow is comparable with that for pions observed in heavy colliding systems at energies 0.1-.4 A GeV [16] – [18], see Fig. 25a. However, the pt dependence is different, see Fig. 23. Within large error bars, the values for mesons do not vary with transverse momentum in contrast to the ones of pions [16] – [18]. In order to estimate the effect due to ”shadowing” by spectators one can apply the formula
| (15) |
where is the mean free path for mesons in cold spectator matter ( 1-2 fm [36]) and fm is the mean thickness of spectator matter. The resulting dotted line in Fig. 25b describes the data for mesons fairly well.
The approximation by a shadowing scenario through cold nuclear matter for describing the strong negative elliptic flow of mesons is also supported by different microscopic model calculations, which show that mesons freeze out at earlier times as compared with pions [10, 35, 65]. As an example, Fig. 26 shows the prediction of the BUU model [66] for the time evolution of the , , and yields in comparison to the density of the central region for central 40Ca+40Ca collisions at 2 AGeV. This figure shows that the mesons decouple from baryons much earlier than the pions. Therefore, the shorter freeze-out time may explain the much stronger azimuthal anisotropy observed for mesons in comparison with pions.
In summary, we have studied simultaneously the azimuthal angular distributions of and mesons emitted at midrapidity in the two colliding systems 58Ni+58Ni at 1.9 AGeV and 40Ca+natCa at 2 AGeV. We observed a strong negative elliptic flow of mesons. The elliptic flow of mesons is very weak in contrast to data obtained for heavy colliding systems at 1 AGeV. The data can qualitatively be explained by the final state interaction of mesons in the spectator matter taking into account the collision dynamics.
This work was supported in part by the Granting Agency of the Czech Republic, by the Dutch Stichting FOM, the French IN2P3, the German BMBF, the Spanish CICYT, by GSI, and the European Union HCM-network contract ERBCHRXCT94066.
| System | R (fm) | Energy (A GeV) | (c) | t | |
|---|---|---|---|---|---|
| Ni+Ni | 4.48 | 2.0 | 0.72 | 1.44 | 8.7 |
| Ca+Ca | 3.96 | 2.0 | 0.72 | 1.44 | 7.7 |
| Au+Au | 6.74 | 2.0 | 0.72 | 1.44 | 13.5 |
| Au+Au | 6.74 | 1.0 | 0.59 | 1.24 | 18.5 |

6 Appendix A: Flow of charged baryons
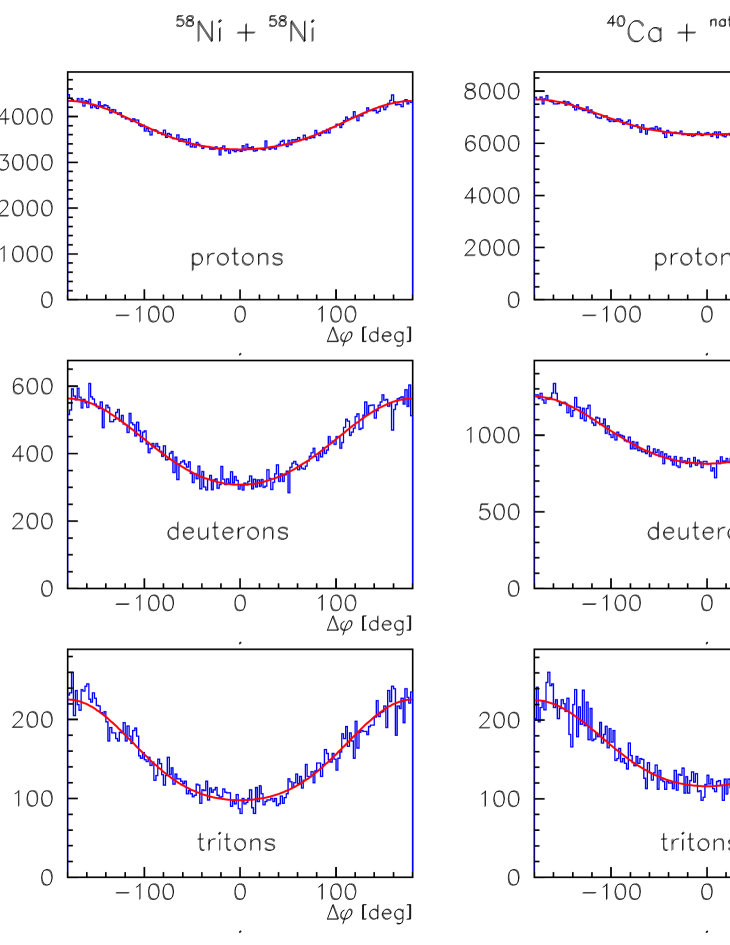
As TAPS allows the identification of charged particles by time-of-flight discrimination, pulse-shape discrimination and the charged-particle veto counters, we used this feature to verify our method of the reaction-plane reconstruction. As an example, Fig. 27 shows the mass spectrum of charged particles detected by TAPS for the reaction 58Ni+58Ni at 1.9 AGeV. In this figure clearly separated peaks corresponding to charged pions, protons and deuterons are seen. Fig. 28 shows the experimental azimuthal-angle distributions of identified charged baryons (protons, deuterons and tritons) detected in TAPS with respect to the reaction plane for both studied reactions. The directed flow of charged baryons in the target-like rapidity region (the preferential emission in the reaction plane) is clearly observed. This verification demonstrates the quality of the reaction-plane determination for both colliding systems.

References
- [1] J. Aichelin , Phys. Rep. 202, 233 (1991)
- [2] W. Cassing et al., Phys. Rep. 188, 363 (1990)
- [3] S.A. Bass et al. Prog. Part. Nucl. Phys. 41, 225 (1998).
- [4] W. Ehehalt et al. , Phys. Rev C 47, 2467 (1993).
- [5] V. Metag , Prog. Part. Nucl. Phys. 30, 75 (1993).
- [6] J.W. Harris V. et al. , Phys. Rev. Lett.58, 463 (1987).
- [7] S.A. Bass et al., Phys. Rev. C51, 3343 (1995)
- [8] S. Teis et al., Z. Phys. A 356 , 421 (1997)
- [9] R.M. Barnett et al., Phys. Rev. D. 54, 1 (1996).
- [10] Gy. Wolf et al., Nucl. Phys. A 552, 549 (1993).
- [11] J. Gosset et al., Phys. Rev. Lett. 62, 1251 (1989)
- [12] A. Kugler et al., Acta Physica Polonica B25, 691 (1994)
- [13] A. Schubert et al. , Phys. Lett. B 328, 10 (1994).
- [14] A. Badala et al. , Phys. Rev. C 55, 2506 (1997).
- [15] A. Kugler et al., Phys. Letter B 335(94)319
- [16] L. B. Venema et al., Phys. Rev. Lett. 71, 835 (1993).
- [17] D. Brill et al., Phys. Rev. Lett. 71, 336 (1993).
- [18] D. Brill et al., Z. Phys. A 357, 207 (1997).
- [19] J.C. Kintner et al., Phys. Rev. Lett. 78, 4165 (1997).
- [20] J. Barrette et al, Phys. Rev. C 56, 3254 (1997).
- [21] J. Barrette et al, proceedings of Quark Matter ’99, Turin, 1999; K.Filimonov for E877, nucl-ex/9907006 and private communications.
- [22] M.M. Aggarwal et al., proceedings of Quark Matter ’99, Turin, 1999; S.Nishimura for WA98, private communications.
- [23] H. Appelshauser et al, Phys. Rev. Lett. 80, 4136 (1998).
- [24] W. Reisdorf and H.G. Ritter, Ann. Rev. Nucl. Part. Sci., Vol. 47, 663, 1997
- [25] J.-Y. Ollitrault, Nucl. Phys. A 638, 195 (1998).
- [26] S.Voloshin and Y.Zhang, Z. Phys. C 70, 665 (1996).
- [27] H. Gutbord et al, Phys. Rev. C 42, 640 (1990).
- [28] Y.Leifels et al, Phys. Rev. Lett 71, 963 (1993).
- [29] D. Brill et al., Z. Phys. A 355, 61 (1996).
- [30] R. Stöcker et al., Phys. Lett. Lett 52, 1594 (1982).
- [31] S.A. Bass et al., Phys. Rev. Lett 71, 1144 (1993).
- [32] Bao-An Li, Nucl. Phys. A 570, 797 (1994).
- [33] P. Senger and H. Ströbele , nucl-th/9810007 .
- [34] H. Liu et al., Phys. Rev. C 59, 348 (1999).
- [35] Bao-An Li et al., nucl-th/9904013
- [36] M.Röbig-Landau et al., Phys. Lett. B 373, 45 (1996).
- [37] A. de Paoli et al., Phys. Lett. B 219, 194 (1989).
- [38] R. Novotny, IEEE Trans. Nucl. Sci. 38, 379 (1991).
- [39] P. Senger et al., Nucl. Instrum. Methods Phys. Res. A 327, 393 (1993).
- [40] G. Fai et al., Comput. Phys. Commun. 42 385 (1986).
- [41] A.R Wolf et al., Phys. Rev. Lett. 80, 5281 (1998).
- [42] R. Fai et al., Phys. Rev. C. 36, 597 (1987).
- [43] P. Danielewicz and G. Odyniec, Phys. Lett. B 157, 147 (1985).
- [44] J.-Y. Ollitrault, preprint nucl-ex/9711003.
- [45] J.-Y. Ollitrault, Phys. Rev. D. 48, 1132 (1993).
- [46] C.A. Ogilvie et al., Phys. Rev. C. 40, 2592 (1989).
- [47] W.M. Zhang et al., Phys. Rev. C. 42, R491 (1990).
- [48] M.M. Htun et al., Phys. Rev. C. 59, 336 (1999).
- [49] J.L. Ritman et al., Z. Phys. A 352, 355 (1995).
-
[50]
A. Taranenko et al., Czech. Jour. of Phys., 47, 891 (1997).
Czech. Jour. of Phys., 48(S1), 133 (1998). - [51] F.D. Berg et al., Z. Phys. A 340, 297 (1991) 365, 392 (1995).
- [52] F.M. Marques et al., Nucl. Instrum. Methods Phys. Res. A 365, 392 (1995).
- [53] V. Wagner et al., Nucl. Instrum. Methods Phys. Res. A 394, 332 (1997).
- [54] R. Averbeck et al., Z. Phys. A 359, 65 (1997).
- [55] M. Appenheimer et al., TAPS Analysis Software (TAPAS), 1994
- [56] P.H. Vogt , TAPS Analysis Workstation (TAPAW), 1994.
- [57] T.C. Awes et al., Nucl. Instr. and Meth. A311, 130 (1992).
- [58] W.A. Zajc et al., Phys. Rev. C 29, 2173 (1984).
- [59] S. Fokin et al., Technical report, CERN, 1992.
- [60] D. L’Hte, Nucl. Instr. and Meth. A337, 544 (1994).
- [61] T.C. Awes, Nucl. Instr. and Meth. A276, 468 (1989).
- [62] P. Danielewicz et al., Phys. Rev. Lett 81, 2438 (1998).
- [63] T. Matulewicz et al., Nucl. Instr. and Meth. A289, 194 (1990).
- [64] P.H. Vogt , Czech. Jour. of Physics, 47, 899 (1997).
- [65] K.K. Gudima et al. , Phys. Let. B 328, 249 (1994).
- [66] Gy. Wolf, private communications, 1998.