A systematic study of two particle correlations from NA49 at CERN SPS
Abstract
A systematic study of two particle correlations measured by the NA49 experiment is summarized. Radii from Bose Einstein interferometry have been determined separately in different parts of phase space, for different collision systems and at different incident beam energies. Moreover, first results of a new method of accessing space-time asymmetries in the emission of particles by means of non identical particle correlations are presented.
Bose Einstein Interferometry
The aim of studying two particle correlations is the reconstruction of the freeze out conditions of final state particles. In relativistic heavy ion collisions it appears that this state has to be described by a set of rather complicated non-isotropic, non-static and particle-type dependent emission functions. To constrain these one has to gather selective information over a wide region of phase space by applying different analysis methods and by a systematic change of the initial condition of the collision. The NA49 experiment [1] with its four large volume TPCs detecting over 60% of all pions emitted has collected rather a comprehensive body of data. It comprises centrality selected PbPb collisions at 158 and at 40 AGeV, minimium bias PbPb events at 158 AGeV as well as 158 AGeV pp and pPb interactions. Overall this represents an ideal basis for such a study. Usually freeze out condition are investigated by means of intensity interferometry which exploits correlations at small momentum differences of two particles arising from quantum interference in the case of the two particles being indistinguishable. The description of the correlation function by a gaussian parametrization in the three components of the momentum difference , , relates the gaussian width parameters to the transverse () longitudinal () and temporal () extent of the source at freeze out. In order to observe the mere quantum statistical interference of like sign charged pions the correlation function has to be corrected for correlations owing to final state interactions mainly due to the Coulomb repulsion. For our central PbPb 158 AGeV data this correction is done – as described in [2] – by the measured correlation function of unlike sign charged pairs.

In the case of the minimum bias data sample as well as in case of the central 40 AGeV data analysis the analytical ansatz of the Coulomb correlation, as suggested in [3], is chosen instead. It was incorporated in the fitting procedure of the uncorrected correlation function, to take the size dependence of the Coulomb effect properly into account. Despite the two different methods the results obtained from the central 158 AGeV data sample coincide with those from the most central of five bins [4] in the minimum bias 158 AGeV data. Due to the expected small source size the usual Gamov factor is applied in case of pp and pPb collisions to correct for Coulomb correlations, noting that compared to the uncorrected case no significant change of the radii is observed. To eliminate the inefficiency of the NA49 TPCs for detecting pairs of two close tracks, those with distances of less than 2 cm in the PbPb analysis or those with relative laboratoy momenta MeV/c and MeV/c (z beam axis) in the pp and pPb have been excluded from the analysis. This restriction is imposed on pairs of particles from the same event (corr) as well as on those combined from different events (mix). The latter are used as reference sample (denominator) in the correlation function . All results presented here refer to the Longitudinal Co-Moving System (LCMS) as the Lorentz frame, which is determined for each pair in such a way that the sum of the longitudinal momentum components of the pair vanishes.
Results of the analysis of the pp collisions are shown in the two left columns of figure 1 together with results from the analysis of central (CMD7)111For a definition of CMD see the contribution [4] to this conference. and peripheral (CMD7) pPb collisions. The phase space is subdivided into two regions of the average rapidity of the two pions at and into two of the average pion transverse momentum at GeVc. In each column of figure 1 is the average over all pairs contributing to the respective region. Similarily are used as abscissae. To increase the statistical significance the distributions from pairs of negative hadrons are added to those of positive hadrons since the separate analyses agree within errorbars. It should be emphasized that for these collision systems this is the first time such a phase space dependent three dimensional analysis has become feasible. The radii from pPb tend to be slightly larger than those from pp. In all cases an ordering is observed , the latter being consistent with the observation of a finite duration of freeze-out. Moreover, the pp radii at large values of kt appear to be smaller than those at low kt. Whereas in central PbPb reactions (two right columns of figure 1) such a behaviour of the transverse radii is attributed to a hydrodynamical expansion of the system [5] in pp it seems more likely to be a characteristics of the decay pattern of resonances such as the which play an important role at this shorter length scale.

Complementary to the change of the collision system is the variation in centrality of the collision. In the right column of figure 2 the dependence on the number of nucleons participating in the collision is shown for PbPb collisions at different centralities accompanied by our pp result and by the NA35 result in the system SS at 200 AGeV. With increasing the transverse radii and grow continously whereas appears constant. is positive over the full range and grows linearly with . Similar to the findings of NA35 [7] RQMD gives a good agreement for but overestimates and . A comparison of with an estimate of the geometrical transverse size of the overlap region in the collsions (figure 2 line222The line in corresponds to the average distance of points in the overlap region of two spheres of radius offset by the impact paramter from the center of the the collision, projected into a randomly oriented reaction plane.) demonstrates that the interferometric radii reflect the freeze-out stage which is preceeded by a strong expansion of the dense collision zone produced shortly after the collision [5]. The left column of figure 2 shows a first step towards closing the gap between the highest AGS energy at 11.6 AGeV and the SPS measurements at 158 AGeV by the (very preliminary) results from the 40 AGeV commissioning run of NA49 in 1998. Although the 40 AGeV and the 158 AGeV results are taken at whereas the AGS point [6] is measured at mid-rapidity, the comparison is justified by the observed slow variation of the the radii with in NA49. In the transition from AGS to the highest SPS energy more than doubles whereas a small increase in the transverse radii and is observed and the temporal component even seems to be a constant.
Correlations of Non Identical Particles
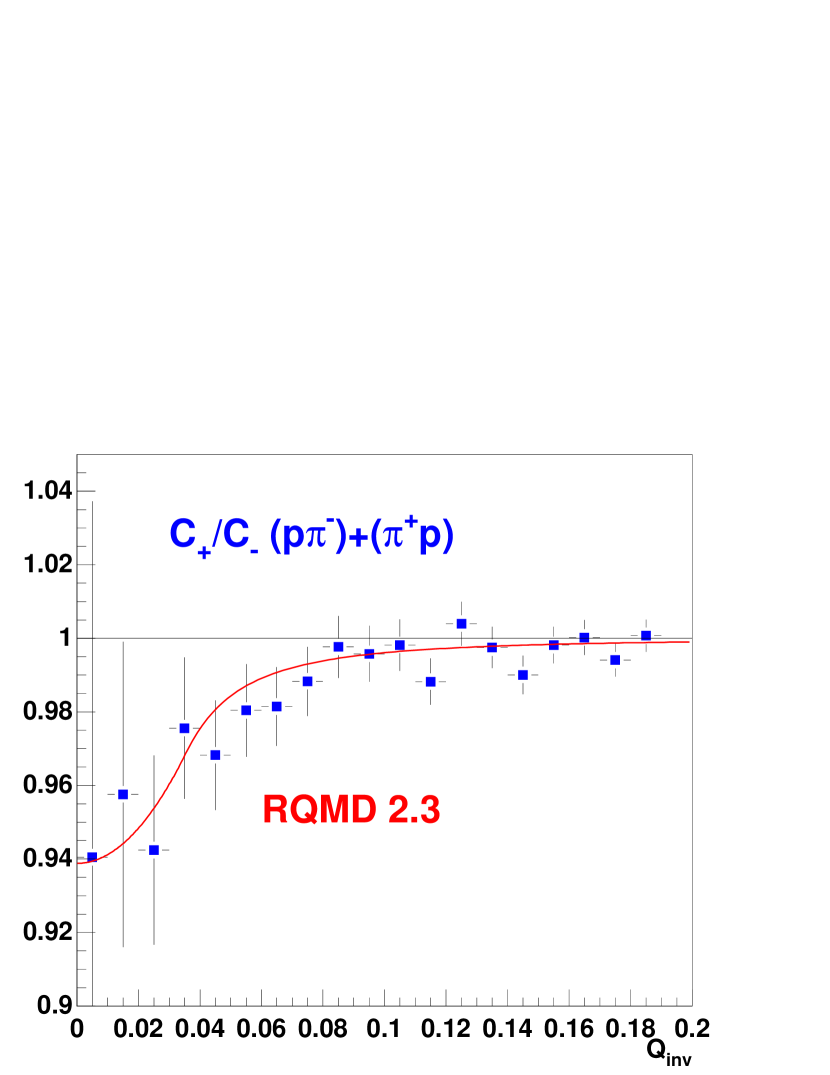
A method for investigating space-time emission asymmetries has been suggested in [8], which utilizes the effects of final state interaction on the correlations of two non identical particles at small relative velocities. Contrary to the BE correlation method it gives access to the space-time asymmetries in the emission function of different particle species. Such an analysis was carried out for the first time in the SPS energy regime and is presented here for the case of proton-pion correlations. The method involves the correlation functions and derived for the two cases where and , respectively, with being defined as the angle between the pair velocity sum-vector and the velocity difference-vector in the rest frame of the pair and redefined as the momentum difference in the pair rest frame333In this frame is equal to the relative velocity times the reduced mass of the pair. For pairs of equal mass particles the definition coincides with the usual definition of .. A deviation of the ratio from unity then allows – besides a more quantitative evaluation – for a distinction of emission patterns, for which on the one hand (I) low pions are emitted later or/and closer to the reaction axis and on the other hand (II) low pions are emitted earlier or/and further from the reaction axis than high protons. Results for a small subset of NA49 data of about 40.000 central PbPb events are shown in figure 3. The data clearly exhibit asymmetries in the space-time emission favouring scenario I of the above two. Moreover, a good agreement is achieved in comparison to RQMD 2.3, in which the spatial component plays the dominant role in the occurance of the asymmetry observed for the model.
References
- [1] S. Afanasiev et al., NIM A430(1999)210 and F. Sikler for NA49, this proceedings.
- [2] T. Alber et al., Z. Phys. C73(1997)443
- [3] Y. M. Sinyukov et al., Phys. Lett. B432(1998) 417.
- [4] G. Cooper for NA49, this proceedings.
- [5] H. Appelshäuser et al., Euro. Phys. Jour. C2(1998) 611.
- [6] R. Soltz for E866, this proceedings.
- [7] T. Alber et al., Phys. Rev. Lett. 74(1995) 1303 and Nucl. Phys. A590(1995) 453.
- [8] R. Lednicky et al., Phys. Lett. B371(1996) 30.