Measurements of Neutrons in 11.5 A GeV/c Au + Pb Heavy-Ion Collisions
Abstract
We present measurements from Brookhaven AGS Experiment 864 of neutron invariant multiplicity in 11.5 A GeV/c Au + Pb collisions. The measurements span a rapidity range from center of mass to beam rapidity (=3.2) and are presented as a function of event centrality. The results are compared with E864 measurements of proton invariant multiplicity and an average ratio at hadronic freeze-out of 1.19.08 is determined for the rapidity range =1.6 to =2.4. We discuss briefly the implications of this ratio within a simple equilibrium model of the collision system.
I Introduction
As constituents of the colliding nuclei in a relativistic Au + Pb heavy ion interaction, neutrons carry over 60% of the incident energy. Knowledge of the final distribution of neutrons resulting from these collisions is then important for the determination of the amount of energy deposited in the central rapidity region in such collisions. Because the time scale of these collisions is so small (the total duration until hadronic freeze out is believed to be on the order 10 fm/c [11]), the collision dynamics are dictated by the strong interaction. It is then reasonable to assume that the behaviour of neutrons in the collision should closely parallel that of protons which have been extensively measured for similar collision systems and energies [12, 13, 14]. Indeed, in the absence of neutron data this has been widely assumed in the calculation of light nuclei coalescence parameters (sometimes with the explicit assumption that the neutron to proton ratio available for coalescence is the primordial ratio) [15, 16].
It is also widely assumed that the neutron to proton ratio at hadronic freeze-out should show significant equilibration from the initial Au + Pb ratio of 1.52:1. Measurements of nucleons in Au + Au collisions at lower energy [17] do in fact exhibit this. This equilibration is expected to be enhanced at AGS energies as a result of a large amount of strong resonance production in the collision region which should have the effect of speeding the system toward chemical equilibrium and so transferring some of the initial isospin imbalance to an excess of over .
II Experiment 864
A The E864 Spectrometer
BNL Experiment 864 is an open geometry, high data rate spectrometer that was designed chiefly to search for cold strange quark matter (strangelets) which may be produced in heavy ion collisions. Plan and elevation views of the spectrometer are shown in Figure 1. A thorough description of the apparatus is provided in [18].
A beam of gold ions with momentum 11.5 A GeV/c is incident on a fixed lead target. The interaction products then travel downstream through two dipole magnets M1 and M2. A collimator inside of M1 defines the experimental acceptance; for neutral particles this is -32 mr to 114 mr in the horizontal and -17 mr to -51.3 mr in the vertical.
The charged particle tracking system consists of three hodoscope scintillator walls (H1, H2, and H3) and two straw tube stations (S2 and S3). The hodoscopes provide for each charged particle hit a measurement of time, charge, and position. This information is then used to build track candidates which are either rejected or confirmed and further refined by straw tube position information. With knowledge of the fields in M1 and M2, tracked particles are then identified by mass computed through rigidity, charge, and velocity with the assumption that the tracks originate from the target.
At the downstream end of the apparatus is the E864 hadronic calorimeter which is crucial to the neutral particle analyses. The calorimeter (see Figure 2) consists of an array of 58x13 towers, each 10cm x 10cm on the front face and 117cm long. This lead/scintillator sampling calorimeter is of a spaghetti design with scintillating fibers running lengthwise down each calorimeter tower giving a total lead to scintillator ratio of 4.55:1 by volume. The calorimeter has excellent resolution for hadronic showers in energy ( for in units of GeV) and time ( 400 ps) and is described in detail in [19].
Collision centrality is defined in E864 through a measurement of charged particle multiplicity. The E864 multiplicity counter [20] is an annular piece of scintillator placed around the beam pipe 13 cm downstream of the target that subtends an angular range from 16.6o to 45.0o. The annulus is separated into four quadrants, each of which is viewed by a photomultiplier tube. The sum of the integrated charge signal from the four quadrants is proportional to the charged particle multiplicity of the collision and is used to define event centrality.
B Neutron analysis
We measure the invariant multiplicity of neutrons by dividing momentum space into bins in rapidity and transverse momentum of size by . In terms of the actual experimental quantities, we then have the invariant multiplicity in a momentum bin with average transverse momentum as
| (1) |
Here is the number of neutrons reconstructed in our calorimeter analysis of . is the geometric acceptance for neutrons in our apparatus and is the efficiency for reconstructing with our analysis algorithm those neutrons which are accepted.
The first step in determining is to identify all those calorimeter towers in a given event which are peak towers. We define a peak tower as a tower which has more energy deposited than any of its 8 neighbors. For each peak tower, we define the corresponding energy shower as including all towers in a 3x3 grid centered on the peak tower. A 3x3 array is used because the improvement in energy resolution obtained by using a 5x5 grid is slight and the resulting contamination is much larger. Approximately 90% of the shower energy for a neutron with a kinetic energy of 6 GeV is contained in a 3x3 grid.
Each of these energy showers is then put through the following series of contamination cuts:
-
There must be no charged particle track found using only the hodoscopes which points to any of the nine towers in the shower. With the dipole fields in M1 and M2 set to 1.5 Tesla (the fields are aligned in the same direction), most charged particles are swept out of the neutron fiducial region so that the ratio of proton hits to neutrons hits is approximately 1 to 3 with some variation as a function of position. Charged pions, kaons, and deuterons are light and/or rare enough that calorimeter hits due to these species are suppressed by at least another order of magnitude.
Of the charged particle peaks in the neutral fiducial region of the calorimeter, we estimate from monte carlo simulations that 81% are rejected by this method compared with 6% of neutron peaks.
-
There must be no energy peak larger than some minimum energy, , in the square of 16 towers which borders the shower. Values of used in the analysis vary from 1.5 to 2.5 GeV as a function of rapidity.
-
A cut is made on the ratio, , of total energy in 25 towers around the peak to total energy in 9 towers around the peak. The maximum allowable value of in the analysis ranged from 1.7 to 2.5. The cut values for and were chosen by observation of the value of these quantities for those showers which were designated as clean by other contamination cuts, with consideration given both to the level of background present as a function of rapidity and to keeping the efficiency as high as reasonably possible.
-
Each tower of the shower which has a nonzero time must show agreement within a time window, , with the peak tower. Values of used were 1.6 ns for bins of = 1.7 and 1.75 ns elsewhere. Side tower time resolutions in neutron showers were approximately 500 ps (not gaussian) with some variation as a function of energy. This cut was adjusted to be 95% efficient for isolated neutron showers at rapidity 1.9 and above.
-
In bins of rapidity 2.5 and greater, a clear separation can be seen between neutrons and photons on a plot of shower mass versus percentage of shower energy in the peak tower, indicating that neutron showers are much wider than photon showers. For these rapidities, we place a cut on the ratio of energy in the peak tower to energy in the 9 tower sum to reduce contamination from photons; rejecting showers for which this ratio is larger than 0.83.
-
Finally, the shower energy profile is compared with the energy profiles of several hundred thousand isolated proton showers which span the full range of incident angles and front face hit positions and most of the rapidity range of neutrons incident on the calorimeter.
The fraction of shower energy in each of the nine towers is calculated and rounded to the nearest 5%. This set of nine fractions is then compared with the set of fractions for each of these isolated proton showers. If fewer than two matching sets of fractions are found, the shower is discarded.
For those showers which survive the cuts listed above, mass is calculated from the peak tower time, nine tower energy sum, and shower position as . A momentum is also assigned to the shower assuming a neutron mass and using energy and time measurements weighted according to their errors.
Momentum space is then divided into bins of 50 MeV/c in by .2 units in . For each bin we make a mass plot as shown in Figure 3. There is a background at low mass which is clearly evident for rapidities of 2.3 and below. This background is predicted qualitatively by our GEANT detector simulations as a mixture of scattered photons and hadrons, but the predicted level is less by a factor of four or more than the level seen in the data. We believe that this discrepancy is due to a combination of our modelling of the calorimeter time response near threshold being somewhat incorrect and the absence from our GEANT simulations of certain downstream geometries which may contribute scattered particles to this low energy background.
We count neutrons in the mass range from .55 to 1.55 and then subtract out the contribution of this background according to a parameterization of an exponentially decaying background plus a gaussian signal. Subtracting away the background in this manner leaves a neutron signal shape that agrees well with simulations (Figure 4) in which isolated proton showers are overlaid on the calorimeter to simulate the calorimeter response to neutron showers with the contamination of a heavy-ion event. (Note that while the shape agrees well, the energy scale in the simulations must often be adjusted by around 5% to show agreement with the data; possible systematic error from this effect is dealt with separately as part of the study of differences in calorimeter response between protons and neutrons.) This low mass background produces only a small correction to the number of neutrons counted; never larger than 14% according to our parameterization.
Two classes of background can produce mass peaks under the neutron peak and are subtracted away using monte-carlo simulations. The first class is from calorimeter hits by particle species other than neutrons. This includes mainly neutral kaons and protons which are missed by the tracking system. This class amounts to less than a 10% correction to the number of counted neutrons in most of the momentum bins in which we measure. The second class of background is due to neutrons which do not come directly from the target but come from inelastic scatterings in other parts of the apparatus (neutrons which elastically scatter are dealt with as part of the geometric acceptance calculation). These are largely from the upper edge of the collimator which sits approximately one meter downstream of the target; only scattering sources near the target can produce neutrons with time and energy combinations which will allow them to fall under the mass peak of neutrons from the target. For this background, we have a check on the accuracy of the monte-carlo simulations because a similar background is present for protons. For protons we can use tracking information to determine if a track originated in the target or collimator and so we can compare the monte-carlo predictions of this scattered background to what is present in the actual data. We find agreement to better than 25% between the amount of background predicted by detector simulations using two different input distributions and the background seen in the data for the protons. Corrections for this background are as large as 25% in central collisions near center of mass rapidity and decrease with increasing rapidity.
Each of these backgrounds is calculated and subtracted separately in each bin: the backgrounds discussed above are summarized in Table I.
is essentially the ratio of the number of neutrons which leave the target with momentum inside a given bin to the number of neutrons which strike the calorimeter (not including those which are from inelastic scattering) with momentum inside that bin. It is determined simply by a GEANT simulation of the experimental apparatus. The results of the acceptance simulation are largely insensitive to the assumed neutron input distribution, but some sharing between bins does take place particularly at large rapidity and transverse momentum.
To determine , we have constructed a library of isolated proton showers using the charged tracking system to identify protons and contamination cuts both in the calorimeter and from tracking to ensure clean showers. To determine the efficiency for neutron reconstruction in the calorimeter as a function of energy and position (or rapidity and transverse momentum), the overall times and energies of these clean proton showers were altered while leaving the relative times and energy fractions intact to simulate neutron showers. These fake neutron showers were overlaid on complete events in the calorimeter, one per event. Because in this manner we can simulate a shower of a neutron of known momentum striking the calorimeter in a known position, we can determine the efficiency for reconstructing these fake neutron showers and take this to be our reconstruction efficiency for real neutron showers. We find an average efficiency of approximately 35% with variations as a function of momentum.
The efficiencies of the individual analysis cuts are listed in Table II, both for a neutron shower on an empty calorimeter and for a neutron shower in a central heavy ion event. These efficiencies vary as a function of momentum and so are listed in two different rapidity ranges.
The overall efficiency on an empty calorimeter is on average about 70% and higher near central rapidity than near beam rapidity. The extra factor of two (from 70% to 35%) of loss in efficiency is then due to occupancy in the calorimeter. There are on average 10 showers in the neutral fiducial region of the calorimeter with peak energy greater than 1 GeV in a central event, leading to an overall occupancy of about 15% of the towers having an energy of 500 MeV or higher in an average event. The occupancy is somewhat greater nearer to the neutral line ( 20%) and less near the edges ( 5%). Although the overall occupancy is smaller for less central events, it is in fact slightly larger near the neutral line and thus the overall efficiency increases only by a few percent, with a larger increase at high transverse momentum (away from the neutral line).
The efficiencies for finding the neutron showers are crucial numbers in this analysis, so it is important that the method described above give us an accurate calculation of these efficiencies. As a check of this method we have repeated the process by following essentially the same recipe using protons rather than neutrons. That is, we add a proton shower from our shower library (along with fake hits in our other detectors to simulate the corresponding charged particle track) to a heavy ion event and calculate our efficiency for finding this fake proton shower (when we find the corresponding fake track). For protons, we can compare this efficiency to the efficiency for finding a real proton shower when we know a real proton hits the calorimeter (i.e. we find a proton track in our data). We do in fact find that the two methods of calculating the proton efficiencies agree to within 10% of one another with the differences largely explained by inefficiencies in our method for identifying isolated proton showers (refer to the paragraph following this one). With the implicit assumption that proton and neutron shower energy profiles will be basically indistinguishable at these energies of a few GeV, we conclude from this study that our method for determining the neutron efficiencies is sound to within 10%. Other differences in these processes for the protons and neutrons (faking of a charged particle tracks, slightly different angles of incidence for protons and neutrons across the calorimeter) have been studied and are not significant sources of error ([21] and [22, 14], respectively).
Two small corrections are then made to the numbers determined in this manner. The first is because we are artificially increasing the calorimeter occupancy by adding these fake neutron showers. We account for this following reference [23] and find that it amounts to never more than a 5% correction for any momentum bin and is significantly less over most of the momentum space we measure. The second is because the cuts placed on the proton shower library which were necessary to ensure isolated showers result in throwing out a few percent of showers which are not significantly contaminated. In particular, since part of the requirement for a clean proton shower is timing agreement among the towers in the shower, the set of proton showers does not include the tails of the timing agreement distribution. Thus neutron efficiencies calculated using proton showers are slightly overestimated. We determine the size of this correction partially by using data from a later run of the experiment with an incident beam of protons rather than heavy ions to reduce contamination of the proton showers. We estimate a resulting correction that is 2% at center of mass rapidity and rises to 9% at beam rapidity.
Sources of possible systematic error which we have quantified include:
-
Error due to the assumed input distributions of neutrons and sharing between neighboring bins (particularly in transverse momentum) in determination of both and . By using alternative input distributions, we estimate the size of this effect to be approximately 5% over most of the momentum space which we measure.
-
Possible differences in the calorimeter response to proton and neutron showers. This is quantified by explicitly changing the gains factors used in the analysis and observing the resulting change in measured yields. This adds only 3% to 5% systematic error over most of the acceptance but becomes larger near edges of our kinematic acceptance.
-
Assumed input distribution for background studies, both for scattered neutrons and for particle species other than neutrons. This adds a 10% systematic uncertainty near center of mass rapidity and decreases at higher rapidity.
-
Uncertainty in fit parameters in the subtraction of low mass background. This is estimated to add a maximum systematic error of 8% in any given bin and the uncertainty decreases as rapidity increases.
The statistical errors are generally dominated by systematics. We add these two types of errors in quadrature and list the total uncertainty in each bin along with the measurement in Table III.
III Results and Discussion
As in the E864 light nuclei measurements, we divide events into three centrality classes: 10% most central, 10-38% central and 38-66% central. The centrality is defined by our multiplicity detector and is reported in terms of percent of the geometric cross section defined by with = 1.2 fm.
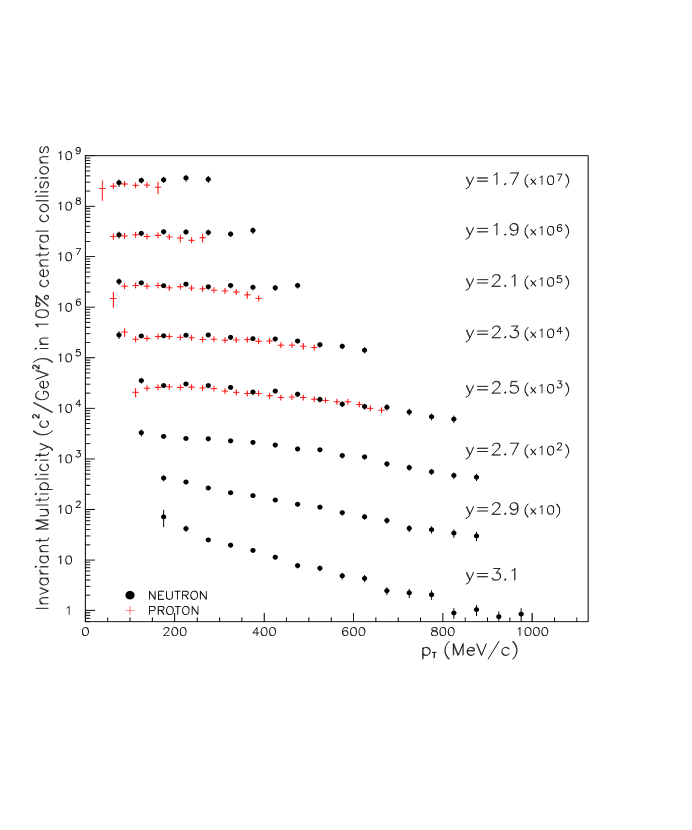
Measurements of neutron multiplicity in 10% most central Au + Pb collisions are presented in Figure 5 and in Table III. Also shown in Figure 5 are E864 measurements of proton invariant multiplicity [14] in central collisions for the rapidity range where they overlap the neutron measurements. Measurements in each rapidity bin are multiplied by a different factor of ten for presentational purposes. Agreement with the protons is quite close where comparisons are possible. This is consistent with the assumption that the spectra of the two species should not differ considerably other than by an overall scale factor, justifying for example the calculation of the light nuclei coalescence parameters, , in terms of the ratio of coalesced nuclei to protons only rather than protons and neutrons.
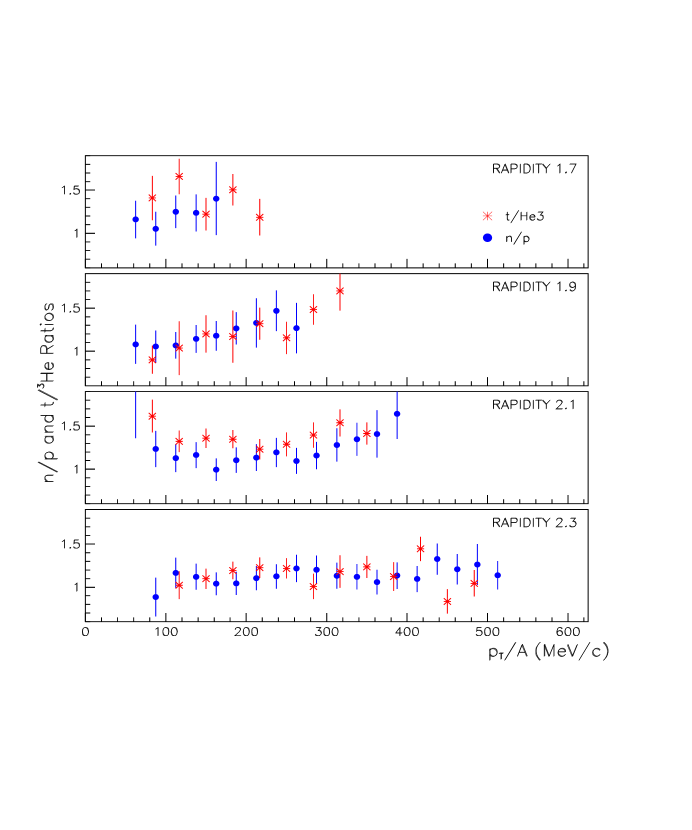
The agreement between the two species is made more quantitative by Figure 6 in which we show the neutron to proton ratio along with the triton to ratio [14] in the rapidity region where all four species are measured by E864. If we assume no kinematic dependence of the ratio and take a statistically weighted average of each point shown in Figure 6, we find an average ratio of .
To determine the ratio which is present at hadronic freeze-out of the system, we need to subtract from the nucleon multiplicities the results of feed-down from hyperon decays which occur long after freeze-out. To make this subtraction, we assume a distribution which is parameterized according to measurements by E891 [24] and use a distribution for the hyperons given by the cascade code RQMD version 2.3. We follow the hyperon decay products through a GEANT simulation of the E864 apparatus to determine the number of neutrons and protons in each momentum bin which are produced in these decays. We find that the contribution to nucleon invariant multiplicities from hyperon feed down is on the order of 15% . After correcting for this feed down, we find an average ratio at freeze out of .
At rapidities far from the beam rapidity of 3.2 such as are shown in Figure 6, light nuclei are very unlikely to be beam fragments [25, 26] and must therefore be formed by a coalescence mechanism. We expect then that the triton to ratio should match the neutron to proton ratio which is present at the time when this coalescence occurs. Computing a statistically weighted average, we obtain a ratio of . which is consistent with our value for the freeze out ratio.
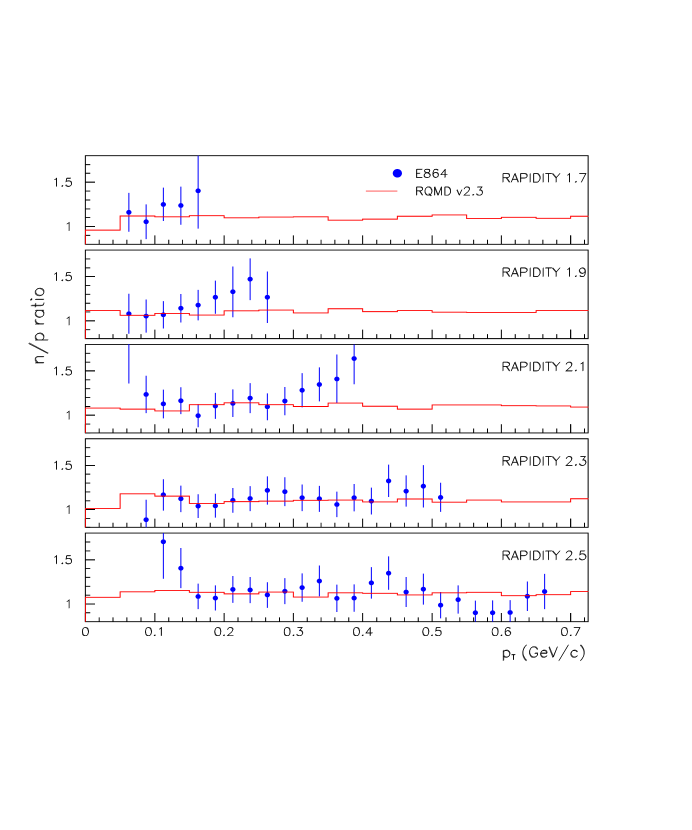
The incident nuclei have a total ratio of 1.52, so this observed final ratio of 1.19 signifies considerable equilibration of the two species from their initial abundances. This is not surprising in light of the amount of strong resonance production which is believed to occur in the collision system and which should facilitate the evolution of the system toward chemical equilibrium. Evidence for a large amount of resonance production is present in the measured pion transverse momentum spectra and to ratio in Au + Au type collisions at the AGS from experiments 866 [12] and 877[13]. RQMDv2.3 in fact predicts that for some duration of the evolution of an AGS Au + Au collision, the majority of baryons exist as strong resonances [27] and the resulting RQMD prediction for n/p ratios match reasonably well with our measurements (see Figure 7). Indeed, in a simplified isobar model (following [28]) in which half of all the incident nucleons are excited to resonances by the reaction with isospin conserved, the neutron to proton ratio reaches a value of less than 1.1 without any further interactions.
In a model which imposes chemical and thermal equilibrium on the system, there is the approximate constraint that (this is only strictly true if we assume also a Boltzmann distribution for each species). If we also impose the approximate conditions that the total number of nucleons is conserved (ignoring strange baryons) and that the total charge of the nucleons plus pions at freeze-out is equal to the initial charge of the system, we can obtain an approximate value for the ratio . With a freeze out neutron to proton ratio of 1.19, we obtain values of approximately 1.4 and 3 for and , respectively. Including feed-down from resonances in this simple equilibrium model does little to change these numbers.
These ratios are strongly dependent on the input ratio, and the results of these simple calculations can be made to agree reasonably well with measurements by E866 [12] and E877 [13] if we instead assume an ratio of 1.11 (the lower end of the range included in 1.19.08). This yields values of approximately 1.2 and 1.3 for and , respectively; thus this set of measurements can be accommodated within this simple model. Note also that the inclusion of a light quark saturation factor of larger than 1 as proposed in [29] can change the predictions from such a simple picture.
The predictions of neutron invariant multiplicity from RQMD version 2.3 [11] with and without mean field potentials are shown in Figure 8. As demonstrated, with potentials turned on the multiplicities near center of mass rapidity are under predicted by a factor of approximately two. Agreement in this rapidity range is much better with mean fields switched off. Near beam rapidity, RQMD over predicts the neutron yields; this is due at least in part to the fact that light nuclei are not included in RQMD but are likely present in large numbers as beam fragments near beam rapidity.
In the rapidity bins in which we have sufficient coverage in transverse momentum, the neutron data fit well to Boltzmann distributions in transverse mass,
| (2) |
(with ) as shown in Figure 9. The extracted inverse slope parameters, , are shown in Table IV. For the fits shown in Figure 9, we have excluded the points at lowest transverse momentum near beam rapidity (shown in Figure 9 as hollow circles) to minimize the effect of spectator neutrons on these slope parameters. Alternatively, we can use a fit to a sum of two Boltzmann distributions in these bins to account for these spectator neutrons, and the resulting slope parameters are the same as shown in Table IV within the quoted uncertainties. For the bins =2.3 and =2.5 where we also have measurements of proton inverse slope parameters, the slopes agree quite closely (see Table IV).
In Figure 10 we display the yields dN/dy for participant neutrons. These were determined by directly integrating our measurements where available and extrapolating with the Boltzmann fits shown in Figure 9 where necessary. The points with significant contributions from spectator neutrons which are displayed in Figure 9 as hollow points were not integrated directly (i.e. the Boltzmann fit was used to integrate these points).
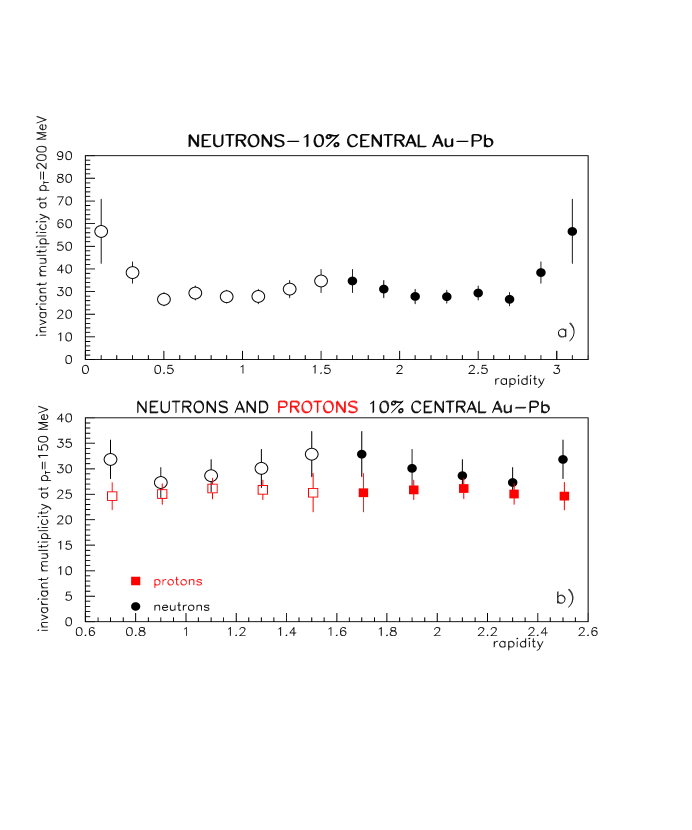
Due to our limited coverage in near center of mass rapidity we cannot accurately integrate the spectra to measure for neutrons in this region. To examine the behaviour of the spectrum as a function of rapidity we plot the invariant multiplicity near =0 versus in Figure 11 a). This range (150 to 250 MeV/c) was chosen because it was common among all rapidity bins. A similar plot showing comparison with the protons in a similar bite (100 to 200 MeV/c) is shown in Figure 11 b). There is some evidence here that the neutrons exhibit a slight peak near midrapidity while the protons are flat, but in light of the size of the systematic errors on these points, this evidence is slight. One can ask if such a difference in shape would be consistent with the additional coulomb repulsion felt by the protons. Under the assumption that the coulomb force only has an effect after the nucleons reach freeze-out from the strong force, one can with a very simplified model estimate the effect of the coulomb force on a proton following reference [30]. Assuming a freeze out radius and that all net charge of the source is contained within (in a simple spherically symmetric model, this should provide a generous upper limit for the coulomb effect), a proton with center of mass momentum will be accelerated to a momentum of . Taking = 150 and = 5 fm, we find that a proton at center of mass rapidity with =150 will receive an extra kick of 20 MeV/c from the coulomb interaction. With a more realistic assumption including some form of radial flow, however, the amount of charge that is contained within a sphere with radius equal to the freeze out radius of such a proton should be at most only a few percent of and so we do not expect any observable effect from the coulomb interaction.
Shown in Figure 12 are the neutron multiplicities for 10-38% and 38-66% most central events. These measurements include larger uncertainties than are present in the 10% most central data, particularly near center of mass rapidity where to a first approximation the neutron signal scales as the number of participants while background sources tend to remain constant or grow as the number of spectators. Corrections due to beam interactions which do not occur in the target are taken into account for these centralities using data from empty target runs, and this is not a significant source of systematic error.
We do see the qualitative behaviour which we expect in these centralities; the multiplicities near center of mass rapidity scale crudely with the number of participant nucleons and we see larger contribution from spectator neutrons at high rapidity and low as we go to less central events. We also note that the inverse slope parameters (see Table IV) become smaller as centrality decreases and as in the central data agreement between the proton and neutron inverse slope parameters is quite close where comparisons are possible.
IV Summary
We have presented results from Experiment 864 for neutron invariant multiplicities produced in 11.5 A GeV/c Au + Pb collisions. These are the first neutron measurements for a system of comparable size at AGS energies or above.
We observe little kinematic dependence of the neutron to proton ratio, consistent with the idea that the neutron spectrum should to a good approximation differ from the proton spectrum only by an overall scale factor. An average neutron to proton freeze-out ratio of is observed within .8 units of midrapidity. This value is consistent with E864 measurements of the ratio of coalesced tritons to nuclei and represents a significant equilibration from the initial state.
V Acknowledgements
We gratefully acknowledge the efforts of the AGS staff in providing the beam. This work was supported in part by grants from the Department of Energy (DOE) High Energy Physics Division, the DOE Nuclear Physics Division, and the National Science Foundation.
REFERENCES
- [1] Present address: Vanderbilt University, Nashville, Tennessee 37235
- [2] Present Address: Anderson Consulting, Hartford, CT
- [3] Present address: Univ. of Denver, Denver CO 80208
- [4] Deceased.
- [5] Present address: McKinsey & Co., New York, NY 10022
- [6] Present address: Department of Radiation Oncology, Medical College of Virginia, Richmond VA 23298
- [7] Present address: University of Tennessee, Knoxville TN 37996
- [8] Present address: Institut de Physique Nucléaire, 91406 Orsay Cedex, France
- [9] Present Address: Institute for Defense Analysis, Alexandria VA 22311
- [10] Present Address: MIT Lincoln Laboratory, Lexington MA 02420-9185
- [11] H. Sorge et al., Nucl. Phys. A525(1991) 95.
- [12] L. Ahle et al., Nucl. Phys. A610(1996) 139.; Z. Chen et al., in Proceedings of HIPAGS ’96, Report WSU-NP-96-16.
- [13] R. Lacasse et al., Nucl. Phys. A610(1996) 153.; T. W. Piazza et al. in, Proceedings of HIPAGS ’96, Report WSU-NP-96-16.
- [14] T. A. Armstrong et. al., to be submitted to Phys. Rev. C.; N. K. George, PhD Thesis, Yale University 1999.; T. A. Armstrong et. al., submitted to Phys. Rev. Lett., nucl-ex/9907002.
- [15] J.L. Nagle et. al., Phys. Rev. C 53(1996) 367.
- [16] H. Sato and K. Yazaki, Phys. Lett. 98B(1981) 153.
- [17] Y. Leifels et al., Phys. Rev. Lett. 71(1993) 963.
- [18] T. A. Armstrong et al., accepted for publication in Nucl. Inst. Meth.
- [19] T. A. Armstrong et al., Nucl. Inst. Meth. A406(1998)227.
- [20] P. Haridas et al., Nucl. Inst. Meth. A385(1997) 413.
- [21] L. Evan Finch, PhD Thesis, Yale University 1999.
- [22] Z. Xu, PhD Thesis, Yale University 1999.
- [23] The WA98 Collaboration, internal document ”Photon Efficiency Calculation Using Overlap Method”.
- [24] S. Ahmad et al., Phys. Lett. B 382(1996) 35.
- [25] L. C. Alexa et al., Phys. Rev. Lett. 82(1999) 1374;
- [26] D. Abbott et al., Phys. Rev. Lett. 82(1999) 1379.
- [27] M. Hofmann et al., Phys. Rev. C 51(1995) 2095.
- [28] D. Pelte. Talk presented at Park City Utah, January 9-16, 1999. nucl-ex/9902006.
- [29] J. Rafelski and J. Letessier. Talk presented at Park City Utah, January 9-16, 1999. hep-ph/9902365.
- [30] G. A. Baym and P. Braun-Munzinger, Nucl. Phys. A610(1996) 286.


| Level at | Level at | Determined by | |
| Background type | |||
| Low mass | 5-10 % | 1-3 % | Fit to data: mass peak + background |
| s,s,protons | 7-11 % | 2-13 % | GEANT+RQMD simulations |
| Scattered neutrons | 8-20 % | 4-9 % | GEANT+RQMD simulations, proton data |
| All other particles | 1 % | 1 % | GEANT+RQMD simulations |
| EMPTY | CENTRAL | EMPTY | CENTRAL | |
| Analysis Cut | ||||
| 98 % | 62 % | 93 % | 76 % | |
| 100 % | 74 % | 100 % | 75 % | |
| 100 % | 78 % | 100 % | 94 % | |
| Charged particle veto | 93 % | 93 % | 93 % | 93 % |
| Shower Energy Profile | 89 % | 66 % | 85 % | 68 % |
| 92 % | 71 % | 80 % | 68 % | |
| 1.7 | 1.9 | 2.1 | 2.3 | 2.5 | 2.7 | 2.9 | 3.1 | |
|---|---|---|---|---|---|---|---|---|
| 75 | 29.0 4.8 | 27.2 4.2 | 32.3 4.6 | 28.5 4.8 | ||||
| 125 | 32.3 4.2 | 29.0 3.6 | 30.5 3.3 | 27.1 3.0 | 35.4 4.7 | 33.1 5.1 | ||
| 175 | 33.4 4.7 | 31.1 3.9 | 26.8 3.0 | 27.5 2.9 | 28.3 3.0 | 27.9 3.1 | 41.9 5.9 | 71.3 26.3 |
| 225 | 36.0 5.4 | 31.0 3.8 | 28.8 3.3 | 28.1 2.9 | 30.3 3.2 | 25.4 2.8 | 34.8 3.8 | 41.8 5.5 |
| 275 | 34.2 5.6 | 30.2 3.7 | 25.4 2.9 | 28.2 3.1 | 28.1 3.0 | 25.0 2.8 | 26.6 2.9 | 25.1 2.7 |
| 325 | 28.2 3.7 | 27.0 3.1 | 25.3 2.8 | 26.1 2.9 | 22.7 2.5 | 21.4 2.3 | 19.6 2.2 | |
| 375 | 33.2 5.1 | 24.7 2.9 | 24.1 2.7 | 21.0 2.6 | 21.1 2.4 | 18.9 2.0 | 15.5 1.8 | |
| 425 | 24.2 3.1 | 23.6 2.7 | 22.0 2.5 | 18.7 2.1 | 15.3 1.7 | 11.4 1.3 | ||
| 475 | 27.0 3.7 | 21.5 2.6 | 19.0 2.3 | 15.8 1.8 | 12.7 1.4 | 7.8 1.0 | ||
| 525 | 18.1 2.1 | 15.1 1.9 | 15.2 1.8 | 11.1 1.3 | 6.9 0.9 | |||
| 575 | 17.0 2.1 | 12.1 1.6 | 11.6 1.4 | 8.6 1.1 | 4.8 0.7 | |||
| 625 | 14.2 2.0 | 10.9 1.4 | 11.0 1.3 | 7.1 0.9 | 4.3 0.7 | |||
| 675 | 10.5 1.5 | 7.9 1.0 | 6.0 0.8 | 2.5 0.4 | ||||
| 725 | 8.5 1.3 | 6.8 0.9 | 4.2 0.6 | 2.2 0.4 | ||||
| 775 | 6.8 1.1 | 5.6 0.8 | 4.0 0.7 | 2.1 0.4 | ||||
| 825 | 6.1 1.0 | 4.7 0.7 | 3.4 0.6 | 0.9 0.2 | ||||
| 875 | 4.3 0.7 | 3.0 0.6 | 1.0 0.3 | |||||
| 925 | 0.8 0.2 | |||||||
| 975 | 0.9 0.3 |
| Rapidity | 2.3 | 2.5 | 2.7 | 2.9 | 3.1 |
|---|---|---|---|---|---|
| (MeV) 10% central | 22327 (2.3/10) | 15011 (4.1/13) | 14410 (2.6/13) | 12111 (3.7/10) | 9510 (14/11) |
| (MeV) 10% central | 21316 | 16710 | |||
| (MeV) 10-38% | 18924 (2.8/10) | 13811 (7.3/13) | 1299 (6.9/13) | 11210 (10.6/10) | 9510 (8.7/11) |
| (MeV) 10-38% | 17512 | ||||
| (MeV) 38-66% | 17230 (3.2/10) | 11912 (2.4/13) | 12611 (6.6/13) | 9511 (7.1/10) | 809 (9.5/11) |
| (MeV) 38-66% | 1438 |