Production of Stable and Unstable Light Nuclei and Hyperfragments in 11.5 A GeV/c Au+Pb collisions
Abstract
We present measurements of the production of stable light nuclei for mass number , of strongly decaying states and and of the the hypernucleus . We also examine trends in the production of these multibaryon states as a function of kinematic variables and properties of the states including strangeness content.
1 INTRODUCTION
Experiment E864 at Brookhaven has a quite comprehensive set of measurements which addresses the topic of coalescence of multibaryon states in heavy-ion collisions at AGS energies. These include measurements of stable light nuclei from mass number =1 (including the first measurement of neutrons in an AGS Au+Pb or similar system) up to =7. In addition, we have measured production of the strongly decaying states and and the hypernucleus .
With this set of measurements we can systematically examine the dependences of production of coalesced states on kinematic variables and collision centrality as well as on the mass number, spin, isospin, and strangeness content of the state.
2 KINEMATIC AND CENTRALITY DEPENDENCES
Only for the lighter states () do we currently have sufficient statistics to study the kinematic and centrality dependences of production.
In Figure 2 we display inverse slope parameters for protons, deuterons, and nuclei as a function of mass number. These slope parameters are determined from Boltzmann fits in transverse mass within the rapidity range from 2.2 to 2.4 and are shown both for 10% most central events and more peripheral events. Polleri et. al. [1] have demonstrated that such trends in the temperature parameters of light nuclei are sensitive to both the spatial profile of coalescing nucleons and to the flow profile of the source. Our reach in mass up to =3 is then very useful in untangling these two profiles.


If we focus only on a narrow slice in transverse momentum at =100-200 MeV/c, we can examine the yields of these light nuclei as function of rapidity. We find that the invariant yields are concave in shape (i.e. are lowest at midrapidity and increase toward beam rapidity) and that the relative concavity increases as we move to nuclei with higher masses. This can be understood as an effect of longitudinal flow or incomplete stopping.
These and other trends in these lighter nuclei are explored much more fully in [2].
3 HEAVIER STABLE LIGHT NUCLEI
We now focus only on 10% most central events and on a kinematic region around =1.9, =200 MeV/c and explore the dependences of production on properties of the nuclei.
To start simply, we plot in Figure 2 the invariant yields in this narrow kinematic region as a function of mass number for . We see that over almost ten orders of magnitude, the yields are well described by a simple exponential dependence; implying that to add a nucleon to a cluster, one pays a penalty factor of approximately 48. There are small deviations from this trend, and we next move to trying to explain those.
Two dependences that are apparent are the spin and isospin dependences of the yields. Examining the ratios of invariant yields for , and near this same kinematic range, we find that and are consistent with a value of approximately 1.2 while the ratio is nearer to 0.3. The neutron, proton, triton, and are all spin =1/2, while is =0 and is =1. We take this as evidence that the yields of these nuclei include a dependence of (with ) where the first term accounts for the neutron to proton ratio at freeze-out and the second term is for the spin degeneracy of the state as is generally included in coalescence models.
We next take these measured invariant yields from Figure 2 and divide them by to remove these dependences on mass number, spin, and isospin of the states. We then look for any other trends in these ’corrected’ yields. In fact, we do see such a trend when we plot these ratios as a function of binding energy per nucleon as shown in Figure 4. This binding energy per nucleon is defined as the sum of all the masses of the constituent nucleons of a state less the nuclear mass all divided by the number of nucleons. We note the low temperature parameter of 6 MeV that we extract from this fit (strongly decaying states were not included in determining the fit).
It is possible then that this represents some final freeze-out of the nucleons at a much lower temperature than kinetic freeze-out, or it is possible that this is evidence of some other trend that coincidently shows up as a correlation with this binding energy. We are also exploring other possible correlations such as with nuclear size.

4 STRONGLY DECAYING STATES AND HYPERFRAGMENTS
To complement these measurements of stable light nuclei, we have made measurements of strongly decaying nuclei and the hypernucleus . Because these analyses both involve states which decay at most centimeters from our target (and therefore have decay products which are indistinguishable in our apparatus from particles originating from the target), they proceed along similar lines.
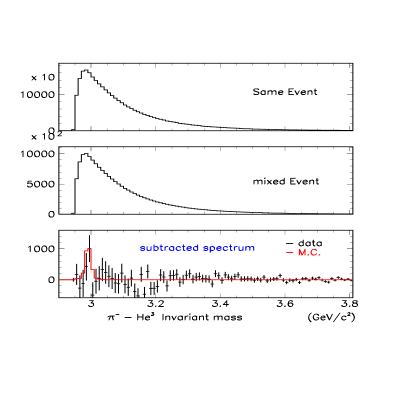
The measurements are made in each case by identifying both of the decay products in our apparatus. When a pair of decay products is found in an event, an invariant mass for the pair is calculated and placed in a histogram of pair invariant masses. To mimic and subtract away the background, pairs consisting of one decay product from one event and the second from a separate event are put though this same process, producing a second invariant mass histogram. The properly normalized difference of these two histograms should then be the signal under study as shown in Figure 4 (see [3] and [4] for details).
With this method we measure () through its decay to . On a gross scale, the invariant yields of these states sit closely along the trend shown in Figure 2. But on closer inspection in Figure 4, the yields for these states sit lower by a factor of 2 to 4 than the trend set by the stable light nuclei.
Perhaps still more interesting is the absence of any signal for the 16.7 MeV excited state from its decay to . From the absence of a signal, we set the 90% confidence level upper limit on production of this state as shown in Figures 2 and 4. Note that if we assume that the ground state production sits at its most probable value from our measurement, then this upper limit implies an upper limit for an ’excited state temperature’ of 15 MeV in a simple thermal picture; this is consistent with measurements [5] made at the lower energies of GSI and possibly indicative [5] of the same final-state interactions that may give rise to the the trend seen in Figure 4.
After the analysis of nearly 2/3 of the relevant data, we observe a signal for at approximately the level. When our analysis is complete, we expect if this is indeed a signal that with improved analysis methods and the use of the full statistics we will observe a signal at approximately the level.
We measure a preliminary invariant multiplicity for in the kinematic range of . We can then extract a total penalty factor for adding a unit of strangeness in this kinematic range by taking the ratio of the invariant yield to that of in the same kinematic region. This gives a penalty factor of . Some of this penalty is simply due to the fact that it is harder to get the all ingredients of a close enough in momentum space to coalesce than is the case for . We can remove this part of the penalty factor by normalizing each of these yields to the product of the invariant yields of their ingredient baryons in the relevant kinematic ranges. Using results from E891 for the yields and E864 measurements for the remaining quantities, we obtain as a preliminary result. This then represents a penalty of approximately 6 for coalescing a strange as opposed to a non-strange state; we note that this was predicted to be equal to 1 [6].
5 SUMMARY AND ACKNOWLEDGEMENTS
By our measurements of light nuclei with we can study trends in light nuclei production as a function of kinematics and centrality. In 10% central collisions in a limited kinematic range, we can explore dependences of production on mass, spin, isospin, strangeness, and potentially binding energy of the state up to mass number .
An interestingly low ’excited state temperature’ of less than 15 MeV is implied by our upper limit on production of , and our measurement of implies a larger than expected strangeness penalty factor.
We gratefully acknowledge the efforts of the AGS staff and support from the DOE High Energy and Nuclear Physics Divisions and the NSF.
References
- [1] A. Polleri et. al., Phys. Lett. B., 419 (1998) 19.
- [2] N.K. George, Proceedings of Park City Conference, January 1999.
- [3] R.D.Majka. Proceedings of APS Heavy-Ion Symposium, 1999. World Scientific.
- [4] S.Batsouli. Proceedings of APS Heavy-Ion Symposium, 1999. World Scientific.
- [5] V. Serfling et. al., Phys. Rev. Lett., 80 (1998) 3928.
- [6] A. J. Baltz et. al., Phys. Lett. B., 382 (1996) 35.