Study of intermediate velocity products in the Ar+Ni collisions between 52 and 95 A.MeV.
Abstract
Intermediate velocity products in Ar+Ni collisions from 52 to 95 A.MeV are studied in an experiment performed at the GANIL facility with the 4 multidetector INDRA. It is shown that these emissions cannot be explained by statistical decays of the quasi-projectile and the quasi-target in complete equilibrium. Three methods are used to isolate and characterize intermediate velocity products. The total mass of these products increases with the violence of the collision and reaches a large fraction of the system mass in mid-central collisions. This mass is found independent of the incident energy, but strongly dependent on the geometry of the collision. Finally it is shown that the kinematical characteristics of intermediate velocity products are weakly dependent on the experimental impact parameter, but strongly dependent on the incident energy. The observed trends are consistent with a participant-spectator like scenario or with neck emissions and/or break-up.
Keywords Heavy-ion collisions, intermediate energy range, 4 multidetector INDRA, neck emissions, participant-spectator scenario.
PACS code 25.70.-z
, , , , , , , , , , , , , , , , , , , , , , , , , , , , , , , , , , , , , , , , , , , , , , , , , , , , , , and , ††thanks: present address : Indiana University Cyclotron Facility, Bloomington, IN 47408, USA ††thanks: present address : Institute of Nuclear Research, Shangai, China ††thanks: present address : GSI, Postfach 110552, 64220 Darmstadt, Germany ††thanks: present address : CEA, DRFC/STEP, CE Cadarache, 13108 Saint-Paul-lez-Durance, France ††thanks: on leave of absence from Institute of Physics, Jagiellonian University, Reymonta 4, 30059 Kraków, Poland.
1 Introduction
Intermediate velocity products have shown to provide informations on the properties of nuclear matter. The study of in-plane flow (also called sideward flow) allows to determine the parameters of the nucleon-nucleon interaction by comparing the theoretical calculations to the experimental data [1, 2, 3, 4, 5, 6, 7, 8, 9, 10, 11, 12, 13, 14, 15, 16, 17, 18, 19, 20, 21]. In these studies, the in-plane flow is assumed to result from the particles emitted at the first moments of the collision (also called “mid-rapidity” emissions or “pre-equilibrium” emissions). But these studies have also shown that the flow parameter value is depending on the nature of the particle [9, 12, 17]. To understand this effect, a study of the emission mechanisms at mid-rapidity is needed. Indeed, theoretical calculations [22] have shown that an interplay between the mid-rapidity emissions and the particles emitted by the statistical decay of a quasi-projectile and a quasi-target could explain the dependence of observed in-plane flows on the particle nature. Other studies have shown that the amount of matter emitted at mid-rapidity is also sensitive to the parameters of the nucleon-nucleon interaction [23]. The aims of this article are: i) to understand the reaction mechanism(s) leading to the intermediate velocity emissions, ii) to estimate the amount of matter emitted at mid-rapidity to put constraints on theoretical calculations. In addition, it is necessary to recognize and exclude the contribution of dynamical emissions in order to perform valid statistical analysis of hot nuclei decay modes as for caloric curve studies [24, 25, 26, 27, 28] or binomial analysis [29]. These points underline the importance of studying intermediate velocity products.
If the overall characteristics of reaction mechanisms are now well known at low and relativistic energies, they are still highly discussed and not fully understood at intermediate energies. Below 20 A.MeV, pure binary processes, Deep Inelastic Collisions (DIC), are mainly observed for heavy systems while fusion process occurs for the light and medium mass systems in central and semi-central collisions [30]. Above 200 A.MeV, two excited spectators and a third source, the so-called participant zone, are present in the final stage over almost the whole range of impact parameters [5, 31, 32].
In the intermediate energy range, experimental results [33, 34] and theoretical calculations [35, 36, 37, 38] have shown that the reaction mechanism is mainly binary. The fusion cross section decreases with increasing beam energy and represents at most a few percent of the reaction cross section at incident energies above 50 A.MeV [34, 39]. For a very broad range of impact parameters, the final products can be attributed to two excited outgoing nuclei, namely the quasi-projectile (QP) and the quasi-target (QT), accompanied by dynamical emissions localized between the QP and QT rapidities, i.e. around mid-rapidity [34, 40, 41, 42, 43, 44]. This article will be devoted to the study of these intermediate velocity products. We use this name to avoid confusion with “mid-rapidity” emission which is often associated with very fast emissions.
Several scenarii were proposed to explain the origins of intermediate velocity products. We are going to describe them as a function of the reaction time.
In the first step of the collision, when the projectile and the target begin to overlap, some of their nucleons suffer nucleon-nucleon collisions in the interacting zone [33]. Part of these nucleons get (or keep) a sufficiently high energy to escape from the attractive potential of the bulk and are emitted around mid-rapidity. This emission was called “prompt” emission or preequilibrium emission and concerns mostly nucleons and light clusters (, , , , …). Cluster emission could be due to collisions of nucleons and/or clusters on pre-existing clusters. It could also be explained by the coalescence of prompt nucleons as predicted by AMD calculations [22].
After this stage, other intermediate products may come from the de-excitation of the overlap region. Its decay can occur during the sticking of QP and QT [45] and/or after their separation. Two scenarii are possible to explain the separation mechanism between the overlap region and the two partners: either the formation of a neck of matter between QP and QT, or a sharp and geometrical break-up between the QP and QT and the overlap region (i.e the participant-spectator scenario). The competition between these two mechanisms is governed by the interaction time.
If the di-nuclear system has enough time to reach a deformed shape, a neck of matter can be formed between the two interacting nuclei. Then, the rupture and/or the emission from the neck leads to the formation of products around mid-rapidity as observed [46, 47, 48, 49, 50, 51, 52, 53] and predicted [36, 37, 38, 53] from peripheral to semi-central collisions below 50 A.MeV. The shearing off may occur later on from one of the two outgoing nuclei. In this case, QP and/or QT are deformed along the axis which connects them and their decays are anisotropic: one observes a preferential emission in the backward region of the QP frame and/or in the forward zone of the QT frame. This emission enhances the product yields around mid-rapidity. This process was observed from peripheral to semi-central collisions [53, 54, 55] and was called fast emission or dynamic fission of the two outgoing nuclei. Obviously, one can observe in the same events both processes: dynamic fission and neck rupture.
If the system has not enough time to deform itself, then the reaction mechanism corresponds to the participant-spectator scenario [31]. One observes three sources: two spectators and a participant zone. The participant zone comes from the stopping of nuclear matter in the overlap region between the two colliding nuclei. Intermediate velocity products come from the decay of this participant zone created at mid-rapidity. The spectators correspond to the remaining matter of initial projectile and target which conserve a large part of their initial rapidities.
Above 50 A.MeV, the transition from the neck or dynamic fission processes to the participant-spectator scenario is expected. The properties of this transition would probably depend on the viscosity of hot (and compressed ?) nuclear matter in the interaction zone. It would give information on the viscosity of nuclear matter and on the in medium nucleon-nucleon cross-section.
This paper presents the results obtained in the study of reactions between 52 and 95 A.MeV using the INDRA detector. Following a brief description of the experimental conditions (section 2), the event selection and the impact parameter sorting will be presented (section 3). Section 4 will show the evidence for intermediate velocity products. Section 5 will describe three methods developed for the characterisation of these products. Quantitative estimates of this emission will be presented in section 6. The energy dissipated by intermediate velocity products will be examined in section 7. Conclusions will be drawn in section 8.
2 Experimental set-up
The experiment was performed at the GANIL facility with the INDRA detector. The beam impinged on a self supporting 193 target. Typical beam intensities were 3-4 pps. A minimal bias trigger was used: the events are registered when at least three charged particle detectors are fired, for beam energies smaller than 83 A.MeV, and at least four above.
The INDRA detector can be schematically described as a set of 17 detection rings centered on the beam axis. The detection of charged products was provided in each ring with two or three detection layers: the most forward ring, , is made of phoswich detectors (plastic scintillators NE102 + NE115); between and eight rings are constituted by three detector layers: ionization chambers, silicon and CsI(Tl); beyond , usually the eight remaining rings are made of double layers: ionization chambers and CsI(Tl) but for this experiment the ionization chambers were not yet installed for above . The total number of detection cells is 336 and the overall geometrical efficiency of INDRA detector corresponds to 90% of 4. A complete technical description of the INDRA detector and of its electronics is given in [56]. Isotopic separation was achieved up to Z=4 in the last layer (CsI(Tl)). Charge identification was possible up to Z=54 in the forward region () and up to Z=16 for . Due to the absence of backward ionization chambers in + experiments, fragments with Z¿4 could not be separated above . The energy resolution is equal to 5% on average for CsI(Tl) and ionization chambers and better than 2% for Silicon. The INDRA detector capacities allow one to carry out an event by event analysis and to determine reliable global variables related to the impact parameter.
3 Preliminary analysis
3.1 Selection of ”well measured” events
The first step in the analysis was to select events in which sufficient information was collected. This was achieved by requiring that for each selected event, , where , are respectively the charge and the parallel velocity of particle and the multiplicity, be larger than 70% of the initial of the projectile [57]. The number of events kept by this selection represents respectively 60 to 50% of the total registered events from 52 to 95 A.MeV. The major part of the eliminated events are characterized by a low multiplicity value, a small total detected charge and a low value of . These removed events correspond to some peripheral collisions in which the QT residue is not detected, the QP is lost in the forward 2∘ hole and only few light particles are detected.
Since we want to study the properties of intermediate velocity products as a function of impact parameter, we checked that this selection conserves the whole impact parameter range of registered events. We note that the multiplicity and the total transverse energy distributions of selected events cover the whole range of the respective raw distributions (i.e without any selection). If one assumes that the total multiplicity and total transverse energy are good measurements of the violence of the collision, then this result indicates that the whole impact parameter range of registered events is kept in the selected events.
Furthermore, for a proper study of intermediate velocity products, it is necessary to remove the fusion events. Indeed fusion nuclei, if any, are localized near the center-of-mass velocity and therefore their decay products are emitted in the same range of velocity as the intermediate velocity products. We eliminate most of the fusion events with a condition on the flow angle . This angle is defined as the angle of the main axis of the ellipsoid which represents the energy distribution of all detected products. One is calculated for each event. For fusion events the distribution is flat. Thus we removed the flat part of the distribution calculated at each incident energy, which corresponds to values above as in [58]. This represents 1% of the total cross section at 52 A.MeV and becomes negligible above 52 A.MeV.
3.2 Event sorting
The next step was to sort the events as a function of the violence of the collision. Since no global variable is perfectly correlated to the impact parameter, we will use two weakly correlated global variables related to the violence of the collision. The first one is the total detected transverse energy:
| (1) |
where is the multiplicity of the event, , are respectively the kinetic energy and the polar angle of the particle in the laboratory frame.
The events were sorted in bins. Assuming a monotonic relation between and the impact parameter, the cross section associated to each bin can be expressed as an experimentally estimated impact parameter [57]:
| (2) |
The first bin, associated to the highest , with a cross section of 31.4 mb, is linked to an experimental parameter 1 fm, the second bin is linked to 1 fm 2 fm and so on, up to the last bin which corresponds to 8 fm. This correspondence is established with the distribution of all detected events. The total cross section has been determined experimentally.
A second global variable has been used for the cases where the studied observable is too strongly correlated to , as in section 7. It is an energy per nucleon calculated event by event in the center-of-mass of fragments with A 3 emitted above mid-rapidity [24]:
| (3) |
where is the multiplicity of particles emitted above the mid-rapidity, , the kinetic energy in the fragments (A 3) frame. The quantity C includes the mass balance of emitted products and the estimated kinetic energy of neutrons assumed to be equal to the kinetic energy of protons minus the Coulomb energy.
is close to and is an estimation of the QP excitation energy per nucleon if the intermediate velocity products contribution and the overlap of the QP and QT emissions are quantitatively weak. As we use this variable only to estimate the violence of the collision, we will not discuss the meaning of the obtained values of . The highest are certainly reached in violent central collisions and the lowest values in gentle peripheral collisions. However the correlation between and the impact parameter is broader than with since only one half of the detected products are used to determine , whereas all the detected products are used to calculate . Thus we will not associate values of with this sorting, even if in average is correlated to the impact parameter.
4 Evidence for intermediate velocity products
4.1 Kinematical properties of the emitted products
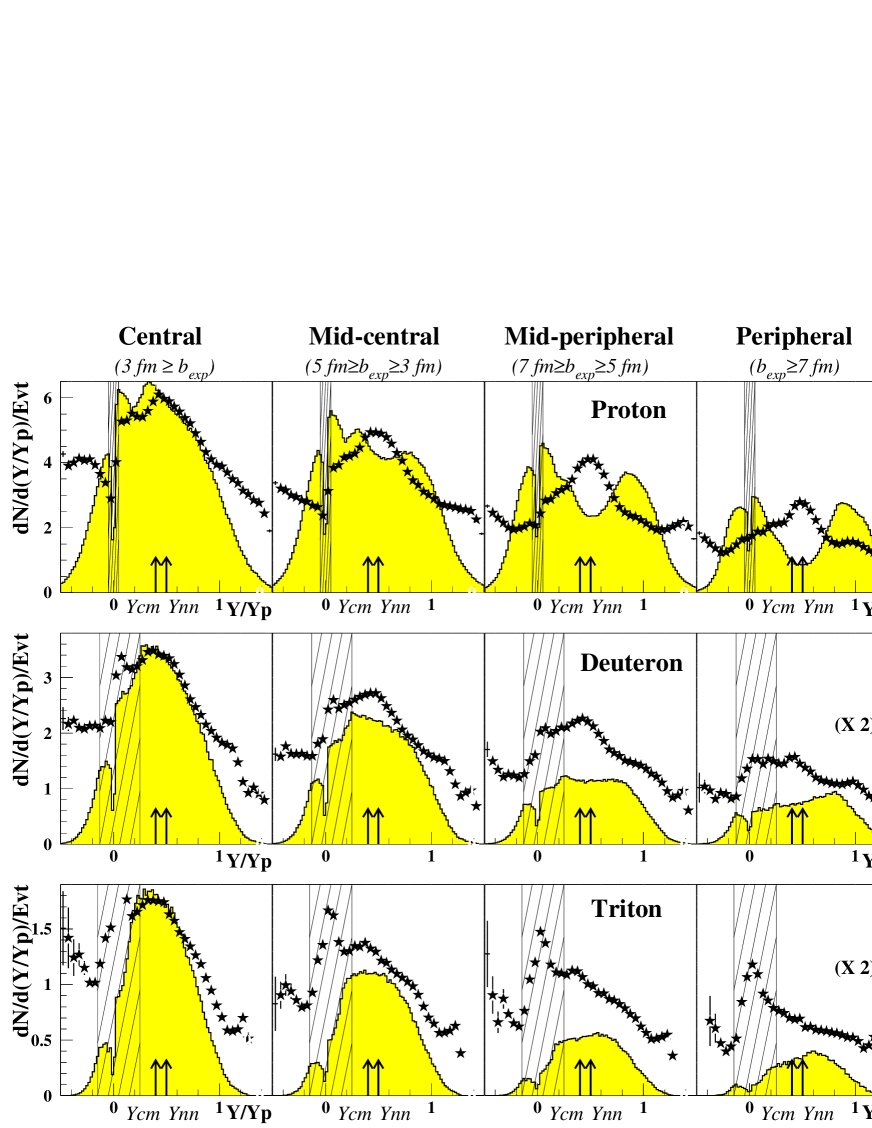
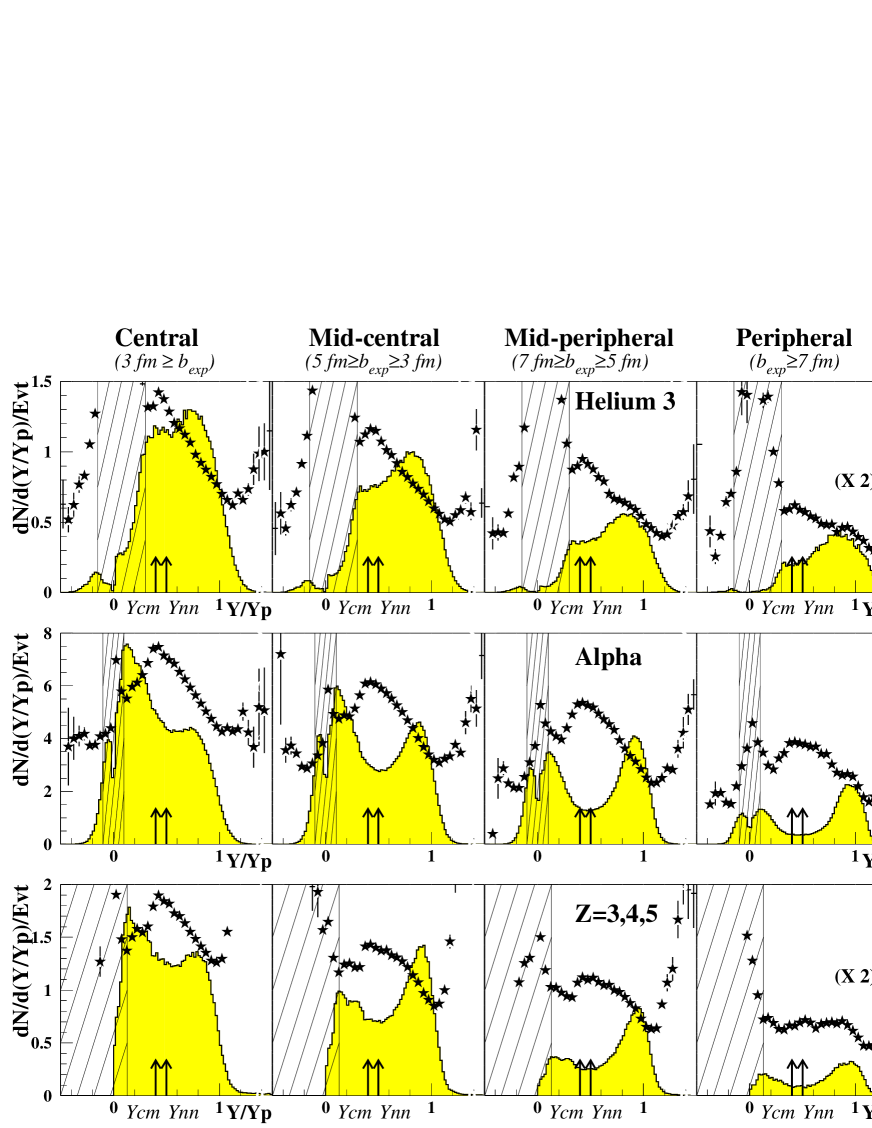
In order to have an overall view of production mechanisms in heavy-ion collisions, it is interesting to examine the properties of emitted products along and perpendicular to the beam axis. In figures 1 and 2 results are shown for four bins. The grey histograms correspond to the reduced rapidity (, where is the initial rapidity of the projectile) distributions in the laboratory frame for protons (p), deuterons (d) , tritons (t), helium 3 (), alpha particles () and Z=3,4,5 at 74 A.MeV. The left vertical scale corresponds to the differential multiplicity per event. In this intermediate energy range, the rapidity value is slightly larger than the reduced velocity value (). In these figures are also shown the mean transverse energies Et of each product versus (black stars and right hand scale). Indeed, such a plot was shown to provide a clear and direct evidence for the presence of intermediate velocity products different from products emitted by the equilibrated QP and QT [21]. The hatched areas correspond to the reduced rapidity ranges affected by the thresholds of the detectors.
As expected, one observes two hills in the reduced rapidity distributions (grey histograms on figures 1 and 2) of p, alpha and Z=3,4,5 near the rapidities of the projectile and target. They correspond to the QP and QT de-excitation. One also notices the presence of products near mid-rapidity (=0.5). Most of p, alpha, Z=3,4,5 come from the two partners de-excitation. On the other hand, d and t are mainly emitted around mid-rapidity. For , the situation is intermediate.
In addition, for every product we observe a maximum in Et around mid-rapidity (black stars on figures 1 and 2). This bump indicates that light particles and Z=3,4,5 emitted in the mid-rapidity region are more energetic than particles emitted by the two main partners (QP and QT, as it was observed with the system at similar incident energies [21]). One also notes that the energy of particles at mid-rapidity decreases when the estimated impact parameter increases. This decrease is due in part to the autocorrelation between the global variable (total transverse energy) used to sort the events and the transverse energy of the studied products. To avoid this problem, as already mentioned in the previous section, we will properly study the energetic properties of intermediate velocity products in section 7 with the sorting variable. The large increase in Et observed near the target rapidity is related to the identification thresholds which select high energy particles. The increase of observed in the forward area of the quasi-projectile and in the backward area of the quasi-target has been already observed for the system in [21]. It is not really understood and could be an experimental indication of the presence of promptly emitted particles in these rapidity areas [45].
The same kinematical trends have been observed from 52 up to 95 A.MeV. In summary, these kinematical properties suggest the existence of an emission at intermediate velocities (around mid-rapidity) which does not come from the statistical decay of the two partners (QP and QT).
4.2 Comparisons to a simulation
In order to confirm that the intermediate velocity products are not only evaporated by the QP and the QT, we have performed a simulation for the reaction at 74 A.MeV. Indeed, the observed kinematical properties could in principle be explained by a fast statistical emission from the QP and the QT:
-
•
Firstly, if the products are emitted in the earlier stages of the collision, then the two partners are close to each other in space. Therefore the emitted products are accelerated by the Coulomb fields of the two partners. This Coulomb boost could possibly explain the bump observed in Et around =0.5.
-
•
Secondly, these products could be emitted by the QP and the QT before they reach their asymptotic velocities. Consequently, this fast statistical component could enhance the product yield between the final rapidities of QP and QT residues. This hypothesis is particularly valid for d,t and which due to their higher separation energy than respectively p and alpha particles [59], are essentially emitted in the first decay steps of the hot nuclei decay. Thus d,t and could be emitted near center-of-mass rapidity as it is observed.
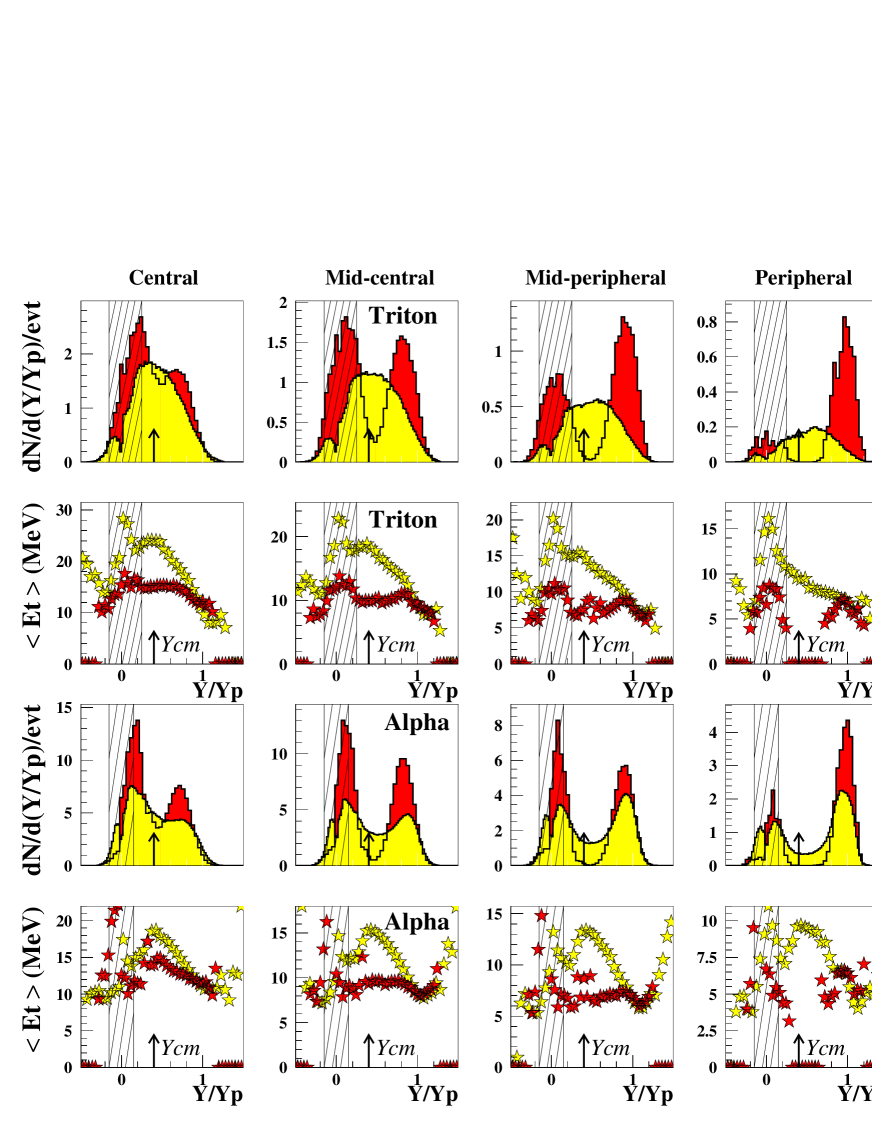
The calculations assuming a pure binary scenario have been done with the statistical code SIMON [60] which has been sucessfully used in its standard version in [24, 61]. No dynamical emission has been included in the calculations. To compare the results of the calculations with the experimental data, we used exactly the same procedure as in the experiment: the events were ”filtered” to simulate the effects of the INDRA detector and they were selected and sorted as in the experimental data. Furthermore, to enhance the contribution of the statistical emissions at mid-rapidity and to understand and enhance the role played by Coulomb effects we have divided the statistical emission time of QP and QT by 100.
The results are displayed in figure 3, for two kinds of products differing in their experimental distributions: those which are mostly coming from the de-excitation of the two partners (alpha particles) and those which are essentially emitted around =0.5 (tritons). In both cases, we note that the number and the mean transverse energy of the emitted products at intermediate velocities are strongly underestimated in the calculations.
In this simulation, the peaks near the QT and QP rapidities are found slightly asymmetric: this is due to particles which are emitted before the full acceleration of the QP and the QT. In the calculations, this fast statistical emission (when emission times are divided by 100) represents less than 5% of the standard statistical emission from the QP. This asymmetry disappears with standard statistical emission times. We notice that this asymmetry is more pronounced in experimental data and then cannot be explained by the statistical decay of the QP and the QT.
In conclusion, in addition to the statistical decay of the two partners there are in the collisions additional emissions which lead to the formation of products around mid-rapidity. As observed in figure 1, the detected d’s and t’s come mainly from the intermediate velocity zone. So, the properties of these particles could reflect the fundamental properties of intermediate velocity products in the collisions.
For the sake of simplicity, we now define two kinds of emission. The first one is attributed to the statistical decay of the two partners after complete equilibrium of all degrees of freedom including the slow ones (shape). This component has been found to be symmetrical in the QP or the QT frame. We call it statistical emissions (labelled SE in the figures). The second one is attributed to other emissions which differ from the statistical decay of QP and QT. We call this component intermediate velocity products (labelled IVP in the figures). One should keep in mind the possible occurrence of several production processes, as described in the introduction. There will be no attempt to distinguish the specific contribution of each possible process.
5 Separation of intermediate velocity products and statistical emission components
In order to quantify the contribution of the intermediate velocity products, we have used three methods. Two of them are based on the shape of the parallel rapidity distributions of detected products. The third one is based on a three source fit of the kinetic energy spectra. Because of the thresholds which do not allow one to detect the slowest products (and therefore affect the shape of rapidity distributions) and in order to avoid the contribution of the evaporated particles from the QT, only emitted products with a reduced rapidity () greater than 0.5 will be used for the two methods based on rapidity distribution shapes. The whole range of reduced rapidity will be used for the three source fit method, but only the values corresponding to the particles emitted above =0.5 will be presented.
5.1 Subtraction of the statistical decay of the QP: method EVAP
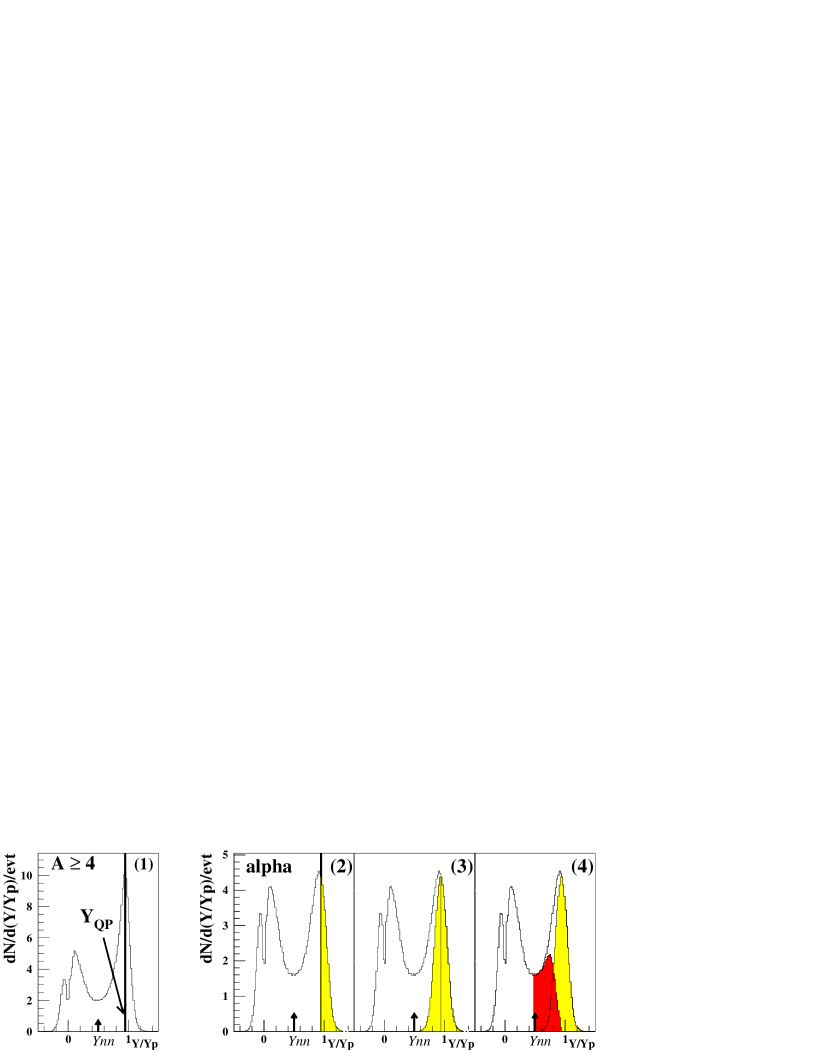
The first method, labelled EVAP, consists in removing the statistical emission component from the QP. The successive steps of method EVAP are displayed in figure 4.
In the first stage, we determine the most probable QP’s rapidity. Owing to an important intermediate velocity products component for A 3 (see figures 1 and 2) ,we assume that the maximum observed on the A 4 rapidity distributions above mid-rapidity corresponds to the QP rapidity (step 1). Then, we assume that all products which are emitted with a rapidity greater than the QP’s rapidity come from the statistical decay of the QP (step 2). The backward evaporated component of the QP is obtained by symmetrizing the forward part relative to the QP rapidity. The total statistical emission component is the sum of the backward and the forward component (step 3). Finally, to determine the intermediate velocity component we subtract the evaporated one from the total rapidity distributions (step 4).
One observes an excess of particles emitted below and close to the QP rapidity (shown in step 4 of figure 4). In order to check that this excess is not due to a pollution of more dissipative events (with a lower QP rapidity) which would have been badly sorted, we have selected events with fragments at a rapidity just below and close to the most probable QP rapidity. This selection has been done for each impact parameter value. If the selected fragments correspond to some more damped QP then the rapidity distributions of alpha particles emitted in coincidence should be centered around the rapidity of these fragments. It turned out that the alpha particles are emitted around the most probable QP rapidity. Thus the excess of particles emitted below and close to the most probable QP rapidity cannot be explained by the decay of more damped QP.
Some of the dynamically emitted particles may be localized around the QP rapidity zone. Therefore, with this method, the number of evaporated particles in the QP forward hemisphere may be overestimated and so the total evaporated component. We thus obtained a lower limit of intermediate velocity products contribution with this method.
5.2 Direct estimation of the intermediate velocity component: method DIRECT
The second method, labelled DIRECT, consists in extracting directly the intermediate velocity component. The successive steps of method DIRECT are displayed in figure 5.
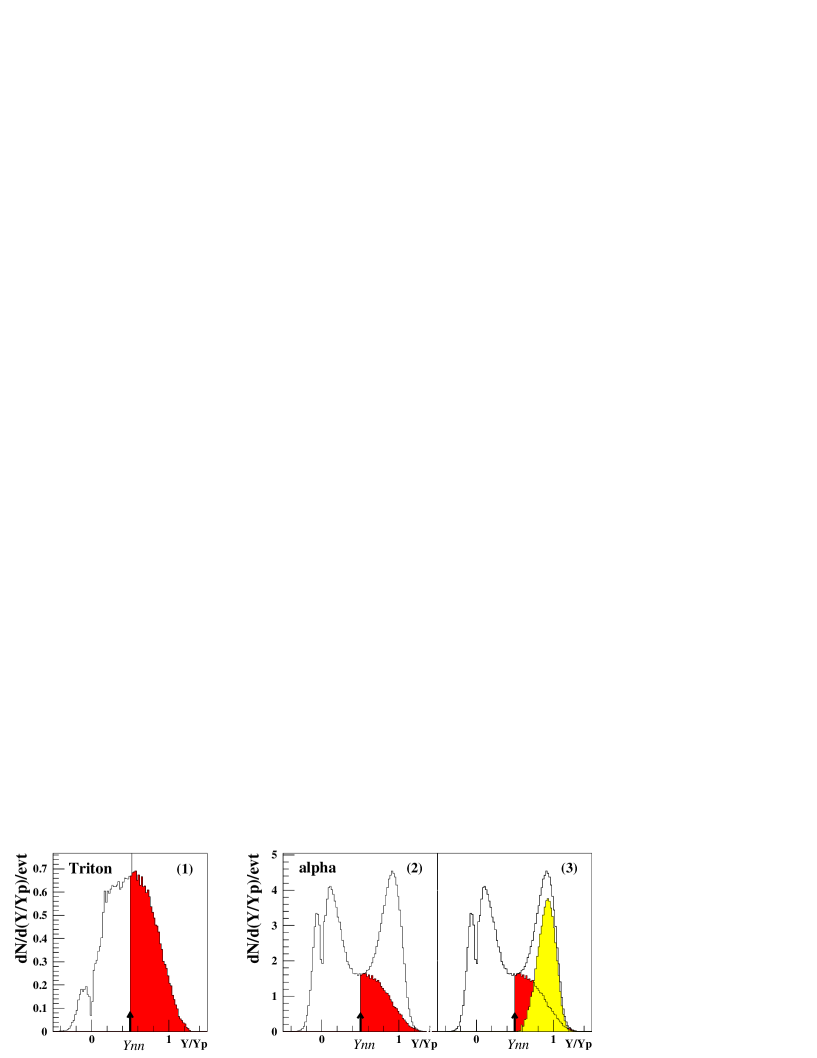
Figure 1 (lower panel) shows that the triton rapidity distributions are roughly symmetric around mid-rapidity. So, two assumptions are made: firstly, all tritons are intermediate velocity products (step 1), secondly, the shapes of the rapidity distributions of all intermediate rapidity products are homothetic to those of the tritons. To determine the intermediate velocity component of the other products, we normalize at mid-rapidity the triton’s rapidity distribution shape on their rapidity distributions (step 2). Then we subtract this intermediate velocity component from the total rapidity distribution to determine the evaporated component (step 3).
Some of the emitted tritons come from the statistical de-excitation of the QP (statistical emissions component). Therefore, the intermediate velocity component of the tritons and of the other products are overestimated, thus we get an upper limit of the intermediate velocity component.
Since methods EVAP and DIRECT are based on independent assumptions, we can check the consistency between the two methods. The method DIRECT is based on two hypotheses. The first one (step 1) was confirmed by the results obtained with method EVAP: more than 70 % of the emitted tritons come from the intermediate velocity component (except at 52 A.MeV in the three bins of highest total transverse energy i.e =1,2,3 fm). The second one (step 2) was also confirmed by method EVAP for p, d and t: the rapidity distribution shape of their intermediate velocity component, determined with method EVAP, is identical to the triton rapidity distribution shape. On the other hand, for alpha particles and the Z=3,4,5, we have observed an enhancement just below the QP’s rapidity. It may correspond to the dynamical break-up of the QP. This contribution, which is not totally taken into account with method DIRECT, is not large.
5.3 The three source fit method:
Three sources fit methods (labelled TSF) have been extensively used in the past [62, 63, 64] to obtain contributions, temperatures, velocities, Coulomb barriers of different sources of emission. The good granularity, energy resolution and isotopic separation provided by INDRA should allow a better adjustment of the fit parameters. We assume that QP, QT and intermediate velocity components can be approximated by three thermalised sources. It is only a way to model the different sources of emission since we do not know if thermal equilibrium is achieved for intermediate velocity products. The sum of three Maxwellian distributions is used to fit the energy spectra of emitted light particles. In the laboratory frame, it becomes :
| (4) |
Ni, Esi (=1/2 MpartV) and Ti being adjustable parameters and El and l, the energy and angle of the emitted particle in the laboratory. The 9 parameters can be reduced to 6 assuming that : i) QP and QT have the same temperature [40], ii) QP and QT parallel velocities are linked (VQT=(Mproj/Mtarget)(Vproj-VQP)), iii) two Ni can be expressed relatively to the third one.
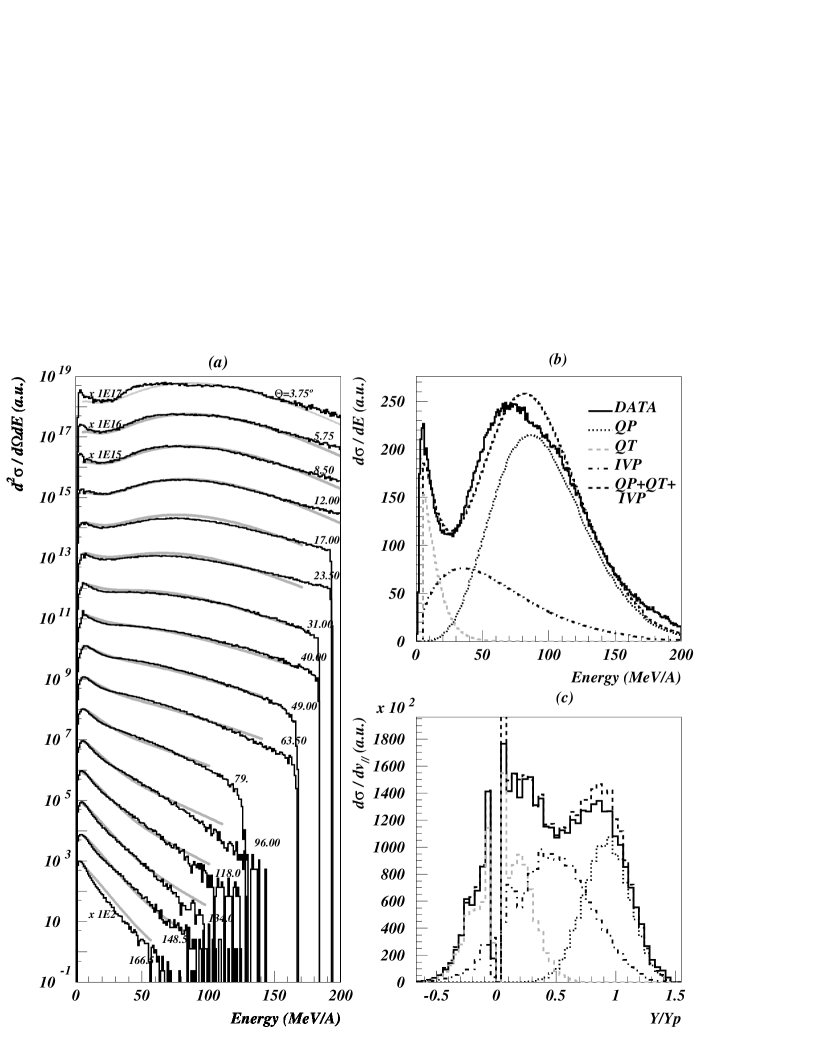
For each light particle species and each impact parameter bin, we fit the sixteen energy spectra (rings 2 to 17) with relation (4). As the Coulomb barriers have been neglected, for large impact parameters ( at 95 A.MeV and at 52 A.MeV), relation (4) cannot reproduce the two kinematical peaks of the QP emissions. The TSF has not been applied to these bins. The results obtained at 95 A.MeV for protons at b=5 fm are presented in figure 6. The histograms are the experimental distributions whereas the dotted lines are the results of the fit. The curves are displaced by a factor of 10 in order to present all of them on the same plot. The agreement is particularly good at forward angles. For backward angles, over two orders of magnitude, the agreement is still good. In figure 6 (b), the sum (d/dE) of all these curves is shown. The contribution of each source is also presented. We remark that intermediate velocity products extend over a broad energy range covering partially the region populated by products coming from projectile and target deexcitation. In figure 6 (c) the velocity spectrum ( d/dY) of each contribution shows the predominant role of the intermediate velocity products.
For each impact parameter, the light particle mean multiplicity for each source is obtained from the deconvoluted spectra like this of figure 6(c). Since the fragments present a small intermediate velocity contribution, we will use their mean multiplicities evaluated in a two source analysis [65]. We add them to the light particle and neutron (Multn = Multp) mean multiplicities to obtain the total mass of the system. In order to compare to the other two methods, only the part of the intermediate velocity component above 0.5 is taken into consideration. Results are presented in figure 7 (squares).
5.4 Validity and accuracy.
The accuracy of methods EVAP and DIRECT depends on our capacity to distinguish and separate the two components in the rapidity distributions. In the most central collisions and for the lowest energy, the damping of the two partners is large. So, some of the products emitted from the QP and the QT are localized around mid-rapidity, especially the contribution of QT emission for this slightly asymmetric system. These components may lead to overestimate the intermediate velocity component. The mixing of the two components is the largest in central collisions where the separation in two components becomes questionable. Nevertheless we will present the results obtained in the three bins of highest total transverse energy but in a dashed zone to keep in mind that the corresponding results are less accurate and may be meaningless. Finally, since method EVAP gives a lower limit of the number of intermediate velocity nucleons, and method DIRECT an upper limit, most of the results presented here will be average numbers.
In the most central collisions the mixing of the two components does not allow us to determine the QP’s rapidity with method EVAP. But we observed that the QP’s rapidity decreases regularly from peripheral to semi-central collisions (=3 fm). Thus, the QP rapidity was linearly extrapolated from =3 fm down to =0 fm. This represents a cross section of 280 mb or 11% of the total cross section.
As mentioned, the TSF method has been used only on light particles (p,d,t, and alpha). In contrast with methods EVAP and DIRECT the source velocities are free parameters whose value may depend upon the particle species. For a given impact parameter the velocities of the QP and of the intermediate velocity products deduced from the three sources fit vary within 10 (20) according to the particle species. Another difference comes from QT emissions taken into account with the TSF method through the angular distribution. This lowers the estimated intermediate velocity products contribution compared to EVAP and DIRECT methods. In contrast with these methods, TSF stays valid for small impact parameters. Since the impact parameter sorting could be correlated to the high kinetic energies of intermediate velocity products, another variable was used for sorting: the largest charge of the detected products (). The results are close to those presented here.
In references [66, 67], a pure binary scenario was assumed for events containing only light particles (=2). These events correspond to the most central collisions, and represent a very small part of the total cross-section. As said above, for these central collisions, the distinction between the different emission processes becomes questionable.
6 Characterization of intermediate velocity products
6.1 Estimations of masses involved in intermediate velocity products and statistical emissions.
The three methods allow us to determine the masses involved in intermediate velocity products and in statistical emissions by adding up the masses of detected products. In doing so we take into account the 90 geometrical efficiency and we assume that the number of emitted neutrons is equal to the number of detected protons. Finally, we take, for fragments with a charge greater than four, the corresponding mass on the -stability line since for these fragments only the charge is measured.
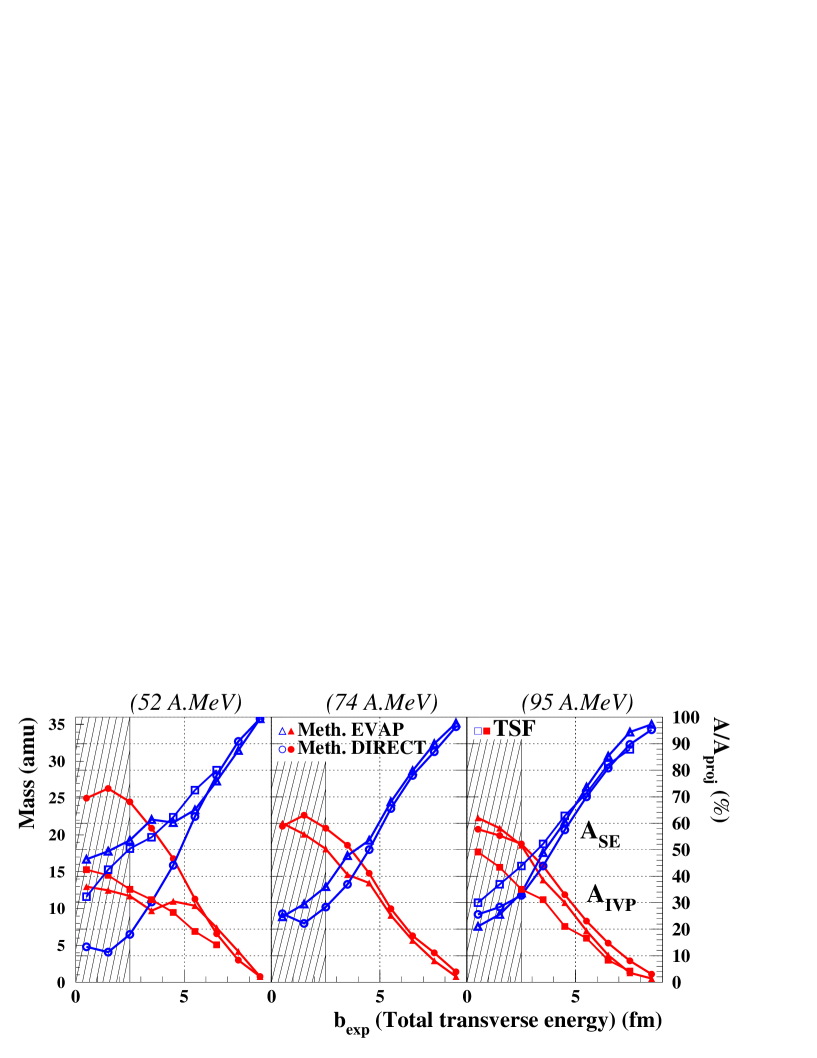
The total masses associated respectively to intermediate velocity emission and to statistical evaporation, above , obtained with methods EVAP and DIRECT at 52, 74 and 95 A.MeV are displayed versus the estimated impact parameter in figure 7. For 52 and 95 A.MeV, the results of the TSF method are also displayed (full and open squares).
As expected, we note that method DIRECT gives always a larger estimated intermediate velocity products mass than method EVAP and the TSF a smaller one. The larger difference between EVAP and DIRECT estimations observed in central collisions at 52 A.MeV is due to the lower accuracy of both methods as explained in section 5.
The mass of products emitted at intermediate velocity increases when the estimated impact parameter decreases. The opposite trend is observed for the mass resulting from statistical evaporation. Both features are observed for the three methods and are qualitatively consistent with theoretical predictions carried out on the system at 65 A.MeV [45]. On the other hand, the decrease with the experimental impact parameter of the mass associated to a statistical evaporation is different to what was observed in previous analysis where the mass of the primary QP was found nearly constant [34, 68, 69]. Indeed, in these studies all the products emitted above mid-rapidity (or center-of-mass rapidity) were used to calculate the QP’s rapidity (except hydrogen isotopes which were not used). Due to the presence of the intermediate velocity component the QP’s rapidities were underestimated and therefore the obtained values of QP mass were overestimated.
6.2 Dependence on incident energy of the total mass emitted at intermediate velocity
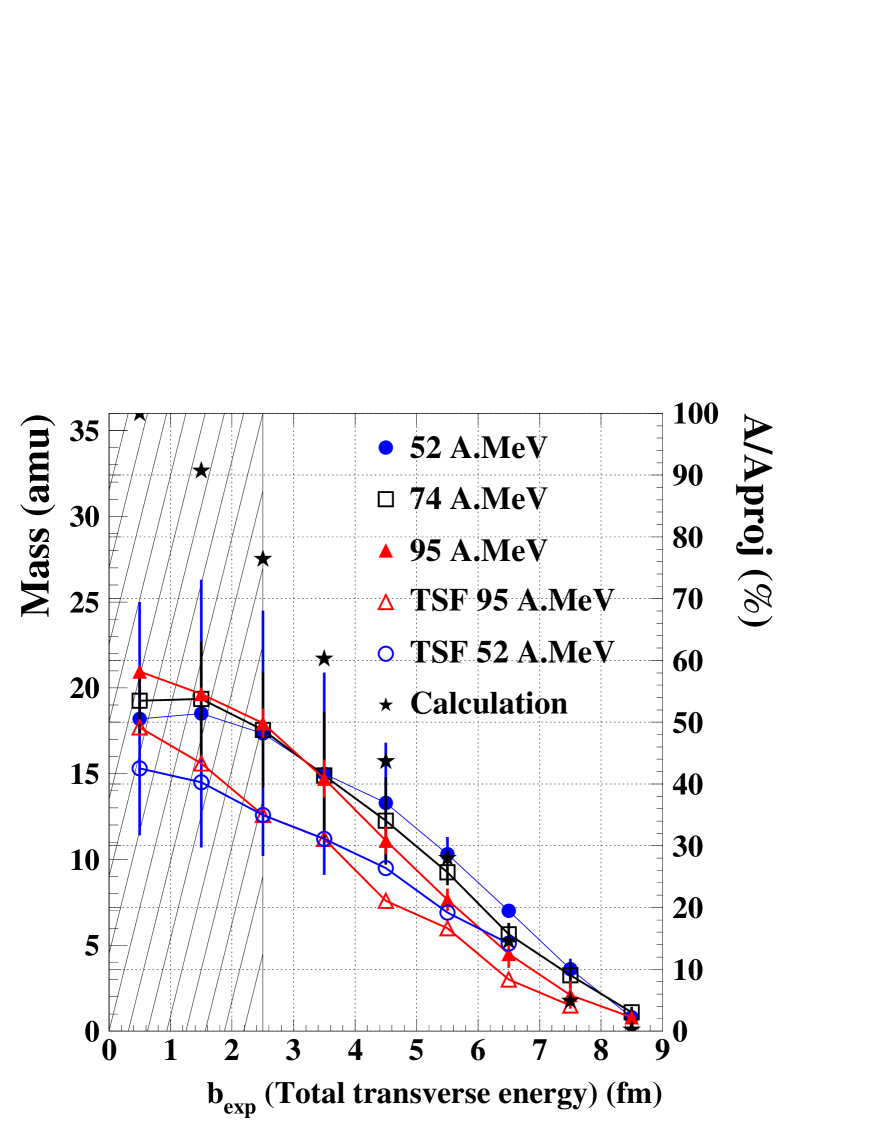
We also study the influence of the incident energy on the total mass emitted at intermediate velocity. In figure 8, we observe that the mean value extracted from method EVAP and DIRECT is not very sensitive on the incident energy within the error bars. This result is consistent with the constant shape of triton rapidity distributions. Nevertheless, owing to the lower accuracy of methods EVAP and DIRECT at 52 A.MeV, we are more confident in the intermediate velocity products total mass constancy from 74 A.MeV and above. For the TSF method, the variation of the intermediate velocity products mass as a function of the impact parameter is the same at 52 and 95 A.MeV. Thus, whatever the method used, it is found that the quantity of mass emitted at intermediate velocity depends only weakly upon the incident energy.
Finally, to check the influence of the experimental impact parameter on the mass emitted at intermediate velocity, we calculated the number of nucleons contained in the overlap region. We used an analytical method developed in [70] which determines the number of nucleons contained in the volume of interaction of a sphere and a cylinder. The geometrical calculations are displayed with black stars in figure 8. We note that the geometrical assumption is consistent with experimental data for values between 4 and 8 fm. For the most central collisions, the divergences could be due to the lower accuracy of the methods used, to the global variable (total transverse energy) used to sort the events which is less accurate to sort the central ( 3 fm) collisions [71] or to the existence of a target-like and a projectile-like remnants even for those central collisions [58].
One could argue that the number of intermediate velocity products is strongly correlated to , leading to the observation made here. The calculations of the correlation factors have shown that is more correlated to the multiplicity of the products emitted by the QP than to the multiplicity of intermediate velocity products. As it will be shown in section 7, this can be explained by a stronger increase of the average transverse kinetic energy for the QP emissions than for intermediate velocity emissions. Thus the strong dependence on the experimental impact parameter of the quantity of matter emitted at intermediate velocity is not due to a strong correlation of this mass with the sorting variable .
In conclusion, the increase when the estimated impact parameter decreases, of the mass emitted at intermediate velocity is consistent with a geometrical description : the mass involved is proportional to the volume of the interaction zone between the colliding nuclei except in central collisions ( 4 fm). This picture is further supported by the weak dependence of this emission on the incident energy.
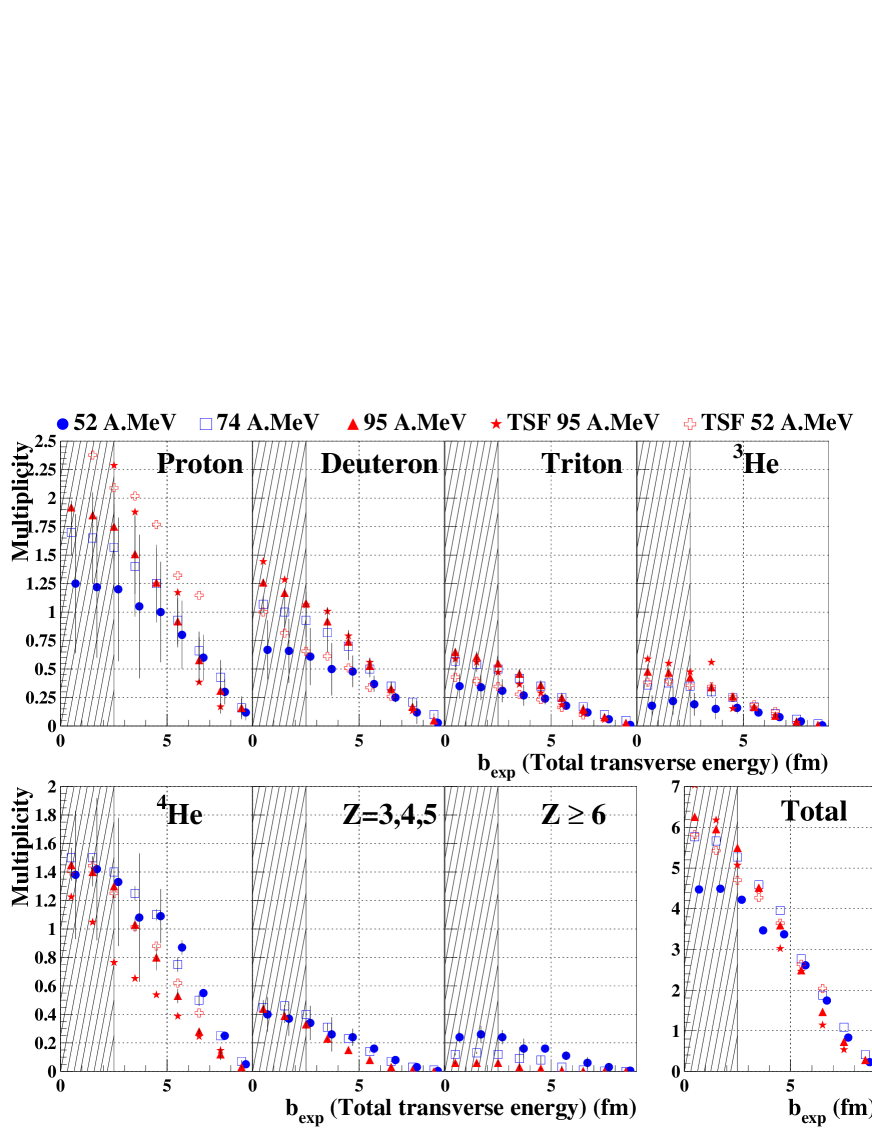
6.3 Multiplicity of intermediate velocity products
Figure 9 shows the absolute multiplicities of the intermediate velocity products (mean value obtained from methods EVAP and DIRECT), and TSF for 52 and 95 A.MeV as a function of the estimated impact parameter. A strong dependence is observed for the multiplicities of each kind of product. The decrease with is qualitatively consistent with previous results obtained with the system at the same incident energies [44]. It supports the role played by the geometry of the reaction. The dependence on incident energy is much weaker than the experimental impact parameter dependence. The multiplicities of alpha particles are systematically lower with the TSF method than with method EVAP and DIRECT. At small impact parameters, the QP source velocity deduced from the fit of the alpha particle spectra is much smaller than the one deduced from the fits of the other particle spectra. This leads to an important evaporative contribution of alpha particles and a lower intermediate velocity component
The intermediate velocity component is mainly made up of light charged particles (85-95% in number) whatever the impact parameter and the incident energy. Most of these particles are protons and alpha particles which represent respectively 30-40% and 20-30% in number and 10-20% and 30-40% in mass of the intermediate velocity products.
7 Energy dissipated in the intermediate velocity area
The temperature measurements are commonly used to characterize energetic properties of nuclei in which thermal (and chemical) equilibrium is achieved [72]. Recently, the caloric curve shown by the ALADIN group [73] has stimulated many theoretical and experimental studies about the accuracy of the different thermometers used [24, 25, 26, 27, 28, 61, 74]. In this section, we will present temperature measurements obtained for intermediate velocity products. Since there is no evidence around mid-rapidity for the existence of a source in which thermal equilibrium is attained, we will just use the measured thermometer values as indications of the energy dissipated in the intermediate velocity area. Thus, only the relative variations of the values of these thermometers will be discussed.
7.1 Definition of parameters used.
We use two kinds of methods. Firstly, we determine a parameter obtained from the production yields () of several pairs of light isotopes differing by one neutron (Double Ratio Parameter labeled DRP), according to [75]:
| (5) |
where () stands for the pair of isotopes with the smallest (largest) binding energy difference, and appears at the numerator (denominator) on the right hand side. is the difference of binding energy differences and depends on the spins and on the masses of the populated states. For more details see [73, 75]. If is calculated from the emitted products of an equilibrated (thermally and chemically) source, then is a measure of the temperature of this source. Nonetheless, the secondary decay of excited emitted fragments (side-feeding effect) lowers considerably the measured temperature with respect to the initial temperature of the source [61, 76].
Secondly, we determine the slope of kinetic energy distributions of intermediate velocity products. If the kinetic energy distributions are established in the frame of an equilibrated source, then their inverse slope parameter is a measure of the temperature of this source. The inverse slope parameters were obtained via the usual fits with Maxwell-Boltzmann distributions. The surface emission formula [77] has been used:
| (6) |
where is a normalization factor, is the kinetic energy of the emitted product in the source frame, the Coulomb barrier between the source and the emitted product and the temperature of the source. The obtained temperature is averaged over the de-excitation chain of the source and affected by successive recoil effects. The apparent temperatures are therefore lower than the initial ones [61]. The use of a volume emission formula, as for the three source fit method exposed in section 6, leads to very close values of the slope parameter.
We remind the reader that there is no evidence for the existence of an equilibrated source in the mid-rapidity region. Thus, to avoid any confusion, we will not associate a thermodynamical temperature to the parameters and . We will use them as indicators of the energy dissipated in the intermediate velocity area.
7.2 Dependence on the violence of the collision
In the first stage, we determined the average double ratio parameters () over the whole range of relative rapidity, except in the low rapidity region where thresholds affect the identification of light isotopes. These ratios were determined at 95 A.MeV for five bins in distribution (see equation 3 in section 3.2). The width of each bin is equal to 5 MeV. The results are displayed in figure 10 a).
The double ratio parameters measured around the QP rapidity increase with the violence of the collision. This fact is known and has been observed with different double ratio and slope parameters on the same system for the caloric curve study [24]. On the contrary, we note that the double ratio parameters at mid-rapidity are nearly constant whatever the violence of the collision. Thus it appears that the evolution with of the double ratio parameters for intermediate velocity products is different from the evolution of double ratio parameters of statistical emission.
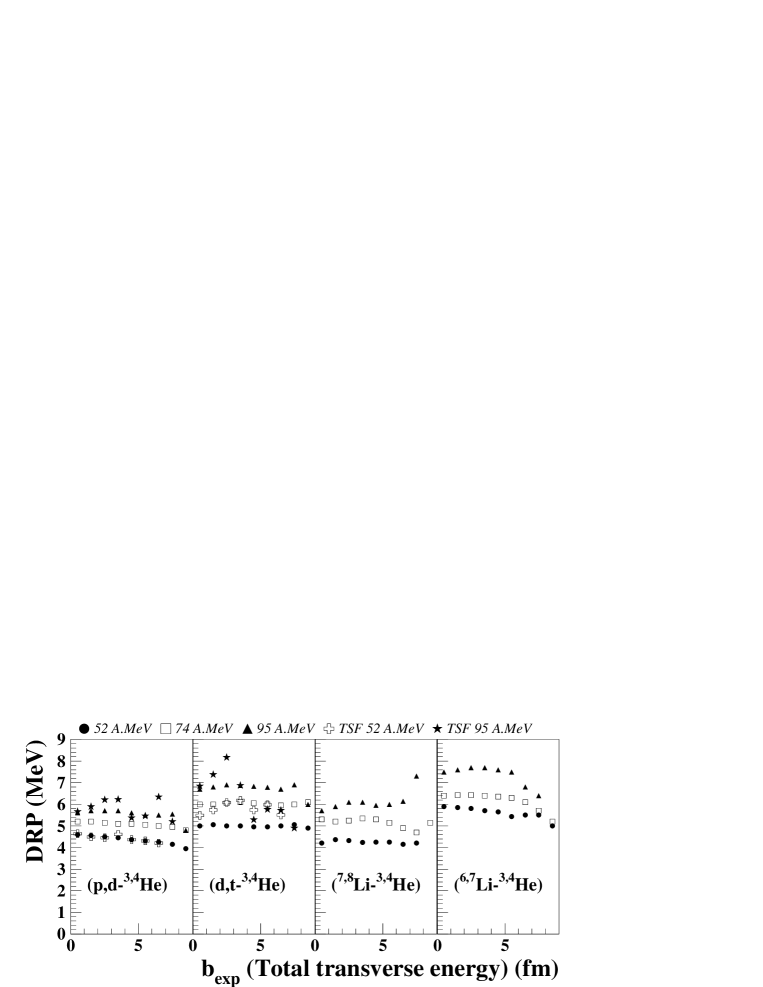
In order to confirm the near-constancy of the double ratio parameters for intermediate velocity products, it is necessary to isolate them to minimize the contribution from QP and QT statistical emission. For this purpose, two different cuts were applied : i) an angular cut where only products emitted at 90 15∘ in the mid-rapidity frame are considered; ii) a rapidity cut where only products emitted in the rapidity region 0.35 0.65 are kept. The four double ratio parameters from the following combination (), (), () and () are presented in fig. 10b) and 10c) using respectively the angular cut and the rapidity cut.
We note in figures 10 b) and 10 c) that with both selections the four double ratio parameters are insensitive to . This feature is observed whatever the selection used. Since there is no major difference between both selections, we will only use the angular cut in the remaining part of the article.
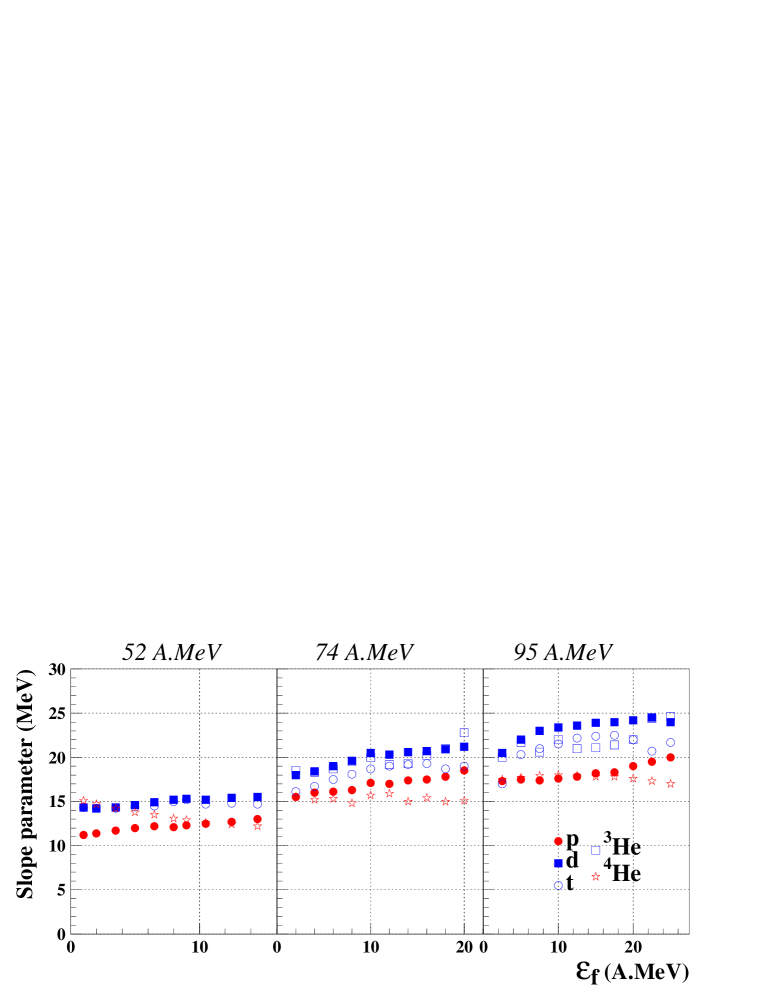
To check the independence on , of the energetic properties of the intermediate velocity products, we use another “thermometer”: the slope parameters of kinetic energy spectra of intermediate velocity products in the mid-rapidity frame. We obtained them for three incident energies (52, 74 and 95 A.MeV) and for five light particles: p, d, t, and . The results are displayed in figure 11. A weak dependence on is observed.
Finally, we have checked that this observation is independent of the global variable used to estimate the violence of the collision. Owing to the strong correlation between the total transverse energy and the kinetic energy of emitted products, it was not meaningful to measure the slope parameters of light particles with this sorting. That is why we determined only double ratio parameters. Figure 12 shows four double ratio parameters versus the estimated impact parameter. We note that the same weak dependence is observed. With the TSF method, the pd/3He4He and pt/3He4He for the intermediate velocity products are also roughly constant according to . These values are slightly different from the values obtained with the two other methods.
One can notice that the same system has been used for the study of the caloric curve in [24]. But the temperature values obtained from both analysis can not be directly compared. In [24] the temperature values have been extracted from the QP desexcitation whereas in this article the and values come from the intermediate velocity region. In addition, the data in [24] are consistent with the decay of an equilibrated source. For the intermediate velocity source, we do not have any proof that an equilibrium has been reached. Nonetheless, in the most central collisions of [24], one notes that the temperature values obtained are close to the DRP and S values of the intermediate velocity region. As already mentioned, for the central collisions it is hard to distinguish between the QP or QT emissions and the intermediate velocity emissions with our global variable. Therefore a possible mixing may explain this similarity.
In conclusion, the energetic properties of the intermediate velocity products are nearly independent of the violence of the collision whatever the thermometer and the sorting variable used. These results indicate that the available energy per nucleon for the production of light products at intermediate velocity is nearly constant over the whole range of impact parameters, i.e. it is independent of the collision geometry.
7.3 Dependence on the incident energy
In order to understand the origin of intermediate velocity products, it is also useful to study the dependence on the incident energy of their energetic properties. Indeed any dynamical process should give kinetic energies directly correlated to the incident energy.
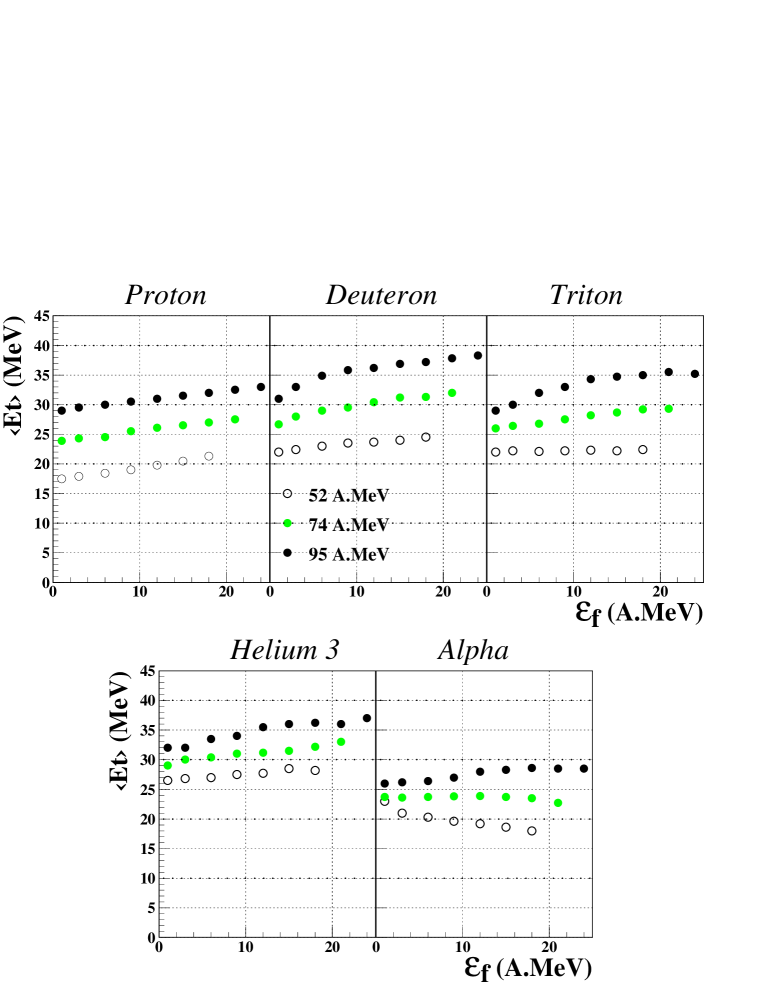
Figures 11 and 12 show that slope parameters and double ratio parameters increase with the incident energy. The same trend has been observed in [78]. In order to confirm this behaviour, we calculate the mean transverse energy of light particles versus at 52, 74 and 95 A.MeV. Intermediate velocity products are selected in the previously defined angular cut. The results are displayed in figure 13. We note that, except in peripheral collisions, the mean transverse energy of light particles increases proportionally to the incident energy. One can also notice that the mean transverse energy values calculated in figure 13 are higher than those observed in figures 1 and 2. This is due to the angular selection which avoids products with the lowest transverse energy and therefore increases the mean transverse energy values.
In the case of a thermal emission at intermediate velocity, one should expect roughly the same mean kinetic energy value for all the emitted light charged particles ( where is the coulomb barrier and T the temperature of the source). An overall agreement can be observed in figure 13 for the deutons, tritons and Helium 3 but the alpha particles are systematically lower than the others. The protons are somewhere between the alpha particles and the d,t and . The same general behaviour is observed in figure 11. A sole thermal emission is thus not consistent with the measured kinetic energies of intermediate velocity products.
In the case of a prompt emission, one expects the following mean kinetic energy at mid-rapidity:
| (7) |
where is the mass of the scattering particles and is the mean kinetic energy (= 12 MeV [33]) of the Fermi motion. This leads to a mean kinetic energy at mid-rapidity equal to 25 MeV, 30 MeV and 36 MeV at respectively 52, 74 and 95 MeV/A. One notes that the measured mean kinetic energy of protons are lower than the values obtained with a pure pompt emission. Unlikely, the mean kinetic energy of d, t and are more consistent. However, there is again no agreement between all the light charged particles. This latter observation confirms that intermediate velocity products come from different processes.
In summary, the energy dissipated in the intermediate velocity area is weakly dependent on the violence of the collision and is mainly governed by the incident energy. These properties support a dynamical origin for the intermediate velocity emissions or a participant-spectator scenario.
8 Summary
The present work is an attempt to characterize the products emitted at intermediate velocity in the reactions between 52 and 95 A.MeV using the INDRA detector.
The analysis of kinematical properties of light particles and intermediate mass fragments in both directions (perpendicular and parallel to the beam axis) suggests a particular type of emissions located around mid-rapidity. The significant differences observed between the experimental data and the calculations performed with a statistical code assuming two thermalised sources have clearly pointed out the existence of the intermediate velocity products (which could be due to several processes). Most of emitted deuterons and tritons come from those emissions.
Three methods have been developed to distinguish and separate two components: the intermediate velocity products which can include several emission processes, and the statistical emission from the fully equilibrated QP decay. We have determined the amount of matter associated to intermediate velocity products: their total mass is directly correlated to the impact parameter and depends only weakly on the incident energy. The total mass of the intermediate velocity products represents roughly 30-40% of the initial projectile mass in mid-central collisions. This result indicates that any study of the completely equilibrated QP decay has to be very carefully done. Finally, the total mass of the intermediate velocity products is mainly governed by the geometry of the collision from 52 up to 95 A.MeV. These properties suggest that the overlap zone of the two colliding nuclei is the origin of the intermediate velocity products.
Finally, we have examined the energy dissipated by the light particles and intermediate mass fragments in the intermediate velocity zone. The energy dissipated by the intermediate velocity products is weakly dependent on impact parameter but is directly correlated to the incident energy. These properties are consistent with dynamical origins for intermediate velocity products.
The three scenarii described in the introduction are consistent with the observed properties: i) prompt emission, i.e. products are emitted by direct collisions in the first steps of the collision; ii) formation and rupture of a neck of matter between the two colliding nuclei; iii) a participant-spectator model. These three scenarii are idealistic. Obviously, in the same event, the prompt emission can precede the formation of a participant zone or a neck of matter. It is also possible that other exotic processes take place. Dynamical calculations could be useful to check these different assumptions.
References
- [1] G.F. Bertsch, W.G. Lynch and M.B. Tsang, Phys. Lett. B189 (1987) 384.
- [2] A. Buta et al., Nucl. Phys. A583 (1995) 397.
- [3] P. Danielewicz, H. Ströbele and G. Odyniec, Phys. Rev. C38 (1988) 120.
- [4] K.G.R. Doss, Phys. Rev. Lett. C57 (1986) 302.
- [5] H.A. Gustafsson et al, Phys. Rev. Lett., Vol 52, (1984) 1590.
- [6] H.H. Gutbrod et al., Phys. Rev. C42 (1990) 640.
- [7] Z.Y. He et al., Nucl. Phys. A598 (1996) 248.
- [8] D. Krofcheck et al., Phys. Rev. C46 (1992) 1416.
- [9] B. Li et al., Phys. Rev. Lett. 76 (1996) 4492.
- [10] V. De La Mota and F. Sebille, Phys. Rev. C46 (1992) 677.
- [11] C.A. Ogilvie, Phys. Rev. C40 (1989) 2592.
- [12] R. Pak et al., Phys. Rev. Lett. 78 (1997) 1022.
- [13] R. Popescu et al., Phys. Lett. B331 (1994) 285.
- [14] W.Q. Shen et al., Nucl. Phys. A551 (1993) 333.
- [15] H. Stöcker, J.A. Maruhn and W. Greiner, Phys. Rev. Lett. 44 (1980) 725.
- [16] J.P. Sullivan et al., Phys. Lett. B249 (1990) 8.
- [17] G.D. Westfall et al., Phys. Rev. Lett. 71 (1993) 1986.
- [18] W. Reisdorf and H.G. Ritter, Annu. Rev. Nucl. Part. Sci. (1997) 663, and references therein.
- [19] H.M. Xu et al., Phys. Rev. Lett. 67 (1991) 2769.
- [20] J. Zhang and C. Gale, Phys. Rev. C51 (1995) 1425.
- [21] J.C. Angélique, A. Buta, G. Bizard, D. Cussol, A. Péghaire, J. Péter, R. Pospescu et al , Nuc. Phys. A614 (1997) 261.
- [22] A. Ono and H. Horiuchi, Phys. Rev. C51, (1995) 299.
- [23] E. Galichet et al, Proc. XXXVIth Int. Winter Meeting on Nuc. Phys., ed. by I. Iori, Bormio (Italy), (January 1998); and PhD Thesis (1998), Université de Lyon.
- [24] Y.G. Ma, A. Siwek, J. Péter, F. Gulminelli, R. Dayras, L. Nalpas, B. Tamain, E. Vient et al, Phys. Lett. B, Vol 390 (1997) 41.
- [25] J.B. Natowitz, K. Hagel, R. Wada, Z. Majka et al, Phys. Rev. C52, (1995) R2322.
- [26] L.G. Moretto, R. Ghetti, L. Phair, K. Tso and J.G. Wozniak, Phys. Rev. Lett. 76, (1996) 2822.
- [27] J.A. Hauger et al, Phys. Rev. Lett. 77, (1996) 235.
- [28] K. Kwiatkowski et al, Phys. Lett. B423, (1998) 21.
- [29] L.G. Moretto et al, Phys. Rep. 287 (1997) 249.
- [30] M. Lefort and C. Ngô, Annale de Phys. Fr., Vol 3 (1978) 5.
- [31] W. Scheid, H. Müller and W. Greiner, Phys. Rev. Lett., Vol 32, (1974) 741.
- [32] G.D. Westfall et al, Phys. Rev. Lett. Vol.37 No 18 (1976) 1202.
- [33] H. Fuchs and K. Möhring, , Rep. Prog. Phys. 57, (1994) 231 and reference therein.
- [34] J. Péter, S.C. Jeong et al, Nuc. Phys. A593, (1995) 95.
- [35] G. Peilert, H. Stöcker and W. Greiner, Rep. Prog. Phys. 57, (1994) 533.
- [36] L.G. Sobotka, Phys. Rev. C50, (1994) R1272.
- [37] M. Colonna, M.Di Toro et al, Nuc. Phys. A583, (1995) 525.
- [38] M. Colonna, M.Di Toro and A. Guarnera, Nuc. Phys. A589, (1995) 160.
- [39] L. Beaulieu, Y. Larochelle, L. Gingras et al, Phys. Rev. Lett., Vol 77, (1996) 462.
- [40] G. Lanzano, A. Pagano, G. Blancato, E. De Filippo, M. Geraci, R. Dayras, B. Berthier, F. Gadi-Dayras, R. Legrain, E. Pollacco, B. Heusch, Phys. Rev. C58 (1998) 281.
- [41] R. Dayras, R. Coniglione, J. Barrette, B. Berthier, D.M. de Castro Rizzo, O. Cisse, F. Gadi, R. Legrain, M.C. Mermaz, H. Delagrande, W. Mittig, B. Heusch, G. Lanzano, A. Pagano, Phys. Rev. Lett. 62 (1989) 1017.
- [42] J.E. Sauvestre, J.L. Charvet, R. Dayras, C. Volant, B. Berthier, R. Legrain, R. Lucas, E.C. Pollacco, E. De Filippo, G. Lanzano, A. Pagano, C. Beck, B. Djerroud, Phys. Lett. B 335 (1994) 300-306.
- [43] M.B. Tsang et al., Phys. Rev. Lett. 57 (1986) 559.
- [44] J. Péter, J.P. Sullivan, D. Cussol et al, Phys. Lett. B, Vol 237, (1990) 187.
- [45] P. Eudes, Z. Basrak and F. Sebille, Phys. Rev. C56, (1997) 2003.
- [46] L. Stuttgé et al, Nuc. Phys. A539 (1992) 511.
- [47] J.F. Lecolley, L. Stuttgé et al, Phys. Lett. B, Vol 354 (1995) 202.
- [48] Y. Larochelle, C. St-Pierre, L. Beaulieu, N. Colonna, L. Gingras et al, Phys. Rev. C59, (1999) R565.
- [49] J.F. Dempsey et al, Phys. Rev. C54, (1996) 1710.
- [50] J. Tõke, B. Lott et al, Nuc. Phys. A583, (1995) 519;
- [51] S. L. Chen, R. T. de Souza et al, Phys. Rev. C54, (1996) R2214.
- [52] C.P. Montoya, W.G. Lynch, D.R. Bowman, G.F. Peaslee, N. Carlin, R.T. de Souza et al, Phys. Rev. Lett., Vol 73, (1994) 3070.
- [53] J. Lukasik, J. Benlliure, V. Métivier, E. Plagnol, B. Tamain et al , Phys. Rev. C55 (1997) 1906.
- [54] G. Casini et al, Phys. Rev. Lett. 71 (1993) 2567.
- [55] A.A. Stefanini et al, Zur. Phys. A351 (1995) 167.
- [56] J. Pouthas et al, Nuc. Inst. Meth. in Phys. Res. A357, (1995) 418. J. Pouthas et al, Nuc. Inst. Meth. in Phys. Res. A369 (1996) 222.
- [57] J. Péter et al, Nuc. Phys. A519, (1990) 611.
- [58] N. Marie, R. Laforest, R. Bougault, J.P. Wieleczko, D. Durand, C.O. Bacri, J.F. Lecolley, F. Saint-Laurent et al. Phys. Lett. B391, (1997) 15.
- [59] R. Bougault et al, Proc. XXXVth Int. Winter Meeting on Nuc. Phys., ed. by I. Iori, Bormio (Italy), (January 1997).
- [60] D. Durand, Nuc. Phys. A541 (1992) 266.
- [61] A. Siwek, D. Durand, F. Gulminelli, J. Péter, Phys. Rev. C57, (1998) 2507.
- [62] U. Milkau, M.L. Begemann-Blaich, E.M. Eckert, G. Imme, P. Kreutz, A. Kuhmichel, M. Lattuada, U. Lynen, C. Mazur, W.F.J. Muller, J.B. Natowitz, C. Ngo, J. Pochodzalla, G. Raciti, M. Ribrag, H. Sann, W. Trautmann, R. Trockel, Z. Phys. A 346 (1993) 227.
- [63] J.L. Wile et al., Phys. Lett. B264 (1991) 26.
- [64] B. V. Jacak, G.D. Westfall, G. M. Crawley, D. Fox, C. K. Gelbke, L. H. Harwood, B. E. Hasselquist, W. G. Lynch, D. K. Scott, H. Stöcker, M. B. Tsang, G. Buchwald, Phys. Rev. C35 (1987) 1751
- [65] D. Doré et al, Proc. XXXVIth Int. Winter Meeting on Nuc. Phys., ed. by I. Iori, Bormio (Italy), (January 1998).
- [66] M.F.Rivet et al., Phys. Lett. B388 (1996) 219.
- [67] B.Borderie et al., Phys. Lett. B388 (1996) 224.
- [68] J.C. Steckmeyer, A. Kerambrun et al., Phys. Rev. Lett., Vol 76 (1996) 4895.
- [69] D. Cussol et al, Nuc. Phys. A561 (1993) 298.
- [70] J. Gosset, H.H. Gutbrod, W.G. Meyer, A.M. Poskanzer, A. Sandoval, R. Stock and G.D. Westfall, Phys. Rev. C16, (1977) 629.
- [71] T. Lefort, PhD Thesis, Université de Caen (1997).
- [72] D.J. Morrissey, W. Benenson, W. Friedman, Annu. Rev. Part. Sci., (1994) 27.
- [73] J. Pochodzalla et al, Phys. Rev. Lett. 75, (1995) 1040.
- [74] F. Gulminelli and D. Durand, Nuc. Phys. A615, (1997) 117.
- [75] S. Albergo et al , Nuovo Cimento A89 (1985) 1.
- [76] H. Xi, W.G. Lynch, M.B. Tsang, W.A. Friedman and D. Durand, Phys. Rev. C59, (1999) 1567 and references therein.
- [77] A.S Goldhaber, Phys. Rev. C17 (1978) 2243.
- [78] Z. Chen et al, Phys. Lett. B199 (1987) 171.