Submitted to Physics Letters 5/12/99
Spin Correlation Coefficients in
from 325 to 400 MeV
Abstract
The spin correlation coefficient combinations , and the analyzing powers were measured for at beam energies of 325, 350, 375 and 400 MeV. A polarized internal atomic hydrogen target and a stored, polarized proton beam were used. These polarization observables are sensitive to contributions of higher partial waves. A comparison with recent theoretical calculations is provided.
pacs:
24.70.+s, 25.10.+s, 29.25.Pj, 29.27.HjI Introduction
Pion production in nucleon-nucleon collisions has been given increased attention due to the recent availability of precise near-threshold data for , and . These reactions involve a large momentum transfer, but near threshold only a few partial waves can contribute. Here the study of the short-range features of the NN interaction is greatly facilitated because it is possible to experimentally separate the contributions from different angular momentum states. In recent studies it was found that within 10-20 MeV of threshold, i.e. below 300 MeV, only Ss for , [1, 2, 3] or at most two partial waves (Ss and Sp) for and [4, 5, 6, 7, 8, 9, 10] were important, and direct comparisons with simple theoretical approaches can be made. The expected dominance of Ss contributions (, ) for the final states was seen, but at the same time it was found that for traditional models under-predicted the cross sections by factors of 3-5.
At higher energies the reaction tends to be dominated by the delta resonance. [11, 12, 13]. The present study in the near threshold region will provide information on polarization observables in a region still subject to relatively parameter-free microscopic calculations. Its major motivation is the hope and expectation to reduce the theoretical uncertainties for a process fundamental in nuclear physics. Additional references to prior experimental and theoretical work can be found in [10, 8].
Much effort has gone into attempts to explain , probably the theoretically most difficult of the three branches. Modern chiral perturbation work on this reaction has been discussed recently in [14, 15], but this approach has not yet explained the data. It has become apparent that for the first order terms dominate and delta and complicating heavy meson exchange contribution are relatively small making this reaction theoretically important. At this time there is no refereed publication on chiral perturbation calculation; however, very recently a preprint has become available that reports calculations for and . These calculations under-predict near threshold data by factors of 2 to 3, but with less room to adjust poorly known parameters than for [16]. The varying theoretical approaches proposed for the inclusion of off-shell contributions, “heavy meson” exchange, and contributions involving the isobar are still under discussion [17]. Divergent results suggest that conclusions about the adequacy of a theoretical pion production model cannot be based on agreement for just a single pion production branch. A satisfactory model must succeed in
explaining all branches.
Promising attempts to simultaneously describe data from more than one reaction have been made using the Hamiltonian approach . A relativistic phenomenological model was offered by Shyam and Mosel [18]. Their approach naturally included higher angular momenta and the exchange of heavier mesons and was able to fit and cross sections over a wide energy range. This model should also predict analyzing powers; however, such predictions have not been published to date. More complete microscopic calculations in the meson exchange picture, involving angular momentum states as large as are now being published by the Jülich group [19, 20, 21]. Their approach of [20, 21] is largely free of adjustable parameters. It gives a very good reproduction of the published and data. However, it has only qualitative success in reproducing the new spin correlations observables [22] for . The spin correlation data reported here for present a different test of the predictive power of this approach.
Precision measurements of pion production near threshold became possible with the advent of cooled beams and the technology developed at IUCF and other facilities around the world to use a stored cooled beam on a windowless internal target. In the present experiment we used a polarized beam on a polarized internal target to measure the reaction at 325, 350, 375 and 400 MeV. Bombarding energies for the present experiment were chosen to cover the range over which some higher partial waves gradually become significant. This is the first investigation of spin correlation coefficients in this reaction near threshold. We have measured , , , integrated over all kinematic variables and the observed range of the of the polar angles. We also determined the differential analyzing powers .
II Experiment
The present experiment was conducted at the Cooler ring of the Indiana University Cyclotron Facility (IUCF). A beam of polarized protons was accelerated to 197 MeV and stack-injected into the ring. There it was accumulated for 2-3 minutes, yielding orbiting beam currents of 100-300 A. The stored beam was then accelerated in the ring to full energy. After about 5-10 minutes of data taking the remaining beam was discarded and the cycle was repeated with reversed beam spin. The beam polarization was vertical, alternately up or down.
The target consisted of polarized atomic hydrogen in a storage cell, where it was maintained by an atomic beam [23]. The open-ended cell, a movable cylinder of 12 mm diameter with a 25 m thick aluminum wall, minimized the background induced by the beam halo in the cell wall. Depolarization due to wall collisions was minimized by coating the cell with Teflon. The target gas density distribution along the storage cell was of triangular shape with a spread of 12.5 cm about the center. The thickness of the target was . The target polarization was flipped every 2 sec, pointing in sequence up, down, left, right. Each change of direction took less than 10 ms.
Elastic proton-proton scattering events were observed concurrently with pion production in order to determine the luminosity and beam and target polarization. Four plastic scintillators at azimuthal angles of and detected coincident protons elastically scattered near . The product PQ of the beam (P) and target (Q) polarization was determined from the spin correlation , which is large and well known for pp scattering. Typically, we saw , but for the 350 MeV run PQ dropped to 0.34. The time-integrated luminosity was deduced from the known pp elastic cross section.

The detector stack is shown in Fig. 1. The trajectories of the reaction pions and protons were determined by wire chambers WC1 and WC2, spaced 23 cm apart, each consisting of two wire planes. The angular accuracy of the deduced trajectories was limited by multiple scattering of the ejectiles and by the resolution of the wire chambers. The major contribution to the multiple scattering came from the 1.5 mm thick plastic scintillator detector (F) which served as timing detector. We estimate the angular uncertainty for the trajectories for protons and pions of about and , respectively. The energy of the charged particles was measured by a stack of segmented plastic scintillators of total thickness of 25.4 cm. The energy resolution of the stack was about . Events are vetoed if a charged particle reaches the detector V behind the K-detector.
Various types of events were analyzed for the present experiment. The candidates had to have simultaneous counts in one or more F segments and two or more E segments. They were rejected if there was a count in the veto detector V. The veto detector effectively eliminated (or else selected) very energetic (elastic) projectiles. For the 400 MeV run it also rejected the most energetic reaction protons and pions, complicating the interpretation of this run. In addition to the pion trigger there were a “monitor trigger,” to study pp elastic scattering, and a “single prong” trigger for diagnostic purposes.
More details of the experimental set-up are given in [24].
III Analysis
Coincident protons and pions were identified by their deposited energy and their time of flight between the E and F detectors. Software cuts were used to further eliminate background. We employed a particle identification cut, a cut based on the trajectory origin, and a missing-mass cut. Fig. 2 shows the distribution of the missing mass reconstructed from the measured momenta of the proton and pion.

The events of interest are those near the neutron mass. The software cuts and the coincidence requirements greatly reduce background, but some of it remains under the neutron mass peak. This amounts to 3 to 8% of the peak area and primarily comes from pions produced in the walls of the target cell. To assess the background shape we took data with pure gas in the target cell. We deduced the background under the missing mass peak by using a background shape derived from the missing mass spectrum. This empirical shape was normalized to the visible background continuum outside the neutron peak. To estimate the error from background corrections we varied the background subtraction by 25% . The effect on the final results was found to be smaller than the statistical errors. At 325 MeV the resolution of the neutron missing mass peak was .
A Monte Carlo simulation of the experiment was used to determine various limiting effects of the apparatus and to derive corresponding corrections. The code contained the detailed geometry of the detector systems and the target density distribution. It included the effects of multiple scattering of the charged particles, pion decay, loss of energy by the charged particles, and the energy resolutions of the scintillators. The simulation provided a guideline for the expected angular and energy distributions of pions and protons. This was important at 400 MeV, because about 0.2% of the coincident protons and 14.4% of the pions, intercepted by the detectors, did not stop in the scintillators. In the final analysis we used only those events where the proton and the pion energies were measured accurately enough to produce a missing mass value within of the neutron mass. The simulation was also needed to study the acceptance of the detector system, which did not cover the entire phase space of the exit channel. Very forward events were suppressed by the central hole in the detector which was needed to accommodate the beam pipe for the circulating beam. Many large-angle events are lost because of the finite detector size. Coincident events are detected only if the polar angle of the proton is larger than and if the pion angle is . The event acceptance for coincidences was 21.5% at 325 MeV, 19.4% at 350 MeV, 18.2% at 375 MeV, and 15.0% at 400 MeV. The resulting loss in count rate is significant; however, since target and projectile are identical particles we sample a phase space twice as large as the acceptance suggests.
In the c.m. system low energy pions are seen for all angles, but energetic pions are not sampled for polar angles near . Near threshold the analyzing power for pions in the final state varies about linearly with pion momentum, independent of bombarding energy [9]. Therefore data for c.m. angles between not only have low statistics, but they also require (model dependent) corrections, which results in large error bars. The integrated spin dependent cross section ratios S, D, and reported here lack data near , and therefore only approximately represent the full integral over . Nevertheless, accurate comparisons with theory are possible. They require a corresponding integration range for the theoretical calculation, i.e., the restriction of pion lab angles to the range to .
IV Results and Discussion
Fig. 2 compares four missing mass spectra with the same integrated luminosity for the four spin-spin orientations with vertical beam and target polarization. The spin-dependent cross section (defined as the observed cross sections with the spins of the colliding protons opposite minus the observed cross section with spins parallel) can be calculated by using the cross ratio method[25]:
| (1) |
where . denotes the yields for the four spin combinations and is the unpolarized cross section for the measured range of the polar angle . Because of the limited range of the detector the integrated cross section ratio will differ from the standard ratio if the spin correlation coefficients have a strong dependence. The recent Hamiltonian calculation by Hanhart et al. [21] suggests relatively small changes for our geometry (see Fig. 4).
For the present experiment spin-dependent differential cross section as a function of the pion azimuthal angle can be expressed as[25]
| (2) | |||
| (3) | |||
| (4) |
where and are respectively the beam and target analyzing powers, and are very small. The values are the spin correlation coefficients and are the beam (target) polarization components. In this equation the observables , and are integrals over all kinematic variables of the proton, the neutron and the pion except over the pion azimuthal angle . Spin correlation observables are deduced by sorting the data as a function for a specific combination of beam and target spin. We show the -dependence of the measured ratios in Fig. 3.
Except for the scales, the presentation is identical to that in ref.[22] for . The columns represent the four bombarding energies, and the rows the different combinations for the spin-dependent yields. The definitions of the are given in Fig. 3. To obtain the plotted quantities, we calculate and divide by for the first three rows and by PQ for the last two two rows.

The first three rows are directly related to the beam and target analyzing powers, whereas the last two rows reflect the spin correlation coefficient combinations , and . In this figure and are related to the beam and target analyzing powers and by , and . The solid lines in Fig. 3 represent a least-square fit using the dependence from Eq.(2) (listed to the right of Fig. 3), and varying the four parameters , , S, and D.
The integrated spin correlation coefficient S is related to the
spin-dependent cross section by ,
and we find that these two analysis methods agree.
The integrated analyzing power is
given by . The resulting polarization
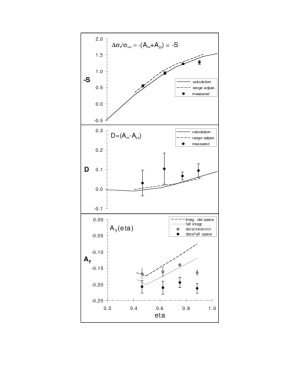
observables are shown in Fig. 4 and listed in Table 1. These values,
but not those in Fig. 3, are corrected for background contributions.
The values for the integrated
spin correlation coefficients in Fig. 4 are in remarkably
good agreement with recent
Hamiltonian predictions following ref. [21].
In our experiment beam and target analyzing powers are related by and, therefore, permit a study of the back angles for with the present apparatus. Fig. 5 shows the observed dependence of the analyzing powers . As mentioned above, the limited size of the detector reduced the usefulness of data near . However, a large enough range in could be covered to demonstrate the change in the angular distributions with energy and the need for partial waves higher than Ss and Sp. The dashed curves show calculations taken from [21].

The solid curves in Fig. 5 represent fits with the relation
| (5) |
where the expressions are associated Legendre polynomials and . was not needed or used for the fits shown; however, , i.e. the inclusion of an term, was essential to obtain a reasonable representation of the data at the four energies.
We have found that the recent calculations of the Jülich group are quite successful in predicting the integrated spin correlations for in spite of their difficulties with . This dramatic difference in the otherwise similar reactions should help identify the reason for the less than satisfactory agreement of calculations and measurements [22] for . A further indication of remaining shortcomings is found in the difference between calculated and measured angular distributions for in Fig. 5. It appears that some diagrams that are secondary in but important in have been omitted or treated inadequately.
We are currently analyzing additional measurements of the
reaction with
longitudinal beam and target polarization. Such results
together with the present data may allow a deduction of
the dominant partial waves in a model independent way.
Acknowledgements.
We acknowledge the support of Drs. M. Dzemidzic, F. Sperisen and D. Tedeschi in the early stages of the experiment. We thank Dr. W. Haeberli for his advice and continuing interest and J. Doskow for technical support. We also wish to thank the IUCF accelerator operations group for their dedicated efforts. We are grateful to the authors of ref. [21] for making available to us calculations for obtained with their model. This work was supported by the US National Science Foundation under Grants PHY95-14566, PHY96-02872, PHY-97-22556, and by the department of Energy under Grant DOE-FG02-88ER40438.REFERENCES
- [1] H.O. Meyer et al., Phys. Rev. Lett. 65 (1990) 2846.
- [2] H.O. Meyer et al., Nucl. Phys. A539 (1992) 633.
- [3] A. Bondar et al., Phys. Lett. B356 (1995) 8.
- [4] E. Korkmaz, Jin Li, D.A. Hutcheon, R. Abegg, J.B. Elliott, L.G. Greeniaus, D.J. Mack, C.A. Miller, N.L. Rodning, Nucl. Phys. A535 (1991) 637.
- [5] P. Heimberg et al., Phys. Rev. Lett. 77 (1996) 1012.
- [6] M. Drochner et al., Phys. Rev. Lett. 77 (1996) 454.
- [7] W.W. Daehnick et al., Phys. Rev. Lett. 74 (1995) 2913.
- [8] J.G. Hardie et al., Phys. Rev. C56 (1997) 20.
- [9] W.W. Daehnick et al., Phys. Lett. B423 (1998) 213.
- [10] R.W. Flammang et al., Phys. Rev. C58 (1998) 916.
- [11] C.E. Waltham et al., Nucl. Phys. A433 (1985) 649.
- [12] R.L. Shypit et al., Phys. Rev. C40 (1989) 2203.
- [13] A.B. Wicklund et al., Phys. Rev. D35 (1987) 2670.
- [14] T. Cohen, J. Friar, G. Miller, and U. van Kolck, Phys. Rev. C 53 (1996) 2661. B.Y. Park et al., Rev. C 53 (1996) 1519.
- [15] T. Sato, T.-S. H. Lee , F. Myhrer, K. Kubodera, Phys. Rev. C 56 (1997) 1246.
- [16] C.A. da Rocha, G.A. Miller and U. van Kolck, preprint nucl-th/9904031 (4/12/99).
- [17] C. Hanhart, J. Haidenbauer, M. Hoffmann, U.-G. Meissner, J. Speth, Phys. Lett. B424 (1998) 8.
- [18] R. Shyam and U. Mosel., Phys. Lett. B 426 (1998) 1.
- [19] J. Haidenbauer, C. Hanhart, J. Speth, Acta Phys. Pol. 27 (1996) 2893.
- [20] C. Hanhart Ph.D. thesis, University of Bonn 1997.
- [21] C. Hanhart, J. Haidenbauer, O. Krehl, J. Speth, Phys. Lett. B444 (1998) 25.
- [22] H.O. Meyer et al., Phys. Rev. Lett. 81 (1998) 3096.
- [23] T. Wise, A.D. Roberts, and W. Haeberli, Nucl. Inst. Meth. A 336 (1993) 410.
- [24] T. Rinckel et al., (submitted to NIM) (1999).
- [25] H.O. Meyer, Phys. Rev. C56 (1997) 2074.
| T | ||||||
|---|---|---|---|---|---|---|
| (MeV) | (detector space) | (full space, Fig.5) | ||||
| 325.6 | 0.464 | 0.4560.003 | 0.5530.038 | 0.0310.066 | 0.1670.016 | -0.207 0.019 |
| 350.5 | 0.623 | 0.3420.004 | 0.9420.046 | 0.1040.080 | 0.1610.016 | -0.210 0.020 |
| 375.0 | 0.753 | 0.5140.004 | 1.2260.011 | 0.0670.021 | 0.1400.005 | -0.194 0.016 |
| 400.0 | 0.871 | 0.5260.006 | 1.2740.019 | 0.0950.035 | 0.1640.009 | -0.2120.015 |