Recent results from E877 for AuAu collisions at AGS energy
The E877 experiment was dedicated to the study of hadron distributions in Au+Au collisions at the AGS. Here, we will mainly present results from the analysis of the data obtained from the last data taking run, which took place in the fall of 1995 and recorded 46 millions Au+Au events at 11.5 AGeV/c. The improved experimental apparatus and large statistics allowed to extend our previous measurements of particle flow [1, 2, 3, 4] to and . We will also report our latest results on two-particle correlations of like and unlike particles, as well as the measurements of double differential multiplicities of -hyperons.
1 UPGRADE OF EXPERIMENTAL SETUP
The E877 experimental setup is discussed in detail in [1, 2, 3, 4, 5]. For the 1995 run, two micro-strip silicon beam vertex detectors (BVER’s) were upgraded from single-sided silicon wafers with one-dimensional pitch of 50 m to double-sided wafers with a 200 m pitch in both the and directions. Using these detectors the coordinates of beam particles at the target were determined with an accuracy of 300 m in position and 60 rad in angle.
We also upgraded the spectrometer with tracking chambers upstream of the magnet. Two identical multi-wire proportional chambers with highly segmented chevron shaped cathode pad readout were instrumented and placed at 2 m and 2.25 m downstream of the target, just in front of the spectrometer magnet. They provided a precise measurement (about m resolution) of the bending plane coordinate of the track before deflection in the magnetic field. This additional tracking information allowed to improve the signal-to-background ratio for identification of rare particles, such as and and to reconstruct the vertices of hyperon decays.
2 FLOW OF IDENTIFIED PARTICLES
Anisotropies in the azimuthal distribution of particles, also called anisotropic (directed, elliptic, etc.) transverse flow, have proven to be a very useful tool for extracting information about the hot and dense stage of a heavy-ion collision.
In our flow analysis, we reconstructed the reaction plane from the measurement of the transverse energy distribution [3]. A Fourier expansion method was used to describe the azimuthal anisotropy in the particle emission [6]. The amplitudes of the first and second harmonics of the expansion, and , quantify the strength of directed and elliptic flow, respectively.
Recent theoretical developments have shown that elliptic flow of nucleons is sensitive to the nuclear equation-of-state [7]. In Fig. 1 we show the measured dependence of on transverse momentum for protons in different rapidity bins for events with centrality . Larger positive values of are observed for the more forward rapidities.

The interpretation of this effect, however, requires considering the influence of a strong directed flow observed in the region near beam rapidity. The directed flow was shown to be well described by a thermal distribution with respect to an origin displaced along the reaction plane axis [3]. The effect of such a displacement on the -dependence is shown in Fig. 1 by the dashed lines. To estimate the “true” ellipticity of the event, we fitted the measured -dependence with the following parameterization:
| (1) |
where is the ellipticity parameter. Values of larger and less than unity correspond to in-plane and out-of-plane elliptic flow, respectively. The ellipticity parameter is related to the second Fourier coefficient , weighted by :
| (2) |
Fits of parameterization (1) to the measured -dependence are shown in Fig. 1 as solid lines. The extracted values of for different centrality and rapidity bins were used to calculate , which is plotted in Fig. 3 as a function of rapidity.


The sign of elliptic flow depends on rapidity, with positive (in-plane) elliptic flow measured in the midrapidity region, and negative (out-of-plane) elliptic flow observed at beam rapidities. This dependence, similar to the transition from out-of-plane to in-plane elliptic flow measured as a function of beam energy at central rapidities [8], could be a consequence of the competition between the out-of-plane flow due to shadowing of nucleons by the cold spectator matter and pressure-induced in-plane elliptic flow caused by the initial almond-shaped geometry of the collision region. A similar effect is also seen in the RQMD calculations (Fig. 3), with the mean-field version of RQMD reproducing the data well.
We also studied elliptic flow of pions. Directed flow of pions is very small [3] and does not influence the measurements of elliptic flow. Pions exhibit a very weak -dependence of [9], with small positive values observed for semi-central collisions. The rapidity dependence of for negative pions is presented in Fig. 3. Weak in-plane elliptic flow is detected at all rapidities covered. In contrast to protons, the cascade mode of RQMD seems to be in a better agreement with the pion data.
Azimuthal anisotropies in kaon production are predicted to be sensitive probes of the kaon potential in a dense nuclear medium [10]. In Fig. 4 we

present the amplitude of directed flow, , as a function of for positive and negative kaons. The kaon flow signal is weak and negative, i.e. kaons flow in the direction opposite to that of protons and -hyperons [9].
Measurements of directed flow of antiprotons are important for understanding the mechanism of the anti-quark production and the role of annihilation in the dense environment. Strong anti-flow of antiprotons has been predicted [11] due to absorption of a large fraction of the produced antiprotons. In Fig. 5

we compare the experimental measurements of directed flow with the cascade RQMD calculations. A negative signal is observed in semi-central collisions, comparable in magnitude to that predicted by the model.
3 TWO-PARTICLE CORRELATIONS
Two-particle correlations provide information about the space-time extent of the system at freeze-out. The correlations of identical mesons are governed by the Bose-Einstein statistics and by mutual Coulomb interaction. The two-proton correlations are a product of Fermi statistics and the attractive strong and repulsive Coulomb final state interactions. Unlike-pion and pion-proton correlations are also used as probes of the reaction zone.
We determined three-dimensional correlation functions of identical pions to extract the source dimensions in different directions. The correlation function , defined as the ratio of the two-particle density and the product of the single particle densities, has been corrected for the repulsive Coulomb force by integrating the Coulomb wave function over a source of finite size and fitted according to the following parameterizations:
| (3) |
| (4) |

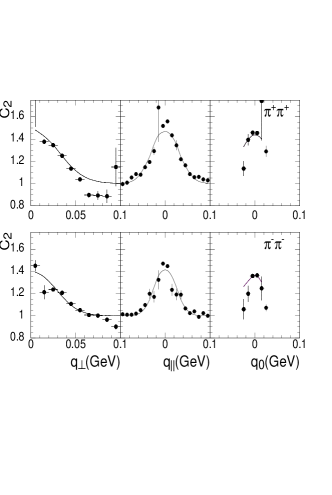
where and are the components of the invariant length of the pair’s momentum difference. In Fig. 6 we show the projections of the three-dimensional and ’s for the most central events. The results of the fits are summarized in Table 1.
| (fm) | (fm) | ||||
|---|---|---|---|---|---|
| (fm) | (fm) | ||||
| (fm) | (fm) | ||||
| (fm | |||||
The averaged pair rapidities (transverse momenta) were 3.18 (0.14 GeV/c) and 3.34 (0.11 GeV/c) for and , respectively.
The extracted radii of the pion source demonstrate that the system significantly expanded before freeze-out from its initial size ( fm). The radius parameters are about larger than those of . This effect is consistent with the influence of a central Coulomb potential of a third body with [13].
The cross-term parameter in parameterization (3) is different from zero indicating that the pion source is not completely boost invariant. The other two cross-terms and were found to be consistent with zero which is expected for an azimuthally symmetric collision region. The values of confirm that the fastest pions source is about one unit forward of mid-rapidity.
A possible anisotropy in coordinate space was also studied by measuring one-dimensional and correlation functions relative to the reaction plane. For events with centrality we divided the pion data set into four subsets depending on the direction of the pair’s transverse momentum with respect to the reaction plane angle : “same” with ; “opposite” with ; “in-plane” with ; “out-of-plane” with . The ratios of correlation functions for pion pairs in “same”/”opposite” and “in-plane”/”out-of-plane” windows were found to be consistent with unity, indicating no or very weak anisotropy in the coordinate space. The upper limits for the azimuthal asymmetry are and for the and sources, respectively [12].
For the analysis of the correlation function, due to limited statistics we used a two-dimensional parameterization: . The average rapidity (transverse momentum) of the pair was 2.34 (0.16 GeV/c). The extracted parameters of the kaon source are fm, fm, and . The smaller source size inferred from the correlations may be interpreted as a consequence of the large and collective expansion of the system.
We also performed a study of two-proton correlations in Si+Pb and Au+Au collisions which suggested a larger space-time extent for the heavier system. For Au+Au reactions, the centrality dependence of the two-proton correlation function implies that more central collisions lead to larger source sizes [14].
Measurements of the pion-proton correlation function exhibit an asymmetric peak, which could be a sign of spatial or temporal separation between the sources of protons and pions. Calculations assuming that the proton source is located 10 fm more forward than the sources of pions, while the and sources are separated by 15 fm in the direction of the reaction plane have yielded asymmetries in the calculated and correlation functions which are comparable to the ones observed in the experimental data [15]. The magnitude of the assumed displacement seems large, though, compared to the size of the system and the expected duration of the emission.
4 SPECTRA AND YIELDS
We identified -hyperons by invariant mass reconstruction of pairs (see [9, 16]). The spectra in the top Au+Au collisions are shown in Fig. 7

as a function of transverse mass and rapidity. The spectra are well described by an exponential with inverse slopes decreasing with increasing rapidity. The data are compared with the predictions of the RQMD v2.3 model, run in cascade and mean-field modes. In the rapidity range covered, either version of the model describes the data quite well. The rapidity distribution for obtained by integrating the transverse mass spectra is shown in Fig. 8. Our experimental data

are compared with the measurements of the E891 collaboration [17] and with the RQMD predictions. Both experimental results agree within systematic uncertainties.
References
- [1] J. Barrette et al., E877 Collaboration, Phys. Rev. Lett. 73 (1994) 2532
- [2] J. Barrette et al., E877 Collaboration, Phys. Rev. C55 (1997) 1420.
- [3] J. Barrette et al., E877 Collaboration, Phys. Rev. C56 (1997) 3254.
- [4] J. Barrette et al., E877 Collaboration, Phys. Rev. C59 (1999) 884.
- [5] J. Barrette et al., E877 Collaboration, Nucl. Phys. A638 (1998) 69.
- [6] S. Voloshin and Y. Zhang, Z. Phys. C70 (1996) 665.
- [7] P. Danielewicz et al., Phys. Rev. Lett. 81 (1998) 2438.
- [8] C. Pinkenburg et al., E895 Collaboration, nucl-ex/9903010, subm. to Phys. Rev. Lett.
- [9] J. Barrette et al., E877 Collaboration, these proceedings.
- [10] G.Q. Li, C.M. Ko and B. Li, Phys. Rev. Lett. 74 (1995) 235.
- [11] A. Jahns et al., Phys. Rev. Lett. 72 (1994) 3464.
- [12] T. Vongpaseuth, PhD Thesis, SUNY at Stony Brook, (1999).
- [13] G. Baym and P. Braun-Munzinger, Nucl. Phys. A610 (1996) 286c.
- [14] J. Barrette et al., E814/877 Collaboration, nucl-ex/9905003, subm. to Phys. Rev. C.
- [15] D. Miśkowiec, nucl-ex/9808003, procs. of CRIS 98, Acicastello, Italy, 8-12 June 1998.
- [16] Y.J. Qi, PhD Thesis, McGill University, (1999).
- [17] S. Ahmad et al., E891 Collaboration, Phys. Lett. B382 (1996) 35.