Another look at anomalous suppression
in collisions at
Published online: 3 February 2000 – © Springer-Verlag 2000)
Abstract
A new data presentation is proposed in order to consider anomalous suppression in collisions at GeV/. If the inclusive differential cross section with respect to a centrality variable is available, one can plot the yield of events per Pb–Pb collision as a function of an estimated squared impact parameter. Both quantities are raw experimental data and have a clear physical meaning. As compared to the usual over Drell–Yan ratio, there is a huge gain in statistical accuracy. This presentation could be applied advantageously to many processes in the field of nucleus–nucleus collisions at various energies.
1 Introduction
Very interesting results have been obtained recently by the NA50 experiment at CERN concerning production in collisions at GeV/ ABR97 ; ABR97a ; RAM98 ; ROM98 ; ABR99 . In most central collisions, the events are significantly suppressed with respect to what is expected from normal nuclear absorption as measured in lighter systems ABR97a ; RAM98 ; ROM98 ; ABR99 . According to theoretical predictions made more than ten years ago by Matsui and Satz MAT86 , this anomalous suppression could be a sign of the awaited formation of a quark–gluon plasma in nucleus–nucleus collisions at very high energy.
The deficiencies of customary data presentations, using the ratio between and Drell–Yan events or the differential cross section for production with respect to some measured centrality variable, will be stressed first. A new data presentation GOS99 will then be proposed, which removes the previous deficiencies with the help of one key additional ingredient, the inclusive differential cross section with respect to the centrality variable. For any process “p”, the yield of “p” events per nucleus–nucleus collision is plotted as a function of an estimated squared impact parameter. This new presentation will be applied to NA50 results from their 1995 data taking, available in a thesis BEL97 . Implications of this new presentation will also be discussed. Finally, conclusions will be drawn in the perspective of RHIC and LHC experiments on nucleus–nucleus collisions at very high energy.
2 Usual data presentation
In the usual presentation of NA50 results concerning production in nucleus–nucleus collisions ABR97 ; ABR97a ; RAM98 ; ROM98 , the ratio between and Drell–Yan events is plotted as a function of the transverse energy measured in an electromagnetic calorimeter. This centrality variable is aimed primarily at sorting out all events according to the impact parameter of the collision. The Drell–Yan process, supposed to be insensitive to nuclear matter effects, is indeed a good reference for normalizing events from the physics point of view. Moreover, some systematic effects cancel in such a ratio. However, when one sees an interesting feature in a ratio, it is not always obvious to know whether it is due to the numerator or the denominator. More importantly, since the Drell–Yan continuum is much less populated than the peak in the dimuon mass spectrum, the statistical uncertainty on the ratio comes essentially from the denominator. It is between 5 and 10 times larger – 5 for central collisions, 10 for peripheral ones – than the contribution from the number of events in the peak. In other words, one would need between 25 and 100 times less running time, all other conditions staying equal, to get a given relative statistical uncertainty on production from the number of events in the peak than from the ratio between and Drell–Yan events. This is a first deficiency of the usual presentation. One would like to use another quantity for normalizing events without losing so much in statistical accuracy.
The ratio between and Drell–Yan events is obtained from the differential distributions of cross section for both classes of events, which are the basic experimental data one has to start with. These raw experimental data, and , where “p” stands for either or Drell–Yan process, do not have a very direct physical meaning. From the increase or the decrease of as a function of , one cannot even infer whether the production of “p” events increases or decreases with the centrality of the collision. In particular, the decrease of at high for any “p” process simply reflects the fact that, for most central collisions, there is a maximum value of beyond which there is no more cross section. is surely increasing with centrality, but at which rate? The answer to this question is needed if one wants to go from to a more direct centrality variable like the impact parameter. For all these reasons, and are rather difficult to understand and compare directly with simple models. This is the second deficiency of the usual presentation. One would like to find other experimental quantities, not too far from and , which would have a more direct physical meaning, from which one could directly say something on the variation of the production of “p” events with centrality, and which could be compared directly with simple models.
3 New data presentation
One key quantity that could be used to remove the above-mentioned deficiencies is the inclusive distribution of the cross section for the centrality variable, denoted as hereafter for more generality. This inclusive distribution will be needed in its differential form for normalizing , and in its integral form for getting an estimated squared impact parameter .
When we use we mix the probability to get a given centrality with the probability to get the “p” process at this centrality. This is precisely why the increase or the decrease of as a function of centrality has no straightforward meaning. This distribution is in fact the product of two quantities which themselves have a more direct physical meaning than their product. It can be written as , where the inclusive distribution carries the probability that a nucleus–nucleus collision occurs at a given value of the centrality variable, and is the yield of “p” events per nucleus–nucleus collision at this given centrality. This yield , which, being equal to (), is a well-defined physical quantity. For copiously produced particles it is simply their average multiplicity per nucleus–nucleus collision at a given centrality. As it is a ratio, it should be insensitive to some systematic uncertainties. Its variation as a function of should accurately reflect whether the production of “p” events increases or decreases with the centrality of the collision. It should not be subject to any artificial decrease for most central collisions. For both and Drell–Yan processes, one expects that this yield steadily increases towards more central collisions, like the number of nucleon–nucleon collisions they originate from, unless the is very strongly suppressed. The first step in the new data presentation is thus to use the yield of “p” events per nucleus–nucleus collision instead of .
The idea behind tagging a process with a centrality variable in nucleus–nucleus collisions is always to sort out events according to the impact parameter. If a centrality variable is assumed to vary monotonically as a function of the impact parameter – and centrality variables are purposely chosen for that reason –, it is very easy to go from to an estimate of , or more precisely . One only has to use the integral inclusive cross section , from most central collisions to any given value of . From the geometrical dependence of the inclusive cross section, , one simply gets where is an estimate of the squared impact parameter corresponding to the value of . There is a one-to-one correspondence between and . slices are transformed into slices with a width proportional to the number of counts in the slices. For this reason, which is also related to the fact that goes to zero at zero impact parameter, seems a better variable than the estimated impact parameter . Instead of dividing by , one could divide it by the geometrical cross section and get a quantity proportional to , but with such a normalization that it varies between 0 and 1 from most central to most peripheral collisions. Another quantity which could be interesting to use for plotting results from different systems would be , where . It has the advantage of being correlated, and not anticorrelated, with the centrality, and extends to larger and larger values for larger and larger systems, with the zero value corresponding always to most peripheral collisions. Such a transformation from to has been used in more or less details by several experiments in the field of nucleus–nucleus collisions at various incident energies. Its reliability has been discussed thoroughly, and has been checked to be excellent within the framework of the intranuclear cascade model at energies per nucleon around 1 GeV CAV90 . Model calculations are obviously needed to evaluate the method and to compare the quality factors of various centrality variables CUG83 , which combine the fluctuations of at any given and the variation rate of with respect to or . For some AGS or SPS experiments, even though the data are plotted as a function of a centrality variable, a scale for the impact parameter estimated along the preceding lines is indicated in parallel AGG98 ; BAR99 . Finally, the second step in the new data presentation consists in replacing the measured centrality variable with an estimate of the squared impact parameter, .
After applying both steps one gets the yield of “p” events per nucleus–nucleus collision as a function of the estimated squared impact parameter. Both quantities are raw experimental data and have a clear physical meaning. As compared with the usual ratio between and Drell–Yan events, there is a huge gain in statistical accuracy for .
With this new data presentation one can consider any process independently of all others, with the best statistics available for each of them. In the same way as the integral of as a function of is the total cross section for the “p” process, the integral of as a function of is equal to the total cross section for the “p” process divided by . There is no loss of information in going from the centrality variable to the estimated squared impact parameter . The limits of the slices used for looking at the variation with centrality have simply to be specified for both and . The main requirement for this new presentation is a good inclusive centrality distribution, with high enough statistical accuracy and proper corrections for efficiency and empty-target contribution. The yield being the ratio of cross sections, part of systematic uncertainties are removed if inclusive measurements are taken simultaneously with the measurements of the “p” process. The normalization uncertainty of the inclusive cross section has an effect on the abscissa rather than on the ordinate, which may be unusual but does not bring about any practical problem.
Such a presentation provides an excellent starting point for comparisons between experiment and theory, and also between experimental results themselves. Since there is no explicit appearance of in the new presentation, results obtained with various centrality variables should be identical as long as these variables sample the impact parameter the same way. Anyway, such a comparison could help to check systematic uncertainties. For comparisons between experiment and theory, it is straightforward to compare the measured yields as a function of the estimated with the calculated ones as a function of the real . This is particularly interesting for a quick comparison with simple models. However, in order to take into account the fluctuations of any centrality variable as a function of the impact parameter, a comparison with better quality would result from using the same procedure of estimation for both experiment and theory, even if inclusive cross sections do not agree within a high degree of accuracy CAV90 , or from unfolding the experimental results from these fluctuations. It is also clear that this whole presentation could be applied advantageously to other processes than and Drell–Yan production.
4 Application
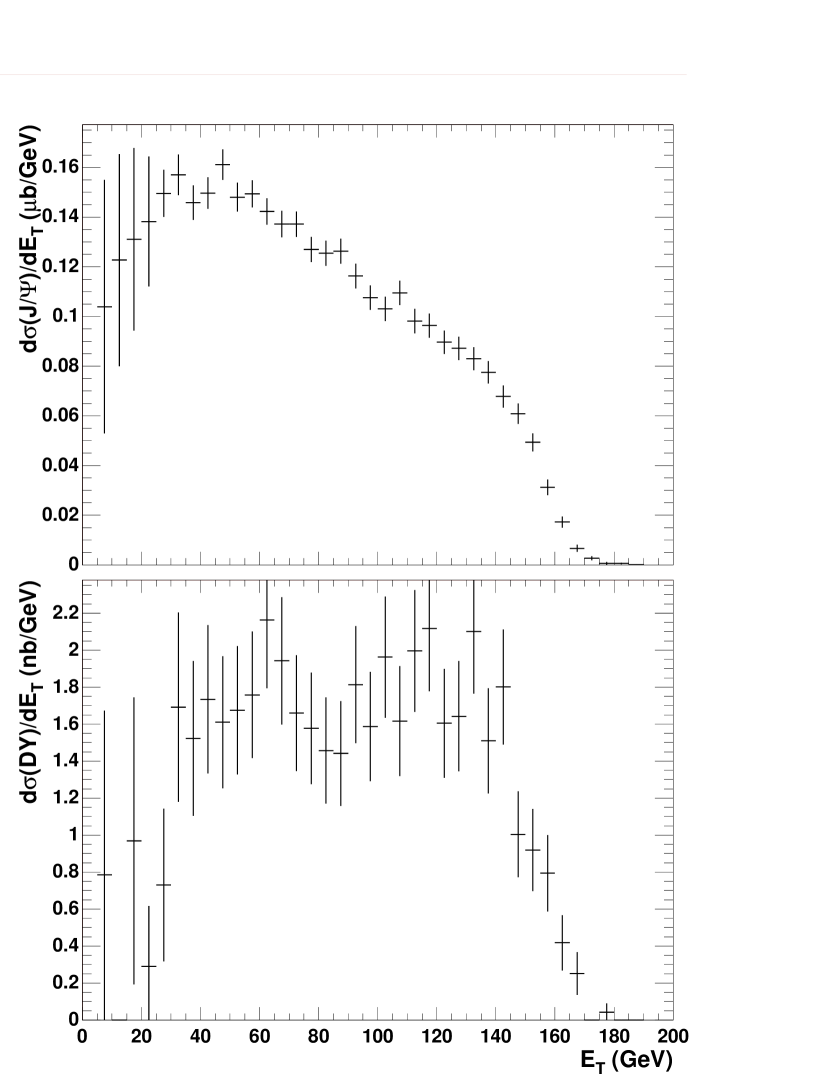
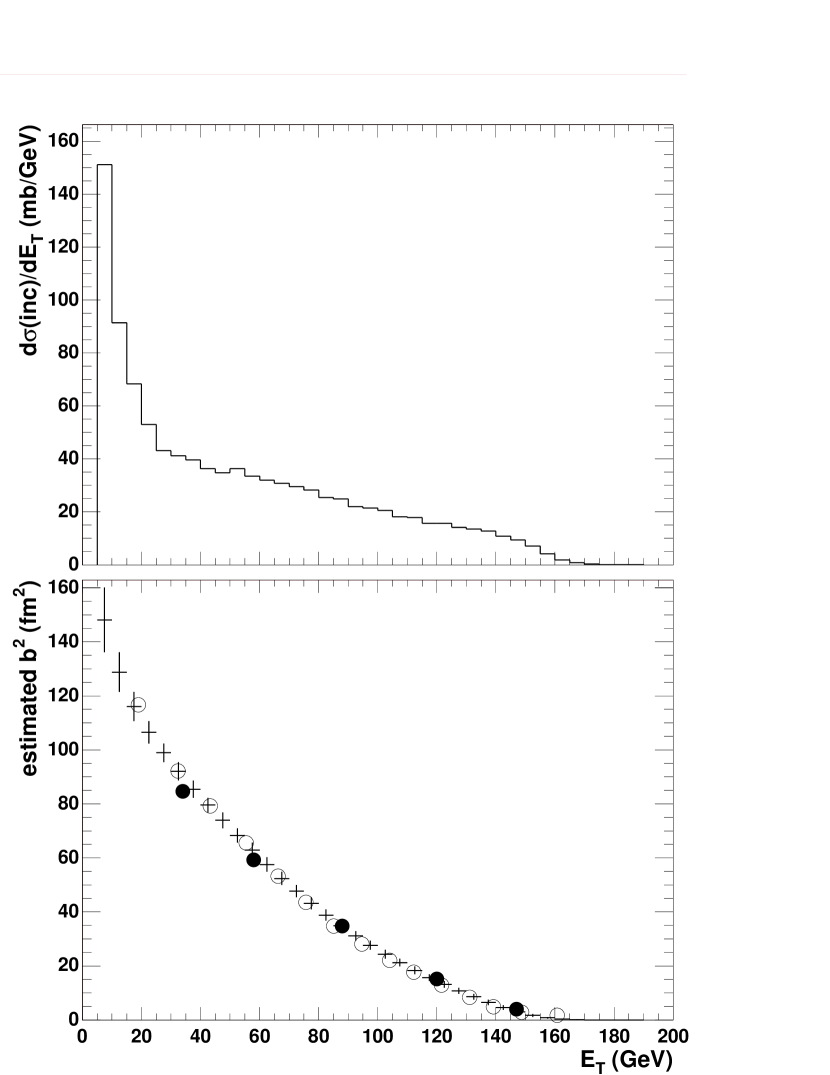
In a thesis by Bellaiche BEL97 from the NA50 collaboration, all necessary pieces of information are available from the 1995 data taking for applying this new data presentation. They have not been published as such. The results presented below thus have to be considered with care. They are only indicative, and they are to be used simply as an illustration of the advantages inherent to the new data presentation. Basic experimental data are the differential distributions of the cross section for the and Drell–Yan events (Fig. 1). The key additional ingredient is the differential distribution of the inclusive cross section, by the integration of which one can estimate the squared impact parameter for each value of (Fig. 2). Uncertainties on have been neglected in the following. The inclusive cross section is only available with arbitrary units in the thesis. A normalization factor had to be introduced to get the values in units of fm2. It has been adjusted in such a way that the dependence of upon agrees with the correlation between the average values of and listed in NA50 publications ABR97 ; ABR99 for successive slices, as fitted on the basis of a Glauber model calculation. These average values are also shown in the bottom part of Fig. 2. values from ABR99 have been divided by 0.74 to take into account the different scales used in the NA50 publications.
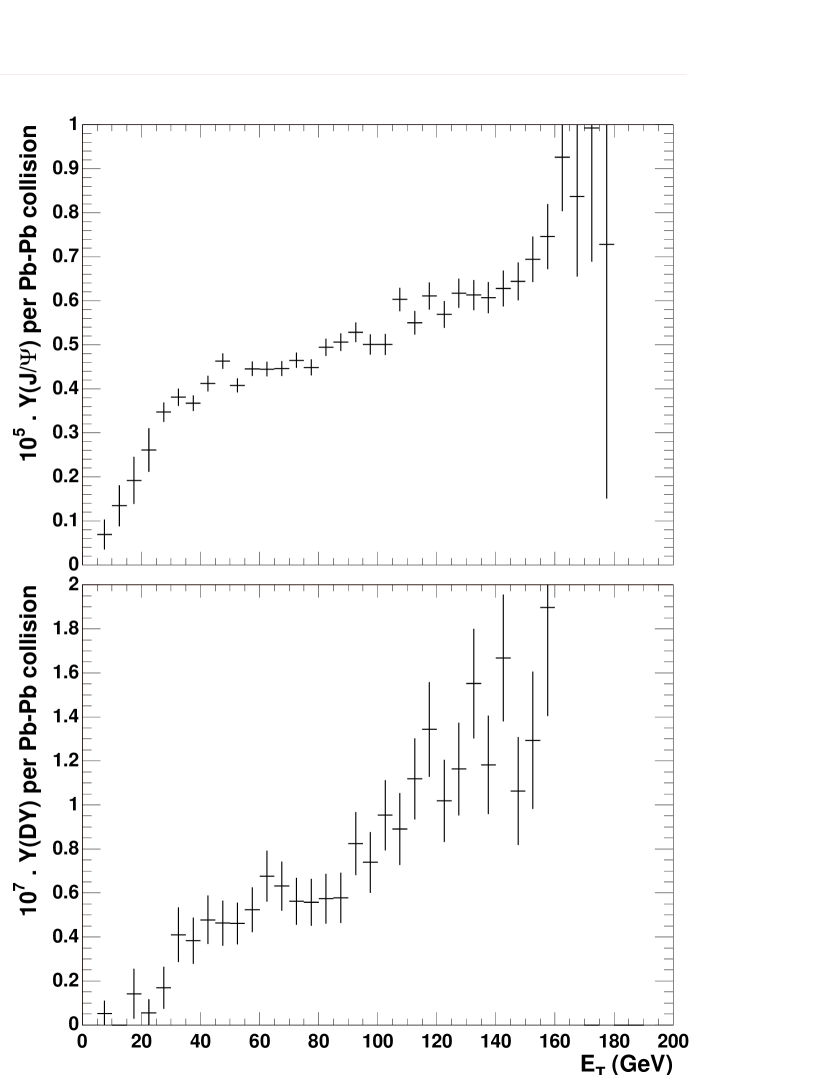
After the first step, i.e. the normalization of the and Drell–Yan cross sections to the inclusive one, one gets (Fig. 3) the yields of and Drell–Yan events per Pb–Pb collision as a function of . Both yields increase with , without any artificial decrease at large . Whereas this increase is rather steady for Drell–Yan events, there is a change of behaviour for at about 40 GeV, an value beyond which the increase is definitely slower for than for Drell–Yan events. This is an indication for suppression in central collisions, relative to Drell–Yan events.
After the second step, i.e. replacing by , one gets (Fig. 4) the yields of and Drell–Yan events per Pb–Pb collision as a function of , the squared impact parameter estimated from the inclusive cross section. Slices with almost constant width in have been used. The same remarks could be made as from Fig. 3 after the first step. The value of 40 GeV for the change of behaviour of the yield is changed into a value of 80 fm2. Points with large error bars at large in Fig. 3 are all contained in the point at the smallest value of in Fig. 4. The limits of the yields for most central collisions are more easily readable from Fig. 4 than from Fig. 3. They could be directly compared with the and Drell–Yan yields in p–p collisions – and Drell–Yan cross sections divided by the total inelastic p–p cross section – times the number of nucleon–nucleon collisions in most central Pb–Pb collisions from a Glauber model calculation. From integration of the yields in Fig. 4 one can get the total cross sections for and Drell–Yan production divided by .
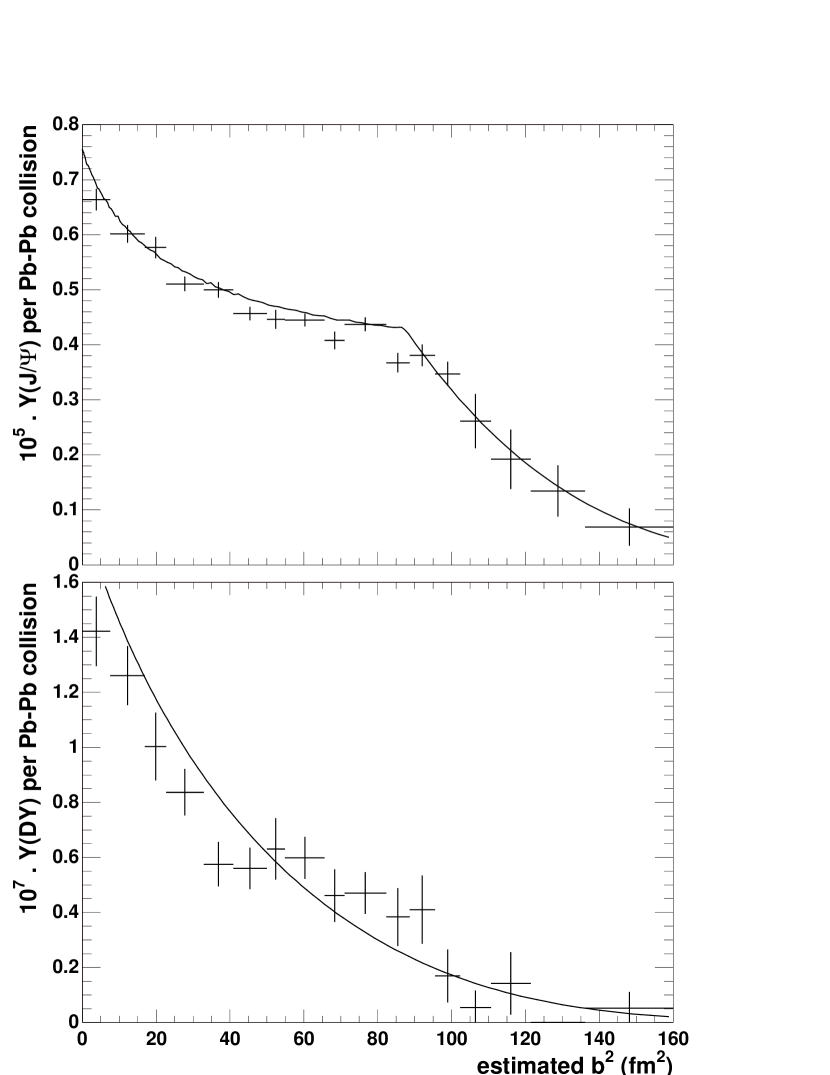
A comparison is also made in Fig. 4 with a model calculation à la Blaizot and Ollitrault BLA96 . The yield of Drell–Yan events per Pb–Pb collision as a function of is compared, within a scale factor, to the number of nucleon–nucleon collisions calculated in the Glauber model as a function of the real , without taking into account the fluctuations between the estimated and actual . The agreement is reasonable. For events this number of nucleon–nucleon collisions is multiplied by two correction factors for absorption. The first one corresponds to normal absorption in nuclear matter with some cross section . The second one is intended for simulating complete suppression due to quark–gluon plasma formation. It goes down from one to zero when nucleon–nucleon collisions producing occur in a tube of nuclear matter with nucleon density per unit area larger than a critical value . With mb and fm-2, the model reasonably accounts for the experiment, in particular for the clear change of behaviour at an impact parameter of about 9 fm.
Finally, very accurate results are obtained for production which can be compared easily with simple models. The onset of the anomalous suppression can be looked at with much better accuracy than on the basis of the usual over Drell–Yan ratio. However, we want to recall the word of caution from the beginning of this section. Definite conclusions about anomalous suppression need to be drawn from official data. This is also why there was no attempt to calculate error bars for the values of and . Moreover the Drell–Yan production remains an essential result. One has to check its normal behaviour within its inherently limited accuracy.
5 Discussion
One idea from this new data presentation, the normalization of events to the inclusive, or minimum bias, distribution, has been used recently by the NA50 collaboration ABR99 , making the most of the whole statistics available for production in their 1996 data taking. However, this new presentation is not used as such, except the first step for Drell–Yan production only. For easy comparison with previously published results, the yield is transformed into a “minimum bias” over Drell–Yan ratio, through a division by a model calculation for the Drell–Yan yield. In order to stick more closely to the raw experimental data, it would be very interesting if the new presentation were to be applied as a whole to these most recent and also to future NA50 data. One would not have to worry anymore because of the different scales used in successive presentations. More importantly, it would be particularly helpful to compare between one another the results obtained with the three centrality variables available in this experiment, namely the transverse energy measured in an electromagnetic calorimeter, the zero-degree energy measured in a hadronic calorimeter, and the multiplicity measured in a silicon detector. Perhaps it would also be possible to get more accurate information on production from older data takings, for example in collisions.
Finally, it is interesting to try and quantify the gain brought about by the normalization to the inclusive centrality distribution in the assessment of the anomalous suppression in collisions. It can be done for example on NA50 results as shown in Fig. 9 from ABR99 . In this figure, the “minimum bias” as well as the measured over Drell–Yan ratios are divided by the normal absorption factor and plotted as a function of the mean nuclear path length (Fig. 5). The normal absorption appears as a horizontal line at a constant value of 1, without any information on its uncertainty. In Fig. 5, an uncertainty band, necessary for a quantitative comparison to results, has been added around the straight reference line. It has been calculated from the same p nucleus and data as used in ABR99 , with correct error bars as compared to previous NA50 publications (see note added in proof to RAM98 ), and taking into account the correlation between the normalization and the slope of the exponential fit. An uncertainty band had already been shown in KHA97 but it had been calculated with the old error bars for data and without taking into account the correlation between the normalization and the slope. By chance this uncertainty band was not too much wrong since both effects were roughly compensating for each other. One way to quantify the discrepancy of data from normal nuclear absorption consists in fitting the points corresponding to most central collisions, i.e. beyond fm, with an exponential function of (Fig. 5). The result is an effective additional absorption cross section of 9 mb, with uncertainties of 0.6 and 2.6 mb depending on whether one uses the “minimum bias” or the measured over Drell–Yan ratio. With respect to the reference absorption cross section of mb, the significance of this additional absorption amounts to 9.8 or 3.3 standard deviations, respectively, with a clear advantage to the “minimum bias” ratio, because it uses the normalization to the inclusive centrality distribution.

6 Conclusion and perspectives
A new data presentation has been proposed for results from nucleus–nucleus collisions. Its domain of application is not limited to and Drell–Yan production processes which have been chosen for illustration. For any “p” process one ends with its yield per nucleus–nucleus collision as a function of the estimated squared impact parameter. Since the normalization of the yield refers to the most probable, i.e. inclusive, process, one keeps the best statistical accuracy for each process. It seems to be a good way for going as far as possible with raw experimental data, sticking as closely as possible to them while trying to show physical quantities of interest. Could it be the best way to present experimental results concerning nucleus–nucleus collisions before comparison to any model? From the theoretical side, one would like to compare experimental results with results from model calculations on plots using the most relevant variable from the model, for instance the number of participants, the number of nucleon–nucleon collisions, the mean path length in nuclear matter, etc. The proposed data presentation could serve as the common basis before going to any of these plots.
For future nucleus–nucleus experiments that will take place at RHIC and LHC, the present work shows that it is possible to study any process independently of all others. The experimental results to be presented for each process have a direct physical meaning and are easily compared with model calculations. The only requirement is the measurement of the inclusive differential cross section with respect to at least one centrality variable used to sort out events according to impact parameter. It is essential that such inclusive measurements be available in experiments to be performed at RHIC and LHC.
Acknowledgements.
The authors want to express their thanks to F. Bellaiche for providing them with the values of and Drell–Yan cross sections from his thesis. Discussions with J.-P. Blaizot, J. Hüfner, J.-Y. Ollitrault and H. Satz are gratefully acknowledged.References
- (1) M.C. Abreu et al. (NA50 Collaboration), Phys. Lett. B 410, 327 (1997)
- (2) M.C. Abreu et al. (NA50 Collaboration), Phys. Lett. B 410, 337 (1997)
- (3) L. Ramello for the NA50 Collaboration, Nucl. Phys. A 638, 261c (1998)
- (4) Talk presented by A. Romana for the NA50 Collaboration, XXXIIIrd Rencontres de Moriond, Les Arcs, France, March 21–28, 1998
- (5) M.C. Abreu et al. (NA50 Collaboration), Phys. Lett. B 450, 456 (1999)
- (6) T. Matsui, H. Satz, Phys. Lett. B 178, 416 (1986)
- (7) J. Gosset, A. Baldisseri, H. Borel, F. Staley, Y. Terrien, in Proceedings of the International Workshop on Understanding Deconfinement in QCD, ECT* Trento, Italy, March 1–12, 1999, edited by D. Blaschke, F. Karsch, C.D. Roberts (World Scientific Publishing), to be published [DAPNIA/SPhN-99-18]; J. Gosset, A. Baldisseri, H. Borel, F. Staley, Y. Terrien, in: Proceedings of the XIVth International Conference on Ultra-relativistic Nucleus–nucleus Collisions (Quark Matter 99) Torino, Italy, May 10–15, 1999, to be published In Nucl. Phys. A [DAPNIA/SPhN-99-34]
- (8) F. Bellaiche, thèse de doctorat, Université Claude Bernard Lyon-1 (1997)
- (9) C. Cavata et al., Phys. Rev. C 42, 1760 (1990)
- (10) J. Cugnon, D. L’Hôte, Nucl. Phys. A 397, 519 (1983)
- (11) M.M. Aggarwal et al. (WA98 Collaboration), submitted to Phys. Rev. Lett. [nucl-ex/9807004]
- (12) J. Barrette et al. (E877 Collaboration), Phys. Rev. C 59, 884 (1999)
- (13) J.-P. Blaizot, J.-Y. Ollitrault, Phys. Lett. B 77, 1703 (1996)
- (14) D. Kharzeev, C. Lourenço, M. Nardi, H. Satz, Z. Phys. C 74, 307 (1997)