The Transparency of 12C for Protons
Abstract
Existing cross-section data for -shell knockout in the reaction 12C11B - as obtained under different kinematic conditions - are shown to be mutually consistent, apart from a recent measurement performed in Mainz. New data have been collected at the Amsterdam Pulse Stretcher that confirm the normalization of the older measurements. An analysis of the world’s 12C11B data has yielded precise values of the spectroscopic factor for -shell and -shell knockout from 12C. These values have been used to evaluate the transparency of the 12C nucleus for -shell and -shell protons separately on the basis of recent high-energy 12C11B data taken at a four-momentum transfer squared of 1.1 (GeV/. As the resulting average value of the nuclear transparency, 0.81 0.04, is considerably higher than the value obtained from previous analyses and theoretical estimates, the high data were used instead for an independent determination of the spectroscopic strength for + knockout. Combining these results with the low data the spectroscopic factors appear to be momentum-transfer dependent. Possible explanations of these surprising results in terms of reaction-mechanism effects or a possible breakdown of the quasi-particle concept at high are discussed as well.
PACS number(s): 21.10.Jx, 21.30.Fe, 24.10.Ht, 27.20.+n
I Introduction
Electron-induced proton knockout experiments in the quasi-elastic domain are commonly used to study single-particle properties of nuclei [1, 2]. The data set for such measurements on 12C in particular is quite sizable [3, 4, 5, 6, 7, 8], possibly because the energy-resolution requirements are modest ( 1 MeV) and the target handling is easy. Therefore, it is no surprise that 12C measurements are often among the first calibration experiments to be carried out at new high-duty factor electron accelerators in the intermediate energy domain, such as AmPS [9], TJNAF [10] and Mainz [11].
An early comparison of part of the world’s 12C data for knockout from the -shell in the quasi-elastic domain [12] demonstrated the mutual consistency of these data. On the other hand, recent 12C data collected in Mainz [11] suggest that the normalization of previous data was off by 22%. It is important to resolve this discrepancy for the following reasons. First, the spectroscopic factors derived from data on 12C (and other nuclei) were shown to be quenched by about 30-40% as compared to mean-field values [1, 2], which has been interpreted as evidence for the existence of strong correlations between nucleons in nuclei [13, 14]. A further reduction of the spectroscopic factors by 22% would make the commonly accepted many-body interpretation uncertain. Secondly, the spectroscopic factors for and -knockout from 12C enter directly into the determination of the nuclear transparency, as recently studied on 12C (and several other nuclei) in the (squared) four-momentum transfer () range 1-6 (GeV/ in a search for color transparency phenomena [10, 15].
For these reasons we have re-analyzed all existing 12C data for knockout from the - and -shell that were taken in the quasi-elastic domain at 0.4 (GeV/ in one consistent approach. The results of this analysis indicate that the normalization of the Mainz data set [11] deviates with respect to all other existing data. In order to further corroborate this finding three new 12C measurements were performed at the AmPS facility of NIKHEF in kinematics that were chosen, as close as possible, to resemble the kinematics used in Refs. [7] and [11]. The new data are not in agreement with the Mainz results, but are in good agreement with all other data sets available.
Having thus established a reliable value of the spectroscopic factors for and knockout from 12C, we reconsider the determination of the transparency of 12C for protons. The relatively large transparency values derived from this analysis possibly indicate that the spectroscopic factors obtained at low can not be applied for the interpretation of high measurements. Instead, we have used the high data to study the dependence of the total spectroscopic strength for + knockout from 0.1 to 10 (GeV/. An unexpected momentum-transfer dependence of the spectroscopic strength is observed. We discuss reaction-mechanism effects and a possible breakdown of the quasi-particle concept at high as possible explanations for this observation.
This paper is organized as follows: in section II details are presented of the data sets used in the analysis. In section III we describe the analysis of -knockout data and present the new 12C measurements performed at AmPS. The analysis of -knockout data is described in section IV. In section V a re-evaluation is presented of the nuclear transparency derived from the experimental search for color-transparency effects at SLAC (experiment NE18 [15]) using the magnitude of the and spectroscopic factors for the reaction 12C as derived in sections III and IV. The alternative interpretation of these data in terms of a possible dependence of the spectroscopic strength in 12C is presented in section VI, while some possible explanations for the observed dependence are discussed in sections VI and VII. A summary is presented in section VIII.
II Data sets
Experimental data for the cross section of the reaction 12C were obtained at Frascati [3], Tokyo [4], Saclay [5, 6], NIKHEF [7, 8, 16, 17, 18, 19, 20], MIT/Bates [21, 22, 23, 24, 25], Mainz [11], SLAC [15] and TJNAF [10]. In the re-analysis of these data we have only used data sets covering a large ( 100 MeV/) range of missing momentum, as this gives a good indication of the internal consistency of each data set. Also, we require that the results of the data analysis be presented in terms of absolute cross sections (thus excluding Ref. [3]), and be centered at the low and intermediate missing-momentum range, i.e. 300 MeV/, where most of the cross section resides. The characteristics of the remaining data sets are summarized in Table I.
| data set | Kine- | |||||
| MeV | MeV | MeV/ | MeV | atics | (GeV/ | |
| -knockout | ||||||
| Tokyo [4] | 700 | 6-30 | 0,230 | 159 | () | 0.29 |
| Saclay [5] | 497 | 15-22 | 0,310 | 87 | () | 0.16 |
| Saclay [6] | 500 | 15-22 | -145,155 | 99 | par. | 0.09-0.32 |
| Saclay [6] | 500 | 15-22 | -155,165 | 99 | () | 0.09-0.32 |
| NIKHEF [7] | 285-481 | g.s | -175,230 | 70 | par. | 0.02-0.26 |
| Mainz [11] | 855 | g.s. | 110,190 | 93 | par. | 0.08-0.28 |
| 855 | g.s. | 70,140 | 85 | par. | 0.08-0.28 | |
| SLAC [15] | 2015 | 6-25 | -180,290 | 600 | () | 1.11 |
| -knockout | ||||||
| Tokyo [4] | 700 | 21-66 | 0,230 | 136 | () | 0.29 |
| Saclay [5] | 497 | 30-50 | 0,310 | 87 | () | 0.16 |
| NIKHEF [7] | 285-481 | 30-39 | -175,230 | 70 | par. | 0.02-0.26 |
| SLAC [15] | 2015 | 30-80 | -180,290 | 600 | () | 1.11 |
The existing data are compared on the level of the reduced cross section , which is obtained from the cross section by dividing out the off-shell electron-proton cross section (and a kinematic factor) and integrating the resulting spectrum over the width of the energy intervals considered. In many analyses the off-shell cross section of Ref. [26] has been used, whereas in Refs. [4, 5, 6], for instance, a different prescription [27, 28] is used. Similarly, the missing-energy range over which the data have been integrated differs from case to case. These differences have been accounted for in the calculations used to interpret the data. For details on the analysis of experiments and the extraction of from cross-section data, the reader is referred to Ref. [29].
III Analysis of knockout data
In Fig. 1 the -knockout data from Refs. [4, 5, 6, 7] are displayed and compared to Complete Distorted-Wave Impulse Approximation (CDWIA) calculations of the type described in Ref. [30]. The input parameters of these calculations have been determined as follows. The CDWIA calculations have been performed with a standard Woods-Saxon (WS) bound-state wave function and optical-potential parameters derived from elastic proton scattering off 12C [31]. The real part of the optical potential, which was thus interpolated from the tables of Ref. [31], has been reduced by 5 MeV in order to account (partly) for channel-coupling effects. (This procedure is verified in Ref. [7] by comparing to explicit coupled-channels calculations.) The calculated cross sections are divided by a kinematic factor and the electron-proton cross section of McVoy and Van Hove [32]. The use of instead of in the calculations is motivated by the fact that the nucleon-current operator in the CDWIA calculations is a non-relativistic expansion of the one that is used in . The division by partly accounts for that difference. (Note that in PWIA the correction is exact.) For the kinematics of the experiments considered the ratio is between 0.95 and 0.98. The spectroscopic factor and the radius of the WS well have been fitted to the data measured at NIKHEF for the ground-state transition and and transitions to the first two excited states, as these data have the smallest statistical and systematic uncertainties. The obtained fit values (, and ) are (1.790.03, 3.120.05 fm, 165/34), (0.220.01, 3.940.05 fm, 52/37) and (0.190.01, 3.340.06 fm, 47/37) for the ground state, first and second excited state, respectively. These values are in agreement with those published before [7]. Differences with previous values are due to minor changes in the CDWIA code, as described in Ref. [38], and to the inclusion of an additional free parameter used in Ref. [38]. In more detailed analyses [12, 36, 37] this parameter was shown to be unneeded to describe the data, whence we have omitted it in the present analysis.
The differences between the calculations and experimental data for negative ( -100 MeV/) in parallel kinematics (Saclay and NIKHEF data), are attributed to coupled-channels and charge-exchange effects, which are not included in the present analysis. In Refs. [12, 36, 37] it is shown that a good description of the momentum distribution at negative can be obtained if these contributions, which are very small at positive , are taken into account. In order to avoid any bias of the presently deduced spectroscopic factors on the size of these contributions we have included the positive data only in the fit to the NIKHEF data. Moreover, since the error bars of the negative data are much larger than those of the positive data the deduced spectroscopic factors are hardly affected by the omission of the negative data in the fits.
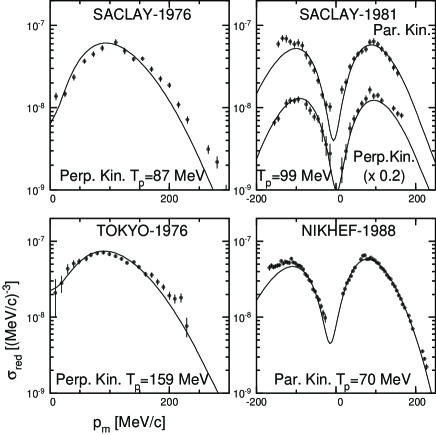
Using the values of and as derived from the NIKHEF data, CDWIA calculations have been performed for the other data sets displayed in Fig. 1. In each case the kinematics used as input for the calculations were adjusted to those used in the experiment, and the optical-model parameters were interpolated from the tables of Ref. [31]. For this purpose we used the proton laboratory scattering energy as calculated via Eq. (4.3) of Ref. [33] from the proton kinetic energy () employed in the experiment. The aforementioned slight modification of the optical-model parameters was also applied. This correction for channel-coupling effects presumably represents an overestimation as it was gauged at the lowest value of , i.e. 70 MeV, where channel-coupling effects are largest. However, since the effect of the channel-coupling correction on the deduced values of and for the dominant g.s. transition is only 2% or less at = 70 MeV [7], a more refined evaluation of channel-coupling effects at each value of has not been carried out. (Note that the channel-coupling effects are also small compared to the systematic uncertainty of the data, which ranges from 4% to 15%.) It has to be realized that our procedure results in calculations for all data sets, except the one obtained at NIKHEF that was used to fix the values of the spectroscopic factors and the radius of the bound-state wave functions.
From Fig. 1 it is concluded that the calculations give a fair simultaneous description of the data sets of Tokyo, Saclay and NIKHEF. The apparent discrepancy between the calculations and the Saclay data of 1976 at 200 MeV/ is probably related to an enhancement of the longitudinal-transverse interference structure function , which is absent in the data collected in parallel kinematics. In the Saclay data of 1976, which were measured in ()-constant (also called perpendicular) kinematics, an enhanced term may show up at large since its contribution to the cross section is proportional to sin, where is the angle between the three-momentum transfer and the outgoing proton momentum. In Refs. [1, 34, 35] it has been shown for 16O and 40Ca that is enhanced by up to a factor of two compared to standard CDWIA calculations. Such an enhancement would only affect the ()-constant data at high and be stronger for small .
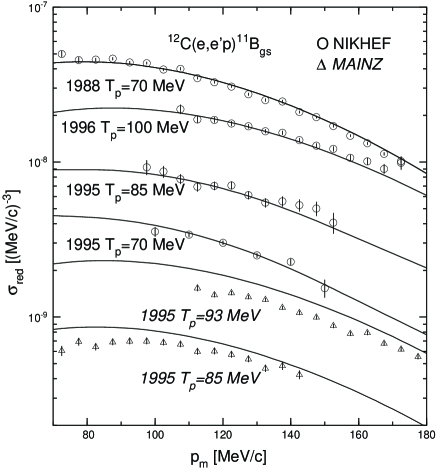
When we apply the absolute calculations, as described above, for the kinematics of the recently published [11] Mainz experiment we find that their data lie about 20% below the calculated reduced cross sections (see Fig. 2). In order to resolve this discrepancy between the Mainz data and the other existing data, new measurements have been performed at the Amsterdam Pulse Stretcher (AmPS) facility [9]. The high duty-factor electron beams produced by AmPS enabled us to carry out high-statistics 12C measurements with hardly any contamination due to accidental coincidences in a short amount of time (less than 30 minutes) at an average beam intensity of 5 A using a mg/cm2 12C target. The electron and the proton were detected and momentum-analyzed with two high-resolution magnetic spectrometers [39]. The kinematics of the measurements (summarized in Table II) were chosen to be close to the kinematics of the existing 12C measurements described in Refs. [7] and [11]. As the beam energy available differed somewhat from the value used in the two previous experiments, there is a small difference in the value of the virtual photon polarization parameter . However, as the ratio of the longitudinal and transverse response functions of the reaction 12C is known to be in agreement with the LT ratio of the free electron-proton cross section [40], these differences are properly accounted for in the CDWIA calculations.
| Kine- | ||||||
|---|---|---|---|---|---|---|
| MeV | MeV/ | MeV | matics | % | ||
| NIKHEF88 | 285-481 | -175,230 | 70 | par. | 4 | |
| NIKHEF95 | 378 | 100-150 | 70 | par. | 4 | |
| NIKHEF95 | 585 | 100-150 | 85 | par. | 4 | |
| NIKHEF96 | 611 | 100-150 | 100 | par. | 4 | |
| Mainz95 | 855 | 70-140 | 85 | par. | 7 | |
| Mainz95 | 855 | 110-190 | 93 | par. | 7 |
The results of the new measurements are also shown in Fig. 2, where the data are compared to CDWIA calculations of the same type as described before, i.e. the normalization (=1.79) of the curves is derived from the data of Ref. [7], while the optical-potential parameters and kinematics are properly derived from the experimental conditions. Again a good description of the experimental data is found, thus confirming the normalization of the older experiments - from Refs. [4, 5, 6, 7] - of Fig. 1. If we fit the normalization of the curves to the experimental data we arrive at ground-state spectroscopic factors for each experiment as listed in Table II.
Having established the proper normalization of most of the existing 12C data, we may now use these data as a collection of independent measurements of the nuclear overlap matrix element for the removal of protons from 12C leading to the ground state and low-lying excited states of 11B. Hence, each of the data sets was used in order to determine a value of the spectroscopic factor for -knockout from 12C. This has been done by fitting the data of each experiment with the corresponding CDWIA curves using as a free parameter. The resulting values of are listed in Table III, and are seen to be in good agreement with each other. As the individual values of have been derived from experiments that were carried out under widely different conditions, it is concluded that the treatment of the reaction mechanism is well under control. Further evidence supporting the validity of the CDWIA approach can be found in Ref. [41], where it is shown that CDWIA calculations reproduce the nuclear transparency for protons at modest values of (and thus of ), as measured at MIT/Bates [42]. Hence, by taking the weighed average of these independent values of (where the systematic uncertainties have been added quadratically to the statistical errors, see Table III) a good and reliable measure of the nuclear overlap matrix element is obtained, i.e. = 2.23 0.07.
| data set | ||||
|---|---|---|---|---|
| MeV | % | |||
| Tokyo [4] | 2.16 0.10 | 21-30 | 0.08 0.02 | 8 |
| Tokyo [4] | 30-42 | 0.66 0.02 | 8 | |
| Tokyo [4] | 42-54 | 0.36 0.03 | 8 | |
| Tokyo [4] | 54-66 | 0.09 0.02 | 8 | |
| Tokyo [4] | 21-66 | 1.19 0.05 | 8 | |
| Saclay [5] | 2.19 0.13 | 30-50 | 0.84 0.02 | 15 |
| Saclay [6] | 2.28 0.07 | 7 | ||
| Saclay [6] | 2.31 0.06 | 7 | ||
| NIKHEF [7, 8] | 2.20 0.04 | 21-30 | 0.047 0.002 | 4 |
As compared to the independent-particle shell-model prediction (=4) the value of (summed over the three transitions) is 44 % low, thus confirming the values earlier reported [1, 2], albeit with higher precision. Hence, the many-body interpretation of the low spectroscopic factors found in measurements at (GeV/ need not be revised.
IV Analysis of knockout data
Since the existing data for knockout from 12C cover different ranges in missing energy (see Table I and Fig. 3) and the experimental missing-energy distribution extends over a range of about 25-80 MeV (see e.g. Refs. [4, 5, 21, 22, 23] a special procedure was followed to extract the -strength. Since the peak of the missing-energy distribution is located at about 40 MeV we first fitted CDWIA calculations to the data of Saclay in the range 30-50 MeV and those of Tokyo in the range 30-54 MeV. For these calculations we used a Woods-Saxon (WS) bound-state wave function with a binding energy of 40 MeV and fitted the radius of the WS well. With the resulting geometry of the WS well (=2.66 fm, =0.65 fm) we calculated all other reduced cross sections with wave functions that have a binding energy corresponding to the center of the missing-energy interval of the data under consideration. Hence the depth of the well increases with increasing binding energy while simultaneously the rms radius of the wave function decreases.
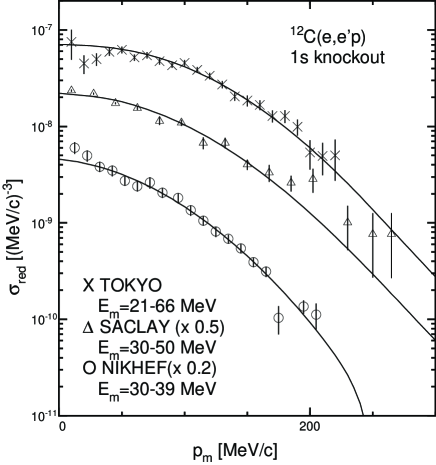
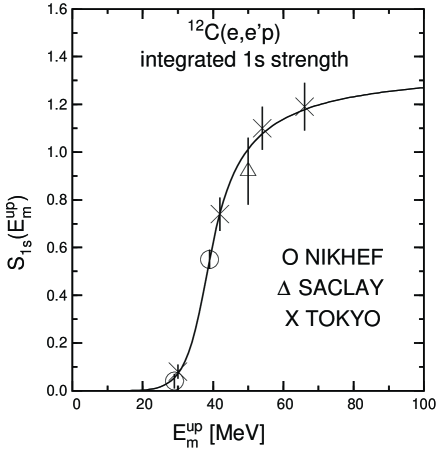
Next the normalization of these calculated reduced cross sections was fitted to each data set to obtain the spectroscopic factor for knockout in the particular interval (see Table III and Fig. 3). Since the Tokyo data set in the interval =21-30 MeV contains both and strength a two-parameter fit was employed in this case. From the obtained normalizations one can easily deduce the strength () integrated to an upper limit in missing energy denoted by . These values have been plotted in Fig. 4 where the errors include statistical and systematic uncertainties (see Table III) added in quadrature. The strength at any value of can now easily be deduced from a fit to the data with the expression :
| (1) |
where
| (2) |
In this approach the energy dependence of the spectral function is modeled as a Lorentzian with an energy-dependent width () that was calculated according to the formula given by Brown and Rho [48] who use =24 MeV and =500 MeV2. In Eq. (1) the quantity is the asymptotic () occupation for the -shell, while is the centroid energy for the -shell. In the fit , and were treated as free parameters and found to be MeV2, and MeV. The deduced spreading width MeV is in good agreement with the broadening of the missing-energy distributions as shown in the Saclay [5] and Tokyo [4] data. The fitted curve is seen to describe the data nicely. For the analysis of the SLAC data (=30-80 MeV) we will employ the value (80)-(30)=, where all correlated errors in the fitted parameters have been included.
V Comparison with the SLAC data
A Transparencies
Using the precisely determined values of and we have also reconsidered the interpretation of the 12C experiment performed at SLAC [15] at a somewhat higher value of = 1.1 (GeV/. In this experiment the nuclear transparency for protons was measured with the aim of searching for color-transparency effects [50], i.e. the predicted increase of the nuclear transparency due to the proposed reduced interaction probability of small color neutral objects with the surrounding medium (see Ref. [49] for a recent review).
The experimental nuclear transparency () is determined by fitting a PWIA curve to the data using its normalization as a free parameter. However, as the magnitude of the PWIA curve scales with both and , any uncertainty in is immediately reflected in the derived value of . In Refs. [10, 15, 43], theoretical estimates for and were used, creating a theoretical bias in the derived values of . With the presently available precise values of and in hand, it is now possible to derive a value for the nuclear transparency that is based on experimental results for the spectroscopic factors. It is noted that this procedure relies on the assumption that the reduction of spectroscopic strength (to about 60% of the IPSM value), which we derived from the low measurements, is the same at = 1.1 (GeV/. This implies that the increase of does not affect the amount of strength residing in the acceptance of the experiment ( 80 MeV). Future experiments with a larger acceptance (and very good signal-to-noise ratios!) can in principle study the validity of this assumption by searching for strength at high missing energies.
We have obtained the SLAC 12C data for - and -knockout from Ref. [43], and applied radiative corrections to these data. The size of these corrections coincides to within 2.5% with those calculated by the authors of Ref. [43]. The SLAC - and -knockout data for = 1.1 (GeV/ are displayed in Fig. 5, where they are compared to a plane-wave impulse approximation calculation (PWIA) based on the BSWF-parameters and spectroscopic factors derived from the low data that were described in sections III and IV. Hence, final-state interaction effects are neglected. The PWIA curves are in reasonable agreement with the data, immediately suggesting a relatively large value of . Subsequently the data were fitted with the expression
| (3) |
where is treated as a free parameter. This procedure yields = 0.86 0.05 and = 0.71 0.06. For the data in the region =30-80 MeV we employed a fit using both a and a (small) component. The presence of the latter is due to the fact that the SLAC data are not radiatively unfolded and hence the radiative tail of the distribution (which has an exactly calculable magnitude) is also included in this energy region.
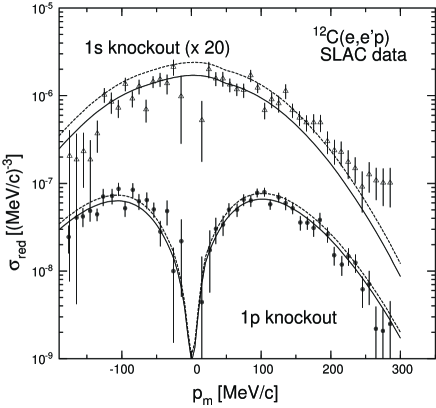
Combining the two results for the transparency of -shell and -shell protons, we have evaluated the average transparency of nucleons removed from 12C according to
| (4) |
yielding = 0.810.04, which is considerably larger than the value 0.650.05 quoted in Ref. [15].
The origin of this difference is due to the way the authors of Ref. [15] analyze their data. First, they determine an overall proton transparency for the data integrated up to =100 MeV, whereas we deduce separate (and significantly different) transparencies for the - and -shell, and then obtain the weighed average. Secondly, they use an (overall) theoretical ’correlation correction’ of 0.9010.024 to normalize their PWIA calculation, whereas we use experimentally determined spectroscopic factors to separately normalize the and momentum distributions by 0.560.02 and 0.590.04, respectively. Thirdly, the authors of Ref. [15] use bound-state wave functions generated in a Woods-Saxon potential derived from an early analysis of the Saclay data [5], which did not include non-locality corrections, Coulomb distortion and off-shell effects and used an optical potential without a spin-orbit term. In our treatment the bound-state wave functions are based on an analysis of the world’s data set for the reaction 12C, which accounts for all these effects and moreover uses an optical potential that describes proton scattering in the full employed proton energy range and includes corrections for coupled-channels effects. As a result the bound-state wave functions are different (the rms radius for the () wave functions differs by +7 (-2) %). These three reasons explain why the value =0.810.04 that we deduce in the present analysis is significantly larger than the value 0.650.05 obtained in Ref. [15]. As our value for has been obtained in the range up to 80 MeV, whereas the overall SLAC value was obtained from data integrated up to 100 MeV, one may wonder whether this difference could explain the difference in obtained transparency. Inspection of the measured SLAC missing-energy distribution [15, 43] shows that in the range =80-100 MeV it closely follows their simulated theoretical curve and hence their deduced transparency value is not sensitive to the choice of the upper integration limit.
The SLAC data also include 12C measurements at values of 3, 5 and 7 (GeV/. In order to derive proper values of the nuclear transparency in this range, the spectroscopic factors for and knockout quoted above should be used again. Rather than carrying out the same analysis for the higher data again, we have used the ratio of the presently obtained value for and the published value of as a correction factor. This simplified procedure is motivated by the fact that the difference between the published data and the present analysis is largely due to use of experimentally constrained spectroscopic factors. We have thus applied the factor (as derived from the = 1.1 (GeV/ data) to the other NE18 data, the result of which is displayed in Fig. 6 by the circle symbols. An average nuclear transparency of about 0.8 is found.
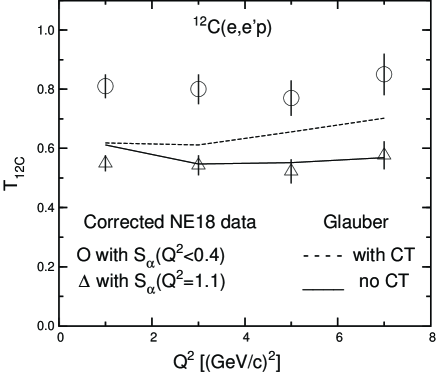
The corrected NE18 data are compared to two Glauber calculations for the transparency. The solid curve is a standard Glauber calculation, while the dashed curve includes Color Transparency effects. Both calculations assume that the spectral strength has reached its asymptotic value, i.e. no corrections are made for possible knockout strength outside the range of the experiment. We observe that the corrected NE18 transparency data are well above the calculations, especially at the lowest values. As Color Transparency is not expected to have a significant influence on the data below 4 (GeV/ (see also Refs. [51, 52]), the discrepancy at =1.1 (GeV/ is particularly disturbing.
It is difficult to identify a possible origin for the 4.2 deviation between the corrected data and the Glauber calculation at = 1.1 (GeV/, because of the following reasons: (i) the recent TJNAF data for the nuclear transparency [10] confirmed the NE18 data (using the same value for the ’correlation correction’), making it unlikely that the effect is due to an experimental error; (ii) the optical model calculations for the low-energy 12C data give consistent results for different kinematics, different nuclei [1, 2], and are even able to reproduce the measured nuclear transparency in the very low domain [41]; (iii) it is hard to believe that the Glauber calculations are incorrect as they are able to reproduce elastic and inelastic proton scattering data in the relevant energy domain (few GeV) [53], and different authors are able to reproduce the theoretical calculations shown in Fig. 6 [52, 51, 54].
B Spectroscopic factors
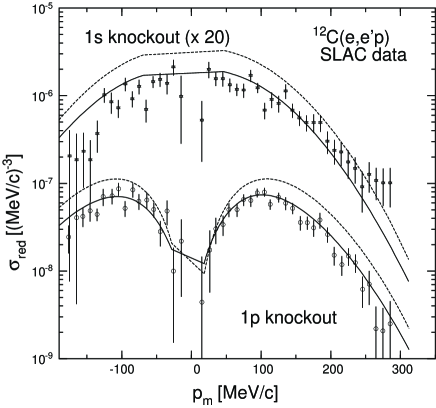
If one trusts the Glauber approach as a reliable calculation of the final-state interaction at high , the SLAC data may be used instead to extract spectroscopic factors at these momentum transfers. For that purpose we carried out Glauber calculations for the SLAC momentum distributions, which are compared to the data in Fig. 7. Apart from the Glauber calculation itself (solid curve) also a PWIA curve (dashed line) is shown. For both curves the spectroscopic factors were set equal to . One immediately derives from the ratio between Glauber and PWIA curves that at this energy the absorption factor due to the final-state interaction for () knockout is 0.6-0.7 (0.5-0.6), where the range indicates the dependence on . At first glance the Glauber curves with seem to describe the data rather well, but if one fits the data with the dependence of the Glauber curves one arrives at spectroscopic factors =3.560.12 and = 1.500.08. These values are appreciably larger than the ones determined from the analysis of the world’s low data as presented in sections III and IV.
Obviously, when we apply these spectroscopic factors in the calculation of the PWIA momentum distribution (see Eq. (3)) in order to determine the transparency, we arrive at the much lower transparency values indicated in Fig. 6 by the triangles. These values are close to the original NE18 values since the total spectroscopic strength, + =5.060.14, determined here from the Glauber fits, is close to the theoretical value employed in the original NE18 analysis.
VI dependence of the deduced spectroscopic strength
The apparent discrepancy between the analysis of 12C data at low and at high is illustrated in Fig. 8. Here, we plot the summed spectroscopic factors + for and knockout as a function of in the range between 0.1 and 10 (GeV/. At low ( 0.6 (GeV/) the results of the combined analysis of the NIKHEF, Saclay and Tokyo data (see sections III and IV) are shown and those of two experiments performed at Bates [22, 23], which covered a small acceptance and were therefore not included in the analysis of sections III and IV. All low results, which were obtained with an optical-model treatment of the final-state interaction, are mutually consistent and lead to a total strength +=3.450.13. At higher we plot the data of the SLAC experiment [15], as discussed in section V, and those of a recently published TJNAF experiment [10]. Here, the spectroscopic factors were deduced from a comparison of experimental cross sections with calculations employing a Glauber approach for the final-state interaction. These data exhibit a modest dependence, which is already interesting in itself, and moreover, they do not seem to join smoothly to the low data.
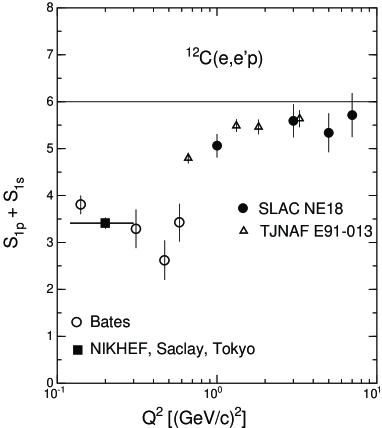
In conventional nuclear-structure models the spectroscopic strength should be independent of . Hence, the question arises what the origin of the observed discontinuity near =0.6 (GeV/ can be. The two main differences in the analysis of the low and the high data are a different treatment of the final-state interaction and the use of a different current operator. Kelly [44] has calculated the final-state interaction in the range 0.2-1.2 (GeV/ using an optical model with the EEI interaction, which was compared [10] to the results of a calculation involving the Glauber approach. Differences between the two approaches of up to 10% are found, but these are not sufficient to explain the observed discontinuity.
The current operator used in the analysis of the low data is a non-relativistic one, whereas in the Glauber calculations performed for the analysis of the high data a relativistic current operator is employed. Earlier comparisons [45, 46] of relativistic versus non-relativistic analyses data at low have shown that differences in the extracted spectroscopic strength of up to 15% occur, again not enough to explain the observed discrepancy. Clearly, a consistent analysis of all data between 0.1 and 10 (GeV/ could improve insight into this matter. Such an analysis is beyond the scope of the present paper.
Finally, it should be noted that in all analyses only one-body operators are included in the current operator. Since two-body currents (meson exchange, intermediate delta excitation) markedly differ in their dependence from the one-body current, these may be at the origin of the observed dependence of the the extracted strength. In a recent L/T separation of 12C data carried out at = 0.6 and 1.8 (GeV/ at TJNAF [47] such a dependence of the transverse response, which receives contributions from the two-body currents, has been observed. Further calculations, involving one-body and two-body currents in the operator, are needed to quantify this contribution. It should be noted, though, that the contributions due to meson-exchange currents and intermediate delta excitation are expected to become less important with increasing , while at low they have been estimated to be small [55].
VII Discussion
The analysis of the various data sets presented in sections III-V has revealed an unexpected dependence of the spectroscopic factors deduced from 12C experiments in the quasi-elastic domain. In the previous section it has been argued that the observed dependence (illustrated in Fig. 8) could be caused by changes in the mechanism of the reaction with . However, at this point it remains unclear whether such changes are large enough to explain the data, since all the effects discussed in section VI are constrained by other experimental data. Hence, it is worthwhile to consider other possible explanations of the remarkable dependence of the data as well.
For instance, it could be speculated that spectroscopic factors have an intrinsic dependence. While such an ansatz is in conflict with conventional models of nuclear structure, other many-body systems are known to have a scale-dependent renormalization. As an illustration we mention the quasi-particle description of many-body fermion systems in condensed matter physics, and the QCD description of the quark-gluon structure of the nucleon (see also Refs. [56, 57, 60]). In fact, both in condensed matter physics and in nuclear physics a description of a many-body system in terms of quasi-particles interacting through an effective potential is quite successful [56, 58]. In such a description the correlations between particles are included by using effective potentials. The size of these effective potentials changes if the resolution by which the system is probed increases, as some of the correlations are resolved.
In order to visualize how a possible dependence of spectroscopic factors may come about we consider the relevant energy and time scales that are involved in quasi-elastic electron scattering. The electron-nucleon interaction itself can be characterized by a time scale , where represents the energy transfer to the struck nucleon. The time scale that characterizes the binding of the nucleon with the nuclear mean field is given by . If and are of similar size the effects of nuclear binding (i.e., long-range correlations) will be important. This situation occurs at low values of , i.e., those corresponding to the kinematics used in the Bates, NIKHEF, Saclay and Tokyo experiments, with 2 fm/ and 4 fm/. On the other hand, under the conditions used in the SLAC experiment (at = 1 (GeV/), 0.2 fm/, while remains unchanged. Hence, the effect of long-range correlations has a tendency to disappear at high , resulting in a rise of the spectroscopic factors with momentum transfer.
Although the argument given above explains the qualitative features of the observed dependence of the spectroscopic factors, it is too early to draw definite conclusions. A more quantitative evaluation of both the reaction mechanism effects and the proposed renormalizability of spectroscopic factors is needed for a full development of this subject.
VIII Conclusion
A detailed analysis of existing 12C data has shown the mutual consistency of existing data sets - with the exception of recent data from Ref. [11]. ***In a private communication with representatives from the Mainz experiment, it has become clear that the deviation between the Mainz data and the data from other laboratories is presumably due to a complicated dead time effect. New experimental data obtained at the high-duty factor AmPS facility confirm the normalization of the older data sets. From all data available precise values for the spectroscopic factors for and proton knockout from 12C have been derived, which were used to re-evaluate the nuclear transparency from 12C data measured at high . The deduced nuclear transparency is considerably closer to unity than previously reported. If we assume instead that Glauber calculations give an adequate description of the final-state interaction effects at high , the same data can be used to derive independent values of the spectroscopic factor at high . In such an approach the spectroscopic factors for proton knockout from 12C show an unexpected dependence. We have discussed several possible explanations for this unexpected observation. As there is no treatment of the reaction mechanism available that can be consistently applied from = 0.1 to 10 (GeV/, it cannot be excluded that the dependence of the spectroscopic factors is an artifact of the reaction mechanism description. On the other hand it can also be speculated that the spectroscopic factors have an intrinsic dependence, due to the possibly reduced influence of long-range correlations at high . Further calculations are called for to resolve this issue.
Acknowledgments
The authors like to thank M.F. van Batenburg and R. Medaglia for their contributions to the analysis of the AmPS 12C data. They also acknowledge fruitful communications with Dr. T.G. O’Neill, Prof. N.C.R. Makins, and Prof. R.G. Milner on the interpretation of the NE18 data. Two of us (L.L., M.S.) want to thank the Institute for Nuclear Theory at the University of Washington for its hospitality and the Department of Energy for partial support during completion of this work. This work is part of the research program of the Stichting voor Fundamenteel Onderzoek der Materie (FOM), which is financially supported by the Nederlandse Organisatie voor Wetenschappelijk Onderzoek (NWO). M.S. would like to thank DESY for the hospitality during the time this work was done. Research of M.S. was supported in part by the U.S. Department of Energy, research of L.F. was supported by the Israely Academy of Science.
REFERENCES
- [1] L. Lapikás Nucl. Phys. A553, 297c (1993).
- [2] G. van der Steenhoven and P.K.A. de Witt Huberts, in Modern Topics in Electron Scattering, edited by B. Frois and I. Sick (World Scientific, Singapore, 1991), p. 510.
- [3] U. Amaldi, G. Campos Venuti, G. Cortelessa, E. de Sanctis, S. Frullani, R. Lombard and P. Salvadori, Phys. Lett. 25B, 24 (1967).
- [4] K. Nakamura, S. Hiramatsu, T. Kamae, H. Muramatsu, N. Izutsu and Y. Watase, Nucl. Phys. A268, 381 (1976).
- [5] J. Mougey, M. Bernheim, A. Bussiere de Nercy, A. Gillebert, Phan Xuan Ho, M. Priou, D. Royer, I. Sick and G.J. Wagner, Nucl. Phys. A262, 461 (1976).
- [6] M. Bernheim et al., Nucl. Phys. A375, 381 (1982).
- [7] G. van der Steenhoven, H.P. Blok, E. Jans, M. de Jong, L. Lapikás, E.N.M. Quint and P.K.A. de Witt Huberts, Nucl. Phys. A480, 547 (1988).
- [8] G. van der Steenhoven, H.P. Blok, E. Jans, L. Lapikás, E.N.M. Quint and P.K.A. de Witt Huberts, Nucl. Phys. A484, 445 (1988).
- [9] P.K.A. de Witt Huberts, Nucl. Phys. A553, 845c (1993).
- [10] D. Abbott et al., Phys. Rev. Lett. 80, 5072 (1998).
- [11] K.I. Blomqvist et al., Z. Physik, A351, 353 (1995).
- [12] G. van der Steenhoven, in Proc. Workshop on Perspectives in Nuclear Physics at Intermediate Energies, Trieste, edited by S. Boffi, C. Ciofi degli Atti, and M. Giannini (World Scientific, Singapore, 1989), p. 469.
- [13] W.H. Dickhoff and H. Müther, Rep. Prog. Phys. 55, 1992 (1992); H. Müther and W.H. Dickhoff, Phys. Rev. C 49, R17 (1994).
- [14] C. Mahaux and R. Sartor, Adv. Nucl. Phys. 20, 1 (1991).
- [15] N.C.R Makins et al., Phys. Rev. Lett. 72, 1986 (1994); T.G. O’Neill et al., Phys. Lett. B351, 87 (1995).
- [16] G. van der Steenhoven et al., Phys. Rev. Lett. 57, 182 (1986).
- [17] I. Bobeldijk, H.P. Blok and G. van der Steenhoven, Phys. Lett. B281, 25 (1992).
- [18] G. van der Steenhoven, in Proc. Int. Workshop on Exclusive Reactions at high momentum transfer, Elba, 1993, edited by C. Carlson, P. Stoler, and M. Taiuti, (World Scientific, Singapore, 1994) p. 176.
- [19] L.J.H.M. Kester, etal Phys. Lett. B344, 79 (1995).
- [20] L. J. H. M. Kester, H. P. Blok, W. H. A. Hesselink, A. R. Pellegrino, E. Jans, L. Lapikás, G. van der Steenhoven, A. Zondervan and J. Ryckebusch, Phys. Lett. B366, 44 (1996).
- [21] R.W. Lourie et al., Phys. Rev. Lett. 56, 2364 (1986).
- [22] P.E. Ulmer et al., Phys. Rev. Lett. 59, 2259 (1987); Phys. Rev. Lett. 61, 2001 (1988).
- [23] L.B. Weinstein et al., Phys. Rev. Lett. 64, 1646 (1986).
- [24] H. Baghaei et al., Phys. Rev.C39, 177 (1989).
- [25] J.H. Morrison et al., Phys. Rev. C59, 221(1999).
- [26] T. de Forest Jr., Nucl. Phys. A392, 232 (1983).
- [27] J. Mougey, Ph D. thesis, Université de Paris Sud, Paris, 1976.
- [28] J. Potter, Nucl. Phys. 45, 33 (1963).
- [29] J.W.A. den Herder, E. Jans, P.H.M. Keizer, L. Lapikás, E.N.M. Quint, P.K.A. de Witt Huberts, H.P. Blok and G. van der Steenhoven, Nucl. Phys. A490 , 507 (1988).
- [30] S. Boffi, C. Giusti and F.D. Pacati, Phys. Rep. 226, 1 (1993).
- [31] J.R. Comfort and B.C. Karp, Phys. Rev. C 21, 2162 (1980).
- [32] K.W. McVoy and L. van Hove, Phys. Rev. 125, 1034 (1962).
- [33] L.J. de Bever, Ph.D. thesis, University of Utrecht, Utrecht, 1993.
- [34] C.M. Spaltro, H.P. Blok, E. Jans, L. Lapikás, M. van der Schaar, G. van der Steenhoven and P.K.A. de Witt Huberts. Phys. Rev. C 48, 2385 (1993).
- [35] L. Chinitz et al., Phys. Rev. Lett. 67, 568 (1991).
- [36] C. Giusti and F.D. Pacati, Nucl. Phys. A473, 717 (1988).
- [37] S. Jeschonnek, A. Szczurek, G. Co’ and S. Krewald, Nucl. Phys. A570, 599 (1994).
- [38] D.G. Ireland and G. van der Steenhoven, Phys. Rev. C 49, 2182 (1994).
- [39] C. de Vries, C. W. de Jager, L. Lapikás, G. Luijckx, R. Maas, H. de Vries and P. K. A. de Witt Huberts Nucl. Instr. 223, 1 (1984).
- [40] G. van der Steenhoven, Nucl. Phys. A527, 17c (1991).
- [41] D.G. Ireland, L. Lapikás and G. van der Steenhoven, Phys. Rev. C 50, 1626 (1994).
- [42] G. Garino et al., Phys. Rev. C 45, 780 (1992).
- [43] T.G. O’Neill, Ph.D. thesis, California Institute of Technology, 1994, unpublished; N.C.R. Makins, Ph.D. thesis, Massachusetts Institute of Technology, 1994, unpublished.
- [44] J.J. Kelly, Phys. Rev. C 54, 2547 (1996).
- [45] Y. Jin, H. P. Blok and L. Lapikás, Phys. Rev. C 48, R964 (1993).
- [46] J. M. Udias, P. Sarriguren, E. Moya de Guerra, E. Garrido and J. A. Caballero Phys. Rev. C 51, 3246 (1995).
- [47] D. Dutta et al., submitted to Phys. Rev. C.
- [48] G.E. Brown and M. Rho, Nucl. Phys. A372, 397 (1981).
- [49] Proceedings of the Workshop on Color Transparency, Grenoble, 1997, edited by E. Voutier (Institute de Sciences Nucleaires, Grenoble, 1998).
-
[50]
A.H. Mueller, in
Proc. of the XVII Rencontre de Moriond, Moriond, 1982,
edited by J. Tran Thanh Van
(Editions Frontières, Gif-sur-Yvette, France, 1982) p. 13;
S. J. Brodsky, in Proc. of the Thirteenth International Symposium on Multiparticle Dynamics, edited by W. Kittel, W. Metzger, and A. Stergiou (World Scientific, Singapore, 1982) p. 963. - [51] N.N. Nikolaev, A. Szczurek, J. Speth, J. Wambach, B.G. Zakharov and V.R. Zoller, Phys. Lett. B317, 281 (1993).
- [52] O. Benhar, A. Fabrocini, S. Fantoni, V.R. Pandharipande and I. Sick, Phys. Rev. Lett. 69, 881 (1992).
- [53] G.D. Alkhazov, S.L. Belostotsky and A.A. Vorobyov, Phys. Rep. 42, 89 (1978).
- [54] L. Frankfurt, M. Strikman and M. Zhalov, Phys. Rev. C 50, 2189 (1994).
- [55] S. Boffi and M. Radici, Phys. Lett. B242, 151 (1990); Nuc. Phys. A526, 602 (1991).
- [56] L.D. Landau and E.M. Lifshitz, Statistical Physics, vol. 1 (Course of Theoretical Physics, v. 5), (Pergamon Press, Oxford, 1980); E.M. Lifshitz and L.P. Pitaevskii, Statistical Physics, vol. 2: theory of the condensed state. (Course of Theoretical Physics, v. 9) (Pergamon Press, Oxford, 1980).
- [57] A.B. Migdal, Theory of Finite Fermi System and Application to Atomic Nuclei, (Interscience, New York, 1967).
- [58] G.E. Brown, Unified theory of nuclear models and forces, (North-Holland, Amsterdam, 1971).
- [59] K. G. Wilson, Phys. Rev. B 4, 3174 (1971).
- [60] S.K. Ma, Modern Theory of Critical Phenomena, (W.A. Benjamin, Reading, 1976).