Two-proton correlations from 158 AGeV Pb+Pb central collisions
Abstract
The two-proton correlation function at midrapidity from Pb+Pb central collisions at 158 AGeV has been measured by the NA49 experiment. The results are compared to model predictions from static thermal Gaussian proton source distributions and transport models rqmd and venus. An effective proton source size is determined by minimizing between the correlation functions of the data and those calculated for the Gaussian sources, yielding fm. Both the rqmd and the venus model are consistent with the data within the error in the correlation peak region.
Nuclear matter at high energy density has been extensively studied through high energy heavy ion collisions (for recent developments, see [1]). It is hoped that these collisions will create a deconfined state, the quark-gluon plasma. These studies have shown that nucleus-nucleus collisions are not mere superpositions of nucleon-nucleon collisions. In Pb+Pb central collisions at the CERN SPS, the nucleons are transported further into the midrapidity region than in S+S central collisions and p+p interactions [2, 3, 4, 5], consistent with the picture that the incoming nucleons in nucleus-nucleus collisions have undergone a significant number of scatterings. This results in a high rapidity density of net-baryons at midrapidity [2]. The spatial baryon density plays an important role in the dynamical evolution of heavy ion collisions [6]. An essential ingredient for establishing the spatial baryon density is the space-time extent of the baryon source at freezeout, which can be inferred from two-proton correlation functions [7, 8].
Two-proton correlations at low relative momentum are due to final state interactions (the attractive strong and the repulsive Coulomb interactions) and Fermi-Dirac quantum statistics [7, 8]. The correlation function is zero at and peaks at MeV/, where is the difference of the proton 4-momenta, and is the momentum magnitude of one proton in the rest frame of the pair. The peak height is inversely related to the space-time extent of the proton source [7, 8].
The space-time extent of the pion source has been studied extensively via two-pion interferometry in heavy ion collisions [9, 10, 11]. However, measurements of the space-time extent of the proton source are rare, especially for high energy nucleus-nucleus collisions [12]. In this letter, we report the first measurement of the two-proton correlation function in the midrapidity region from Pb+Pb central collisions at 158 AGeV, by the NA49 collaboration at the CERN SPS.
NA49 is a large acceptance hadron spectrometer [13]. The main detectors are four large time-projection chambers (TPCs). Two TPCs (VTPCs) are placed along the beam axis inside two dipole magnets, which have a maximum integrated field strength of 9 Tesla-meters. The other TPCs (MTPCs) are placed downstream of the magnets on either side of the beam axis. Behind the MTPCs are two time-of-flight (TOF) walls, covering smaller acceptance than the TPCs. A beam of 208Pb struck a Pb target of thickness 224 mg/cm2, placed in front of the first VTPC. A zero-degree calorimeter, located further downstream on the axis of the deflected beam, measures the kinetic energy of the projectile spectators. By requiring less than 6 TeV energy measured in the calorimeter, the 5% most central events were selected. These events correspond approximately to collisions with impact parameter fm.
Two independent analyses of the two-proton correlation function were carried out:
-
1.
analysis: Track segments reconstructed in the MTPCs were matched to track segments from at least one of the VTPCs. Particle momenta were determined by track curvature in the VTPCs. The particle identification was performed by measuring the specific ionization () deposited by a charged particle in the gas of the MTPC, measured in the region of the “relativistic rise”. The mean of a particle was estimated using the truncated mean technique [14]. A relative resolution of % was achieved in this analysis. Since the proton is approximately and below those of the kaons and the pions with the same momentum, protons cannot be uniquely identified. Instead, particles with at least 70% probability to be a proton were included in the analysis.
-
2.
TOF analysis: Only tracks reconstructed in the MTPCs were used. The momentum of a particle was determined by an iterative procedure in which the trajectory fitted to the measured points was projected upstream through the magnetic field, assuming that it originated at the primary interaction vertex. The particle identification was performed by combining the momentum measurement with the velocity information from the TOF walls and the from the MTPCs. The typical TOF resolution was measured to be 60 ps.
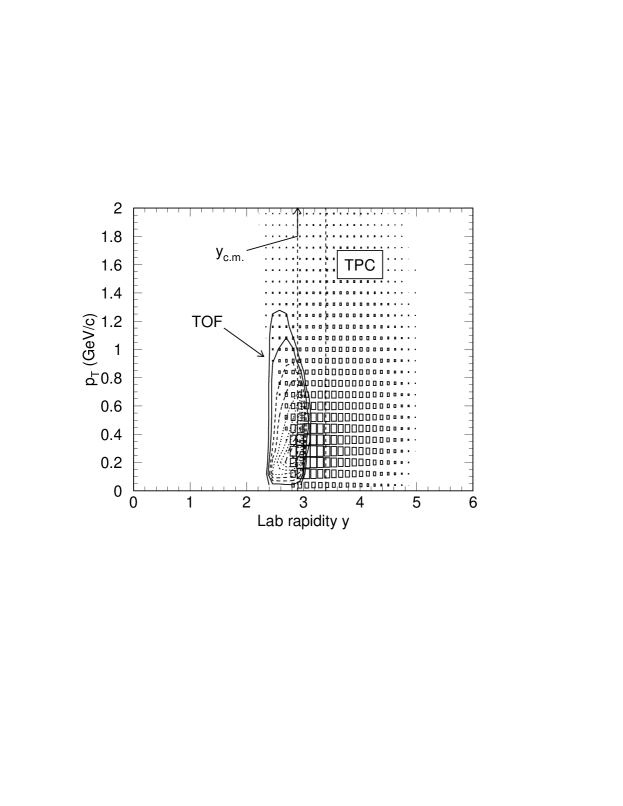
Fig. 1 shows the proton acceptances from the two analyses, which are in different hemispheres with respect to midrapidity (). The two-proton correlation function was analysed using protons from the rapidity range in the analysis, and in the TOF analysis. Both analyses used protons up to a transverse momentum GeV/.
The two-proton correlation function was calculated as the ratio of the distribution of true proton pairs to that of mixed-event pairs with protons taken from different events. The number of mixed-event pairs is large enough that the statistical error on the correlation function is dominated by the statistical uncertainty in the number of true pairs. To eliminate the effect of close pair reconstruction inefficiency, a cut of 2 cm was applied on the pair distance at the mid-plane of the MTPC for both true and mixed-event pairs [15].
The proton sample is contaminated by protons from weak decays ( including feeddowns, and ) which are incorrectly reconstructed as primary vertex tracks. From the measured single particle distributions [2, 16] as well as model calculations of rqmd and venus, we estimate the contamination to be (with weak dependence). This results in of the proton pairs having at least one proton from weak decays, which is assumed to have no correlation with the protons produced in the primary interaction [17]. Hence, protons from weak decays only reduce the correlation strength, without changing the shape of the two-proton correlation function at low . Additional contamination is present in the analysis from kaons on the lower tail of their distribution merging with the region where particles have at least 70% probability to be a proton. This results in 25% pairs and fewer than 2% pairs in the proton pair sample, independent of . pairs with MeV/ ( is the momentum of the or proton in the rest frame of the pair), which spans the region affected by Coulomb repulsion for the typical source created at midrapidity in Pb+Pb central collisions, affect the two-proton correlation function in the range MeV/. Only pairs with MeV/ contribute to the two-proton correlation function in the range MeV/. Therefore, the contamination in the proton pair sample shows no structure in below 160 MeV/, but reduces the correlation strength by 25%. The contribution from the pairs in the two-proton correlation function is negligible.
The correlation functions obtained from the two analyses can be directly compared because of the nearly symmetric acceptances used. The corrected correlation functions are consistent. In the results reported below, the corrected true pairs and the respective mixed-event pairs from the two analyses are combined. The combined sample has about pairs with MeV/, 75% of which are from the TOF analysis. The distributions of the true and the mixed-event pairs are shown in the top panel of Fig. 2. The number of mixed-event pairs is normalised to that of true pairs in the range MeV/. The resulting correlation function is shown in the lower panel of Fig. 2, and tabulated in Table I. The peak at MeV/ has amplitude . A statistically significant structure is seen in the correlation function at MeV/. The structure is present in both the and TOF data sets. See below for further discussion of the structure.

The correlation function was further corrected for the contamination from weak decay protons and the finite resolution. The former is corrected via . The momentum resolution is 0.25% at a momentum about 10 GeV/; the resolution is 2.5 MeV/ in the range MeV/ [15]. The effect of the resolution was studied using the rqmd and venus models, and was found to be significant only for the first two data points of the measured correlation function. The final corrected correlation function is plotted in Fig. 3 as filled points, and tabulated in Table I.
In order to assess the proton freeze-out conditions, we compare the measured two-proton correlation function to theoretical calculations. Given the proton phase space density distribution, the two-proton correlation function can be calculated by the Koonin-Pratt Formalism [7, 18]. The formalism uses the phase-shift method, which incorporates the Coulomb and the strong interactions between the protons. We use two types of proton freeze-out distributions:
(I) Gaussian sources of widths and for the space and time coordinates of protons in the source rest frame, and a Boltzmann distribution with temperature for the proton momentum distribution. No correlation between space-time and momentum is present. The following combinations of parameters are used: ; and ; MeV (as derived in [9]), 300 MeV (measured inverse slope of proton transverse mass spectrum [2]) and 70 MeV (inverse slope observed at low energy, as an extreme).
(II) Protons generated for Pb+Pb central collisions ( fm) at 158 AGeV by two microscopic transport models: the rqmd model (version 2.3) [19] and the venus model (version 4.12) [20]. Both models describe a variety of experimental data on single particle distributions reasonably well. Protons at freeze-out have correlations between space-time and momentum intrinsic to the dynamical evolution in the models. Neither model includes correlations due to quantum statistics and final state interactions. Particle weak decays are not included in the models.

Only protons in the experimental acceptance are used to calculate the two-proton correlation functions, the results of which are shown in Fig. 3. The correlation function for the Gaussian source with fm, fm and MeV, which describes well the experimental data, is also plotted.
We use /ndf, the normalised mean square of the point-to-point difference between the data and the calculation in the range MeV/ (i.e., 8 data points or ), to quantify how well the calculations agree with the data. We characterize the effective size of the model-generated proton source by , where and are the Gaussian widths fitted to the distributions in and , the distance between the protons of close pairs with MeV/. The distance is evaluated in the pair rest frame (since the correlation function is studied as a function of ) at the time when the later particle freezes out [21]. Repectively for rqmd and venus, the /ndf values are 1.53 and 1.38, corresponding to a probability of 20% and 14% that the model distributions are consistent with the data; the fitted Gaussian widths are ( fm and fm, where is the longitudinal coordinate; consequently the effective sizes are fm and fm.
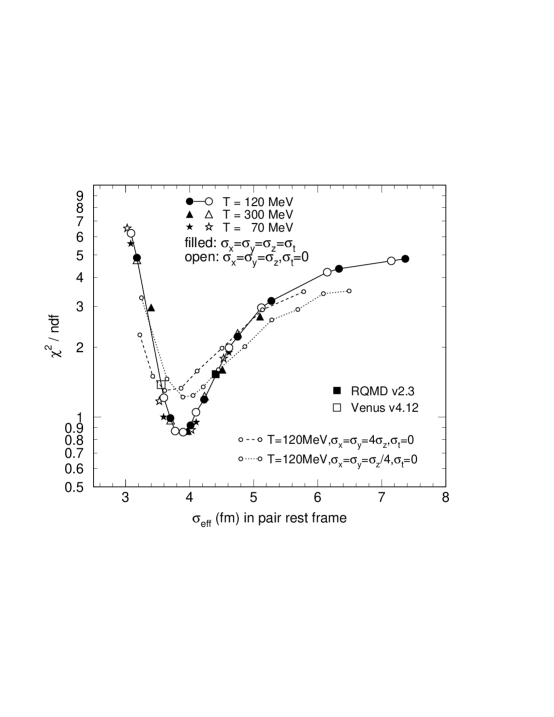
In Fig. 4, we study the /ndf as a function of . The /ndf values for all three models follow roughly the same solid curve, drawn through the points for the Gaussian sources with MeV to guide the eye [22]. From the minimum /ndf (=0.86) point and the points where /ndf has increased by 0.125 (note ), we extract fm, where 0.15 fm is the statistical error [23]. By applying a correction to the measured correlation function using a proton pair contamination of 28% and 58%, we obtain a systematic error of fm on . We note that fm corresponds to a uniform density hard sphere of radius fm, which is larger than the size of the colliding Pb nuclei.
We have also studied Gaussian sources with extreme shapes: oblate and prolate (both with ). The corresponding /ndf versus curves are shown in Fig. 4 as dashed and dotted lines, respectively. They do not fall along the curve for the isotropic Gaussian sources, implying that the two-proton correlation function has certain sensitivity to the shape of the proton source. The data do not favour the extreme Gaussian shapes. In principle, multi-dimensional two-proton correlation functions could reveal the shape of the proton source [7, 18]. However, this requires greater statistical precision than is available with the present data set.
By minimizing the /ndf between the correlation functions for the various Gaussian sources with respect to those for rqmd and venus, we can extract the effective proton source size for the models. The results are consistent with the calculated effective sizes from the models themselves.
We note that there is no simple relation between and the proton source in the models. From single proton distributions at freeze-out, we obtain the following Gaussian widths in the source rest frame: ( fm for rqmd and fm for venus, respectively. The two-proton correlation function, therefore, appears to measure a smaller region of the source due to space-time-momentum correlation. The effect is more dramatic in rqmd than in venus, which is consistent with the expectation that more secondary particle interactions in rqmd result in a stronger correlation between space-time and momentum of freeze-out protons. The fact that the /ndf values versus for the models lie on the curve obtained for the Gaussian sources, in which no space-time-momentum correlation is present, suggests that the effect of the space-time-momentum correlation is small in .
Now we come back to the structure observed at MeV/ in the correlation function. Many systematics have been checked, including (1) dependence, (2) stricter acceptance cut, (3) larger cut on two track distance, (4) varying cuts to allow different kaon contaminations in the TOF data set [17], (5) allowing only one particle from the same event in event mixing, (6) residual effect in single particle spectra due to two-particle correlation, (7) misreconstructed momenta for decay protons, and (8) reflection of strong interactions in two-proton correlation with one proton from decays [24]. None of the checked systematics can account for the structure. Nevertheless, if we assume that the structure has an oscillatory behavior, (where is a constant), and also contributes to the correlation peak region, then we estimate a systematic error of fm in the extracted , in addition to the fm estimated above.
It is, however, possible that the structure is due to underlying physics. For instance, such structure may result from a breakdown of the basic assumptions underlying the Koonin-Pratt Formalism [25]: the smoothness assumption [26], the independent emission assumption, and/or the independence of the two-proton source. A hard edge in the two-proton source distribution may also result in similar structures, however, it does not reproduce the observed sign and amplitude, unless the independent emission assumption is violated. See also the discussion in Ref. [25].
Finally, we comment on our two-proton correlation function in the context of other measurements. The pion source size measured by interferometry increases with the pion multiplicity [11], which increases steadily with bombarding energy in similar colliding systems [27]. Due to the large pion-nucleon cross-section, one would expect that protons and pions freeze-out under similar conditions, therefore, the proton source size would increase with bombarding energy as well. However, our measurement, in conjunction with preliminary results obtained at GSI [28] and AGS [29] energies, shows that the peak height is rather insensitive to the bombarding energy. This implies that the effective sizes of the freeze-out proton sources are similar in heavy ion collisions over a wide energy range.
In summary, NA49 has measured the two-proton correlation function at midrapidity from Pb+Pb central collisions at 158 AGeV. The peak height of the two-proton correlation function is after corrections. From comparison between the data and the calculations for static thermal Gaussian sources, we extract an effective proton source size fm. Within the error, the rqmd model ( fm) and the venus model ( fm) are consistent with the data. Due to the space-time-momentum correlation, the two-proton correlation function is sensitive only to a limited region of the proton source. Our measurement together with the measurements at lower energies suggest a very weak dependence of the two-proton correlation function on bombarding energy. The observed structure at MeV/ is not understood.
We thank Dr. H. Sorge, Dr. K. Werner, and Dr. S. Pratt for providing us the theoretical models. This work was supported by the Director, Office of Energy Research, Division of Nuclear Physics of the Office of High Energy and Nuclear Physics of the US Department of Energy under Contract DE-AC03-76SF00098, the US National Science Foundation, the Bundesministerium fur Bildung und Forschung, Germany, the Alexander von Humboldt Foundation, the UK Engineering and Physical Sciences Research Council, the Polish State Committee for Scientific Research (2 P03B 01912 and 9913), the Hungarian Scientific Research Foundation under contracts T14920 and T23790, the EC Marie Curie Foundation, the Polish-German Foundation, and the Czech Republic under Contract 202/98/1283.
REFERENCES
- [1] Nucl. Phys. A610 (1996), Quark Matter ’96 proceedings; Nucl. Phys. A638 (1998), Quark Matter ’97 proceedings.
- [2] H. Appelshäuser et al. (NA49 Coll.), Phys. Rev. Lett. 82 (1999) 2471.
- [3] I.G. Bearden et al. (NA44 Coll.), Phys. Lett. B388 (1996) 431.
- [4] T. Alber et al. (NA35 Coll.), Eur. Phys. J. C2 (1998) 643.
- [5] M. Aguilar-Benitez et al., Z. Phys. C50 (1991) 405.
- [6] P. Koch, J. Rafelski, and W. Greiner, Phys. Lett. B123 (1983) 151; K.S. Lee, M.J. Rhoades-Brown, and U. Heinz, Phys. Rev. C37 (1988) 1452.
- [7] S.E. Koonin, Phys. Lett. 70B (1977) 43.
- [8] R. Lednicky and V.L. Lyuboshits, Sov. J. Nucl. Phys. 35 (1982) 770; D.H. Boal, C. Gelbke, and B.K. Jennings, Rev. Mod. Phys. 62 (1990) 553.
- [9] H. Appelshäuser et al. (NA49 Coll.), Eur. Phys. J. C2 (1998) 661.
- [10] T. Alber et al. (NA35 Coll.), Z. Phys. C66 (1995) 77; H. Beker et al. (NA44 Coll.), Phys. Rev. Lett. 74 (1995) 3340; T. Abbott et al. (E802 Coll.), Phys. Rev. Lett. 69 (1992) 1030; J. Barrette et al. (E877 Coll.), Phys. Rev. Lett. 78 (1997) 2916.
- [11] K. Kaimi et al. (NA44 Coll.), Z. Phys. C75 (1997) 619; I.G. Bearden et al. (NA44 Coll.), Phys. Rev. C58 (1998) 1656; M.D. Baker (E802 Coll.), Nucl. Phys. A610 (1996) 213c.
- [12] F. Zarbakhsh et al., Phys. Rev. Lett. 46 (1981) 1268; H.A. Gustafsson et al., Phys. Rev. Lett. 53 (1984) 544; R. Kotte et al. (FOPI Coll.), Z. Phys. A359 (1997) 47.
- [13] S. Wenig (NA49 Coll.), NIM A409 (1998) 100; S. Afanasiev et al. (NA49 Coll.), NIM A430 (1999) 210.
- [14] W. Blum and L. Rolandi. Particle Detection with Drift Chambers. Springer Verlag, 1994; B. Lasiuk (NA49 Coll.), NIM A409 (1998) 402.
- [15] H. Appelshäuser, PhD thesis, Frankfurt, 1997; S. Schönfelder, PhD thesis, MPI Munich, 1997, MPI-PhE/97-09.
- [16] C. Bormann et al. (NA49 Coll.), J. Phys. G23 (1997) 1817.
- [17] M. Cristinziani, Diploma thesis, Marburg University, 1997.
- [18] S. Pratt and M.B. Tsang, Phys. Rev. C36 (1987) 2390; S. Pratt et al., Nucl. Phys. A566 (1994), 103c.
- [19] H. Sorge, H. Stocker, and W. Greiner, Ann. Phys. 192 (1989) 266; H. Sorge et al., Phys. Lett. B 289 (1992) 6; H. Sorge, H. Stöcker, and W. Greiner, Nucl. Phys. A498 (1989) 567c; H. Sorge, Phys. Rev. C52 (1995) 3291.
- [20] K. Werner, Phys. Rep. 232 (1993) 87.
- [21] For a chaotic Gaussian source, is close to the non-relativistic approximation of the effective size in the source rest frame, , where is the one-dimensional mean squared velocity of the thermal protons, and is that of the close pairs.
- [22] The shape of the versus curves can be understood as follows: the /ndf approaches an asymptotic value for large sources to which the two-proton correlation function is not sensitive to the source size, whereas for small sources, the two-proton correlation function is very sensitive and its strength decreases rapidly with increasing source size.
- [23] Particle Data Group, Eur. Phys. J. C3 (1998) 168–177.
- [24] F. Wang, Phys. Rev. C in print, nucl-th/9907032 (1999).
- [25] D. Brown, F. Wang, and P. Danielewicz, nucl-th/9908033 (1999).
- [26] S. Pratt, Phys. Rev. C56 (1997) 1095.
- [27] M. Gazdzicki and D. Roehrich, Z. Phys. C65 (1995) 215.
- [28] C. Schwarz (ALADIN Coll.), nucl-ex/9704001 (1997); R. Fritz (ALADIN Coll.), nucl-ex/9704002 (1997).
- [29] S. Panitkin et al. (E895 Coll.), nucl-ex/9905003 (1999).
| 4.8 | ||
|---|---|---|
| 9.7 | ||
| 15.4 | ||
| 21.3 | ||
| 27.2 | ||
| 33.2 | ||
| 39.1 | ||
| 45.1 | ||
| 51.1 | ||
| 57.1 | ||
| 63.1 | ||
| 69.1 | ||
| 75.1 | ||
| 81.1 | ||
| 87.1 | ||
| 93.0 | ||
| 99.0 | ||
| 105.0 | ||
| 111.0 | ||
| 117.0 |