Centrality Dependence of Kaon Yields in Si+A and Au+Au Collisions at Relativistic Energies
Abstract
Charged kaon production has been measured in Si+Al and Si+Au collisions at 14.6 GeV/, and Au+Au collisions at 11.1 GeV/ by Experiments 859 and 866 (the E–802 Collaboration) at the BNL AGS. Invariant transverse mass spectra and rapidity distributions for both and are presented. The centrality dependence of rapidity-integrated kaon yields is studied. Strangeness enhancement is observed as an increase in the slope of the kaon yield with the total number of participants as well as the yield per participant. The enhancement starts with peripheral Si+Al and Si+Au collisions (relative to N+N) and appears to saturate for a moderate number of participating nucleons in Si+Au collisions. It is also observed to increase slowly with centrality in Au+Au collisions, to a level in the most central Au+Au collisions that is greater than that found in central Si+A collisions. The enhancement factor for production are and , respectively, for the most central 7% Si+Au collisions and the most central 4% Au+Au collisions relative to N+N at the correponding beam energy.
pacs:
PACS number(s): 25.75.-qI Introduction
Strange particle production has long been considered as a useful experimental probe of heavy-ion collisions because strange particle yields are thought to be sensitive to physics resulting from the high baryon densities attained in heavy-ion collisions at AGS energies [1]. In particular, quark-gluon plasma formation is expected to result in enhanced strangeness production [2, 3, 4, 5, 6]. Such an enhancement was observed by BNL Experiment 802 in Si-induced collisions as an increase in the yield in central collisions relative to the pion yield [7, 8]. However, secondary interactions among hadrons have been proposed to explain the observed strangeness enhancement, and cascade models implementing these secondary interactions can approximately reproduce the kaon yields measured in Si+A collisions [9, 10, 11, 12]. Because there are, in principle, many mechanisms that can increase the yield of strange particles in heavy-ion collisions, the process(es) responsible for the observed strangeness enhancement have not experimentally been clearly identified. However, with the present high statistics Si+A and Au+Au data, the systematics of strangeness production can now be studied as a function of the system size from very small systems to very large systems, thus, providing more stringent constraints on theoretical explanations of strangeness enhancement.
In this paper, semi-inclusive and spectra measured by E–859 in Si+Al and Si+Au collisions at 14.6 GeV/ and by E–866 in Au+Au collisions at 11.1 GeV/ at the BNL AGS are presented. Both the Si+A and Au+Au measurements were made by the E–802 collaboration using the Henry Higgins spectrometer [13]. Previous measurements of kaon production in Si+A collisions have been presented by E–802 [7, 8, 14]. Kaon data from Au+Au collisions at slightly higher beam energy are presented by E–866 in [15].
This paper is organized in the following way. First, descriptions of the experimental apparatus and data collection are given in section II. Then, the data analysis is described in section III. Results on kaon spectra are described in section IV, followed by discussions on the centrality dependence of the kaon production rates in section V. Finally, conclusions are drawn in section VI.
II Experimental Apparatus and Data Collection
E–859 was an upgraded experiment from E–802 at the BNL AGS. The upgrade consisted of an addition of two multi-wire proportional chambers for triggering purpose to the E–802 spectrometer [13] between the Henry Higgins dipole magnet and the time-of-flight wall, and an implementation of a level-2 trigger [16]. The level-2 trigger linked hits from one of the trigger chambers and the time-of-flight wall by straight lines to be verified on the other trigger chamber. Verified combinations were assumed to originate at the target and particle momenta were obtained. Particle masses were then obtained from the momenta and the time-of-flight, and were used for event selection. Event selection was achieved on-line by looking up a series of tables pre-loaded in LeCroy CAMAC modules. For most of the data presented here, the level-2 trigger rejected events not containing a , , or . and (or ) were defined as particles for which the calculated masses fall in the range of 0.3 0.7 GeV/ and 0.3 1.5 GeV/ , respectively. Events were also taken with an override on the level-2 trigger decision to check biases in the level-2 trigger selection criteria.
E–866 was an upgraded experiment from E–859 designed for measurements of the Au+Au collisions. The main upgrade was the addition of a spectrometer for forward angle measurements [1, 17, 18]. The upgrade relevant to this paper included rebuilding the global detectors for event characterization, replacing the drift chamber closest to the target, and an addition of two highly segmented multi-wire chambers [15, 17, 19] in front of the Henry Higgins magnet. The addition of the wire chambers was driven by the expected high multiplicity of central Au+Au events and the need to eliminate background tracks. Both wire chambers had drift-time read-out. Typical resolution of 200 was achieved for both chambers.
The E–859 data were taken during the 1991 and 1992 Si-beam runs at the AGS, and were an improvement over the original E–802 data mainly due to increased statistics afforded by the level-2 trigger and the improved acceptance at low momentum. The data were obtained using a beam of nominal intensity with Al and Au targets of thickness 817 and 944 , corresponding to a 3% and an 1% Si interaction rate, respectively. The data were obtained using 10∘ steps in spectrometer angle covering the range 5–58∘ and using fields of KG in the spectrometer magnet [20, 21].
The E–866 data were taken during the Fall 1993 Au-beam run at the AGS. The typical beam intensity was . For the data presented in this paper, a 975 thick Au target was used, corresponding to a 1.5% Au interaction rate. The data were obtained using 5∘ steps in spectrometer angle covering the range 21–58∘ and using fields of KG in the spectrometer magnet.
Both data sets were obtained using a global level-1 trigger that selected interactions by vetoing on the presence of a beam-charge ion in the Bull’s-eye trigger [13, 22] downstream of the target, with the additional requirement in the spectrometer of at least one hit on the time-of-flight wall and a hit on either of the two trigger chambers. A plastic scintillator was used in the Bull’s-eye for the Si+A data taking with a threshold, corresponding to a cut on the remaining charge in the projectile of approximately . For the Au+Au data taking, the Bull’s-eye was re-designed and rebuilt as a erenkov radiator. The new Bull’s-eye had roughly the same geometrical area as the old one, and used quartz as its radiator. A Bull’s-eye threshold, corresponding to a cut on the remaining charge in the projectile of approximately , was used. The cross-section for events satisfying this cut was measured to be 5.35 barn. (The total cross-section of Au+Au reaction is 6.8 barn [15, 23].) Further filtering of data was performed by the level-2 trigger, when enabled, to enhance the sample of particular particle species in the data as discussed above.
III Data Analysis
In the offline analysis, cuts were applied to the beam counter and Bull’s-eye data to remove pile-up and to refine the online Bull’s-eye cut. The refined Bull’s-eye cut corresponded to a remaining charge of in the projectile for the Si+A data, and in the projectile for the Au+Au data, respectively. The cross-section for events passing this cut was 1.37 barn for Si+Al, 3.68 barn for Si+Au, and 5.23 barn for Au+Au. For all events satisfying the pile-up and Bull’s-eye cuts, tracks were reconstructed and identified in the spectrometer. For the Si+A data, track segments were reconstructed from hits in the drift chambers behind the magnet, and projected through the magnetic field to the front of the spectrometer. The projections were verified by hits in the front drift chambers which were refit to give final track parameters. For the Au+Au data, the track reconstruction behind the magnet was done as for Si+A, and an independent track reconstruction was performed in front of the magnet [19]. The front track reconstruction used the highly segmented wire chambers to define narrow regions (on order of a few wire pitches, or 1 ) for track candidates. Front drift chamber hits found in these regions were then used, together with the wire chamber hits with drift time information included, to obtain track segments in the front. The track segments in the front and in the back were then matched through the magnetic field. A large fraction of background tracks did not have both the front and the back segments, therefore the matching algorithm effectively rejected background tracks. Good tracks were required to project within 2 around the nominal target position, further reducing background tracks.
The Au+Au particle identification was performed using data from the time-of-flight wall, since the spectrometer was operated at larger angles where particle momenta are typically small. A particle was identified as a kaon if its measured inverse velocity, , was within of the expected value and over away from the expected values of other particle types. The expected values for various particle types were calculated from the time of flight, track path length up to the time-of-flight wall, and the corresponding particle masses. The typical track path length up to the time-of-flight wall was 660 . The was a combination of time-of-flight resolution and deviation of track trajectory from straight line due to multiple scattering. The time-of-flight resolution was measured to be 130 ps. Hence, kaons were identified up to a momentum of 1.74 GeV/. For the Si+A data both the time-of-flight wall and the segmented erenkov counters [13] were used for particle identification. The time-of-flight resolution was measured to be 120 ps for these data. Kaons were identified up to a momentum of 3 GeV/c. For both data sets, the contamination of the and samples was found to be below 1% and 3%, respectively, averaged over the spectrometer acceptance [19].
In order to study the centrality dependence of kaon production, the data were divided into bins in centrality. For the Si+A data the centrality selection was made using the E–859 Target Multiplicity Array (TMA), and for the Au+Au data the selection was made using the zero-degree calorimeter (ZCAL). The Si+A cuts were made in multiplicity because of a rate-dependent worsening of the zero-degree calorimeter resolution during the high beam intensity E–859 run [21]. The zero-degree calorimeter data was used to determine the correlation between multiplicity and zero-degree energy, , calculated for events in each multiplicity bin. The results are shown in Table I. The centrality cuts applied to the data-sets are also listed in Table I along with the cross-sections for interactions satisfying the cuts.
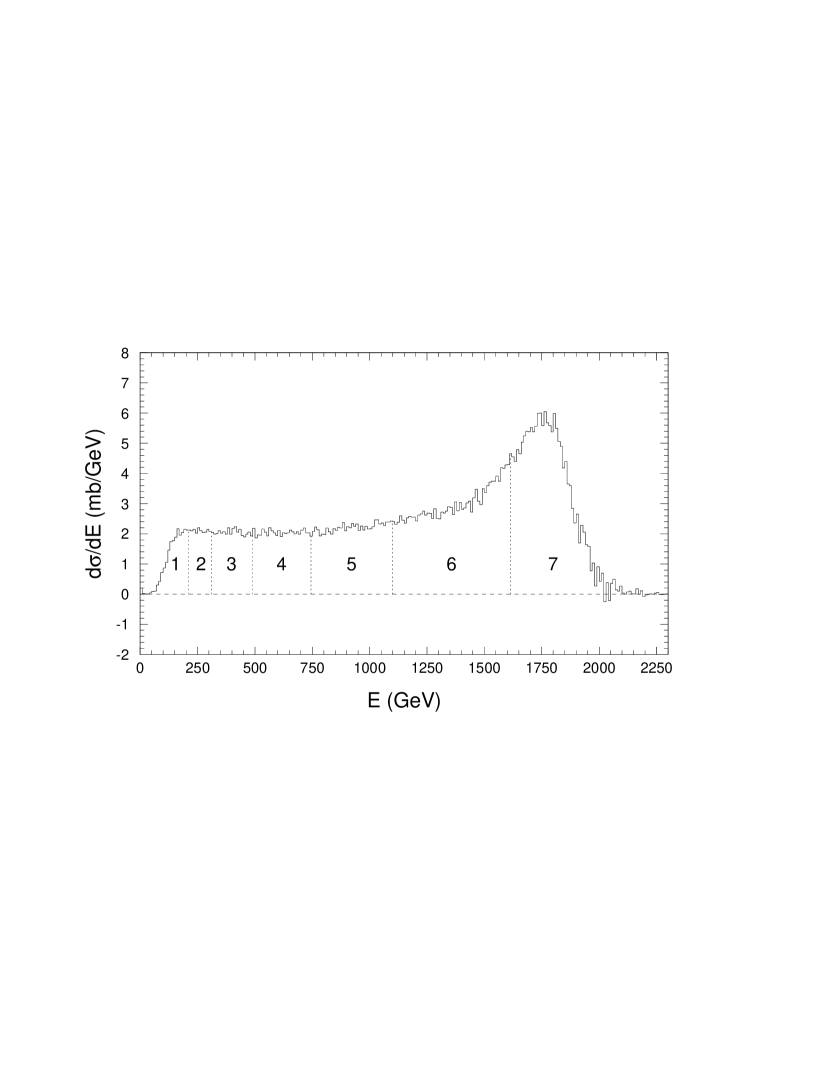
Due to the large amount of radiation damage from the high beam intensity run in E–859, the zero-degree calorimeter was rebuilt for the Au+Au run. In the Au+Au analysis, the zero-degree energy was calibrated run-by-run to account for a gradual degradation in the calorimeter response due to radiation damage [19]. The total degradation over the whole run period was 5%. The zero-degree energy resolution was measured to be 1.48 GeV. The calibrated and target-out subtracted zero-degree energy spectrum for Au+Au events is shown in Fig. 1. The target-out zero-degree energy was shifted slightly lower to compensate for the average energy loss of the beam in the target prior to subtraction. The target-out interaction rate was 1.1% for Au+Au and 1.0% for Si+A. Also shown in Fig. 1 as the dotted lines are the centrality cuts used for the Au+Au data. The mean zero-degree energy for each bin are determined from the distribution and results are shown in Table I.
Total number of identified ’s and ’s, after all cuts, were 120K and 44K for Si+Al, 151K and 69K for Si+Au, and 28K and 11K for Au+Au. The statistics were uniformly distributed in available centrality bins. To obtain semi-inclusive spectra, ’s and ’s from events satisfying each centrality cut were binned in transverse momentum , and rapidity , where is the longitudinal velocity of the particle. Invariant differential yields, azimuthally averaged, per collision within a given centrality bin, were obtained according to the formula,
| (1) | |||||
| (2) |
where is the number of events that fell within the given centrality bin; the transverse mass, , is defined as ; , are bin sizes in , , respectively; is the number of kaons in the bin; and is the correction factor. For the Au+Au data, MeV/ for both and ; for ; for in all bins except the most peripheral where . The binning is comparable to that used in the Si+A data set. Only particles with momentum 0.3 1.74 GeV/ were used in the spectra. The correction factor, , accounted for the azimuthal acceptance of the spectrometer, particle decays, multiple-scattering and hadronic interaction losses, track reconstruction and particle identification inefficiency [19]. The spectrometer acceptance was calculated from the geometry of the detectors. Other effects were determined by Monte Carlo simulations. The particle decay correction for kaons was found to be roughly the same as the theoretical momentum-dependent correction because very few kaons that decayed before the time-of-flight wall were actually reconstructed. Track reconstruction efficiency depended on hit multiplicity in the chambers, and was 98% with the spectrometer at 44∘, dropping to 95% at 21∘ for the Au+Au data [24]. For the Si+Au data, it was above 90% with the spectrometer at 5∘ and was better at larger spectrometer angle settings. For the Si+Al data, it was better than that for the Si+Au data at the same spectrometer angle settings. Track loss due to hadronic interaction for was 1.1%, independent of momentum; for it was 2.2% at high momentum ( GeV/) and increased to 10% at momentum 0.3 GeV/. Track losses due to multiple scattering and particle identification inefficiency were combined. The net effect was the same for and , and was 4.5% for high momentum kaons ( GeV/), and increased to 8.3% at momentum 0.6 GeV/, and 38% at momentum 0.3 GeV/. The level-2 trigger inefficiency was measured to be less than 1%, and no correction was applied to the spectra. Chamber efficiencies were above 95% for all sense wire planes in the chambers. Since not all sense wire planes were required for reconstructed tracks, the effect of hardware inefficiencies was negligible [19]. The overall systematic error is estimated at 5%-10%.
For the Au+Au data, the spectra are corrected for the energy loss of particles in the target and in air. The energy loss in the target was calculated on average using half thickness of the target and the particle emitting angle. The energy loss of minimum ionizing particles was about 2 MeV. The energy loss of a 0.3 GeV/ momentum kaon was 7.5 MeV, corresponding to a momentum shift of 5%.
IV Results
Sample sets of kaon transverse mass spectra from Si+Au and Au+Au collisions, each for the most central bin, are shown in Fig. 2 and Fig. 3, respectively. All semi-inclusive invariant spectra including those shown in the figures are well described by an exponential fall-off with . These spectra are fit to the form
| (3) |
which implicitly integrates the spectra over the entire range, and allows the values and the corresponding errors to be directly extracted from the fit. Results of these fits are superimposed on the spectra in Fig. 2 and Fig. 3 as dotted lines. The obtained values for Si+Au collisions for all four bins in multiplicity measured in the TMA are plotted in Fig. 4. For Au+Au collisions, for clarity, only four of the available seven bins in zero-degree energy are shown. The error bars include statistical errors from the fits and 5% bin-to-bin systematic errors. The systematic errors were estimated by comparing yields in the overlap region between spectrometer settings and by studying the sensitivity of the spectra to the intervals used in the fits. In addition, there was 10% overall systematic error in normalization.
For the purposes of this analysis, rapidity integrated yields were chosen to characterize the kaon production rates. The Si+A spectra, were fit to Gaussians and integrated to get the total kaon yields. The restricted rapidity coverage of the Au+Au data can be compensated for by exploiting the required symmetry of the Au+Au system about the nucleon-nucleon center of mass rapidity (). If we assume that the Au+Au kaon spectra are well-behaved at mid-rapidity (as they are in [15]), then the data are sufficient to obtain an estimate of the total kaon yield for collisions in each centrality bin.
The Gaussian fits which account for the unmeasured tails of the rapidity distributions for both data sets are shown in Fig. 4 as dotted curves, and were integrated over all rapidity to estimate the total kaon yields, the results of which are summarized in Table I. The quoted errors on the kaon yields and Gaussian ’s are statistical only. Systematic errors on the Si+A yields were estimated to be 10%. Comparisons with data from the E–866 forward spectrometer[15, 18] indicate that the assumption regarding the shape of the Au+Au kaon spectra at mid-rapidity is reasonable, leading to an estimate that the extrapolation to mid-rapidity introduces a few percent uncertainty into the present Au+Au total yields. The fractions of the estimated total and yields in the extrapolated tails are typically 30% and 20%, respectively. The systematic error on the extracted total kaon yields in Au+Au is estimated to be of order 10% by comparing the extracted yields to alternative fits that have different shapes for the tails of the distributions. Using the sum of the measured instead of the estimated total yields for Au+Au collisions does not alter the dependence of the yield on collision centrality except for a scale factor. In order from most peripheral to most central collision, the sum of the measured in rapidity range 0.5–1.3 are 0.29, 1.08, 2.37, 3.56, 4.54, 5.38 and 6.05; the sum of the measured in rapidity range 0.4–1.4 are 0.076, 0.23, 0.52, 0.74, 0.94, 1.09 and 1.28.
For Au+Au collisions, the integrated yields from the present data have been compared with those described in [15] taken at a slightly higher beam energy (11.6 AGeV/c). The and yields of the two measurements were compared at the 5 centrality cuts from [15]. The ratios of the yield at the higher energy to that found in the present work are and for and , respectively, where the quoted errors are statistical only. From a parameterized fit to p+p data [25], the expected ratios are 1.06 and 1.12 for and , respectively. The differences between the two data sets, when corrected for the difference in beam energy, are well within the estimated overall systematic error of 10% in the measurements. The results from the 11.1 GeV/ beam energy were used in the present study because this set contained higher quality data for kaon production in peripheral collisions.
V Discussion
In order to discuss the centrality dependence of the kaon yields, it would be desirable to plot these yields against a more intuitive variable than the zero-degree energy or multiplicity. In the Wounded Nucleon Model, the particle yields in heavy-ion collisions are expected to increase roughly in proportion to the number of projectile and/or total participants (participating nucleons) [26, 27]. Results from previous Si+A measurements [8] suggest that kaon yields within a limited fixed rapidity window increase faster than linearly with the number of projectile participants for Si+Cu and Si+Au, but not for Si+Al collisions. However, this procedure treats the target and projectile nucleons very differently for asymmetric collision systems. Consequently, for this work we have chosen to use , the total number of participants to characterize collision centrality.
The energy measured in the zero-degree calorimeter results predominantly from projectile spectators, so the average number of projectile participants for a given average zero-degree energy can be estimated using the formula
| (4) |
where is taken as the average zero-degree energy in the centrality bin, is the number of nucleons in the projectile (28 for Si and 197 for Au), and is the total kinetic energy of the beam, 383.4 GeV for Si beam and 2000 GeV for Au beam [28], respectively. For the symmetric Au+Au and nearly symmetric Si+Al collisions, the total number of participants is, on average, simply twice the number of projectile participants. For Si+Au collisions, the total number of participants has been estimated by using nuclear geometry with Wood-Saxon density distribution and the Glauber model to relate the average number of projectile participants, , to the average number of total participants, , in each centrality bin. Results of this calculation are consistent with those obtained in previous analyses [14, 29]. The estimated total number of participants for the centrality bins of the three systems are listed in Table I. The statistical errors on are negligible due to the large number of minimum bias interaction triggers that were accumulated for each of the three systems. The systematic errors on for the Si+A data were estimated to be 10% by using two independent analyses [8, 21]. For the Au+Au data the systematic errors on were estimated to be 8% [19]. The target-out interaction rate was subtracted from the ZCAL distribution before was calculated adding negligibly to the estimate of the overall systematic error. The correlation between the ZCAL energy and another measure of centrality, the transverse energy, has been analyzed by the E802 Collaboration and is discussed in Refs. [29, 30, 31].
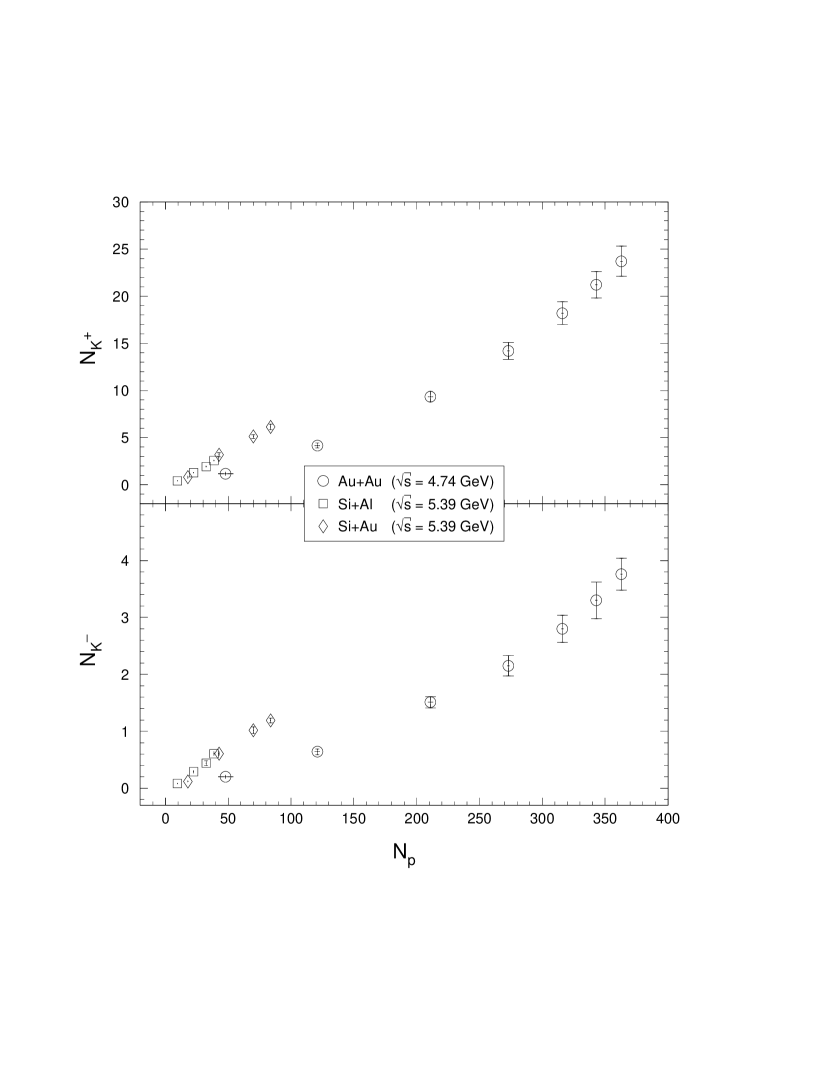
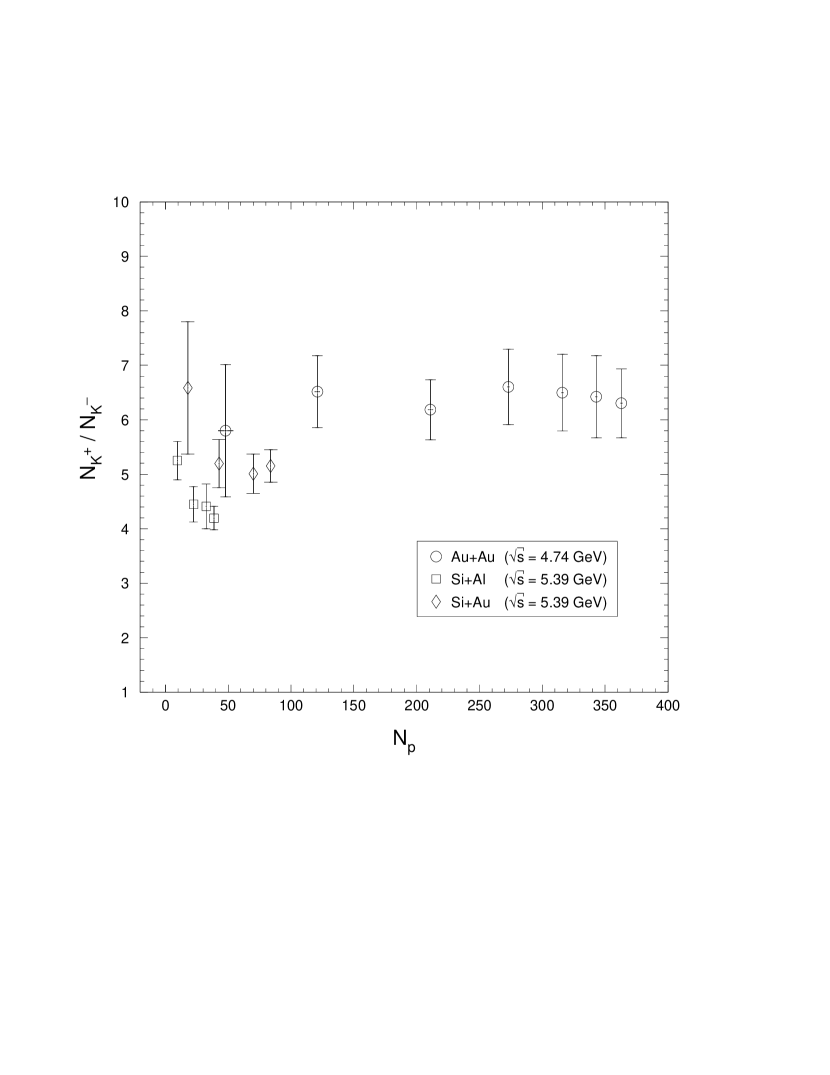
The total and yields from Si+Al, Si+Au and Au+Au collisions are plotted in Fig. 5 as a function of . One immediate striking feature of this plot is that the measured kaon yields from Si+A and Au+Au collisions have very different dependence on . The kaon yields from Si+A increase approximately linearly with with data from the two targets following approximately the same line. The kaon yields from Au+Au collisions, in contrast to those from Si+A, increase faster than linearly with as can be clearly seen in Fig. 5. On the other hand, in each of the three systems, the and yields have the same dependence on , differing by only a constant scale factor. This is illustrated in Fig. 6 where the ratios of to yield are plotted against . The ratios show a rather weak dependence on , and are systematically different for different systems. (Note that Si+Al and Si+Au are at the same beam energy, and Au+Au is at a lower beam energy.) The similarity between and is surprising given that their production is expected to proceed through very different mechanisms, resulting in different shapes. For all three systems discussed, the distributions are systematically narrower than the ’s, as seen from Table I.
It is of interest to examine the power-law behavior of the kaon yield versus : . Fits to the Au+Au data yield the results and , respectively, for and . The power factors for and are essentially same, consistent with the constant to ratio, and are considerably larger than 1.
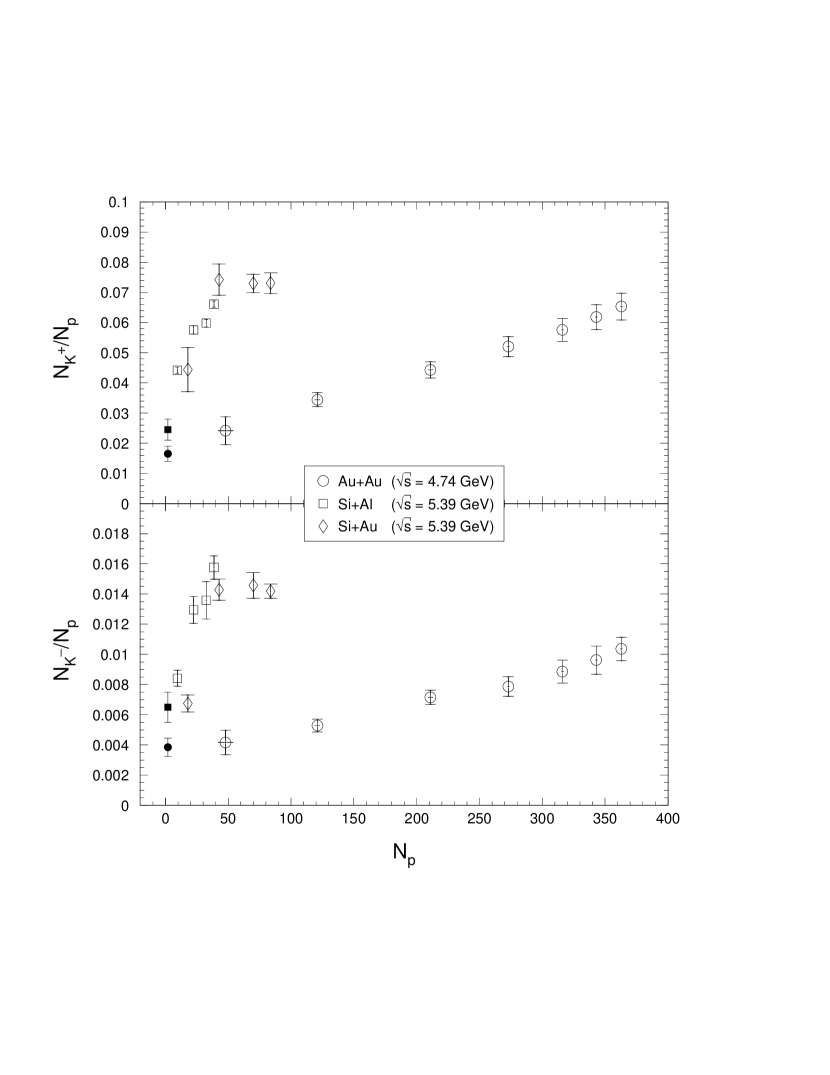
Although the Au+Au kaon yields increase faster than linearly with , the absolute yields fall significantly below the Si+A yields for the same number of participants (), which is further shown in Fig. 7 where the kaon yield per participant is plotted against . In order to compare these two data sets, the difference in beam energy for the two projectiles must be taken into account. (The nucleon pair center of mass energy is 5.39 GeV for Si+A, and 4.74 GeV for Au+Au). The energy dependence of kaon production in heavy ion collisions is unknown; data from elementary collisions are used to estimate the effect. and yields in p+p collision at 12 GeV/ were measured [32] to be 0.048 and 0.0075, respectively. Based on a parameterization of p+p data at various energies [25], and yields in p+p should be scaled, respectively, by 1.27 and 1.53 from beam momentum 12 GeV/ to 14.6 GeV/, and by 0.90 and 0.82 from beam momentum 12 GeV/ to 11.1 GeV/. Therefore, and yields in p+p at 14.6 GeV/ can be estimated as 0.061 and 0.011, and at 11.1 GeV/ can be estimated as 0.043 and 0.0062. (Typical errors on these yields are 15%.) Since there are significant differences in kaon production in p+p, p+n and n+n interactions [33], the iso-spin averaged kaon yields should be used. Using the method described in [33] and data measured in p+p at 12 GeV/ [32, 34], the ratios of cross sections for producing in these three elementary interactions can be estimated as p+p : p+n : n+n = 1 : 0.81 : 0.62, and those for producing can be estimated as p+p : p+n : n+n = 1 : 1.19 : 1.42. (See appendix of [15] for details.) Assuming that these ratios do not vary with beam momentum between 11.1 GeV/ and 14.6 GeV/, and assuming that the heavy-ion collisions are simple superpositions of nucleon-nucleon (N+N) collisions at the full beam energy, the and yields per N+N interaction can be estimated, respectively, as 0.049 and 0.013 for Si+A [35] at 14.6 GeV/ and 0.033 and 0.0077 for Au+Au at 11.1 GeV/c. The typical errors of these estimates are on the order of 15%. These results are shown in Fig. 7 at as the filled square for the Si beam energy and the filled circle for the Au beam energy. Based on these results, the Si+A and yields should be approximately 40% and 90% larger than the Au+Au data if the heavy-ion collisions were simple superpositions of N+N collisions at appropriate beam energy. However, even after compensating for the energy difference the Si+A yields are still systematically 100% larger than the Au+Au yields for the same .
The above observed differences among the three systems could come from the different initial nuclear geometry. At the same , the initial geometry of the three systems is by no means the same. For the same at which the Au+Au collision is peripheral, whereas the Si+A collisions are not, the overlap region in Au+Au collision is less dense than that in Si+Al or Si+Au collision due to the dilute surfaces of the nuclei. Therefore, one would naively expect lower kaon yield in Au+Au than in Si+A collisions at same beam energy, due to fewer successive N+N collisions per participant in Au+Au than in Si+A collisions. However, detailed study of the average number of successive N+N collisions per participant, based on the Glauber model and the inelastic N+N cross-section 30 mb, does not give quantitative support to this supposition.
For both Si+Al and Au+Au collisions of all centralities, and for peripheral Si+Au collisions, the kaon yields per participant increase with , as seen from Fig. 7. In non-peripheral Si+Au collisions, however, the kaon yield per participant saturates at the value observed in the most central Si+Al data. The saturation cannot be explained by the simple nuclear geometry either, as the average number of successive N+N collisions per participant, calculated from the Glauber model, continues to increase with in the range of the saturation.
Presumably, the kaon yield in very peripheral heavy ion collisions should behave just like in N+N. As shown in Fig. 7, extrapolations following the trends of the and yields in both Si+A and Au+Au collisions are consistent with the N+N values.
Another way to characterize the dependence of kaon production with centrality is shown in Fig. 8. Instead of the average yield per participant displayed in Fig. 7, this figure shows the differential rate of kaon production with increasing , i.e. the slopes extracted from the data in Fig. 5. Values were extracted separately for each of the three systems. For the Si data, slopes were found using pairs of adjacent points, while for Au+Au data, slopes were obtained from straight-line fits to three data points in a row in order to reduce the statistical uncertainties. The lowest point in this figure was found by combining the lowest data point in Fig. 5 with an assumed point of zero yield at zero . These results are plotted in Fig. 8 at the corresponding average values. The shaded area shown on each plot indicates the range of the slope extracted from a straight line fit to the Si+Al data, the Si+Au data, or the Si data including both targets shown in Fig. 5. The kaon yields per participant in N+N interactions are plotted at as filled points, the same as in Fig. 7. For the Si-induced interactions, the differential rate of kaon production rises rapidly and then stays roughly constant at a value considerably larger than expected from N+N. For Au+Au, the slope increases more slowly but continuously, and eventually reaches the value found for central Si+A. In other words, for the same increase in , the increase in kaon yield in central Au+Au is the same as in central Si+A, in spite of the lower energy of the Au beam than the Si beam.
Care should be taken in interpreting these results as demonstrating that each additional participant produces significantly more kaons. Increasing corresponds to decreasing impact parameter. In a simple geometric model, this implies that all participants have an increasing probability of multiple collisions. Also, other effects such as rescattering of baryons and mesons or the influence of the nuclear medium will be stronger in more central collisions. Fig. 7 demonstrates how kaon production averaged over all participants evolves as a function of centrality while Fig. 8 shows the evolution of the differential rate of production.
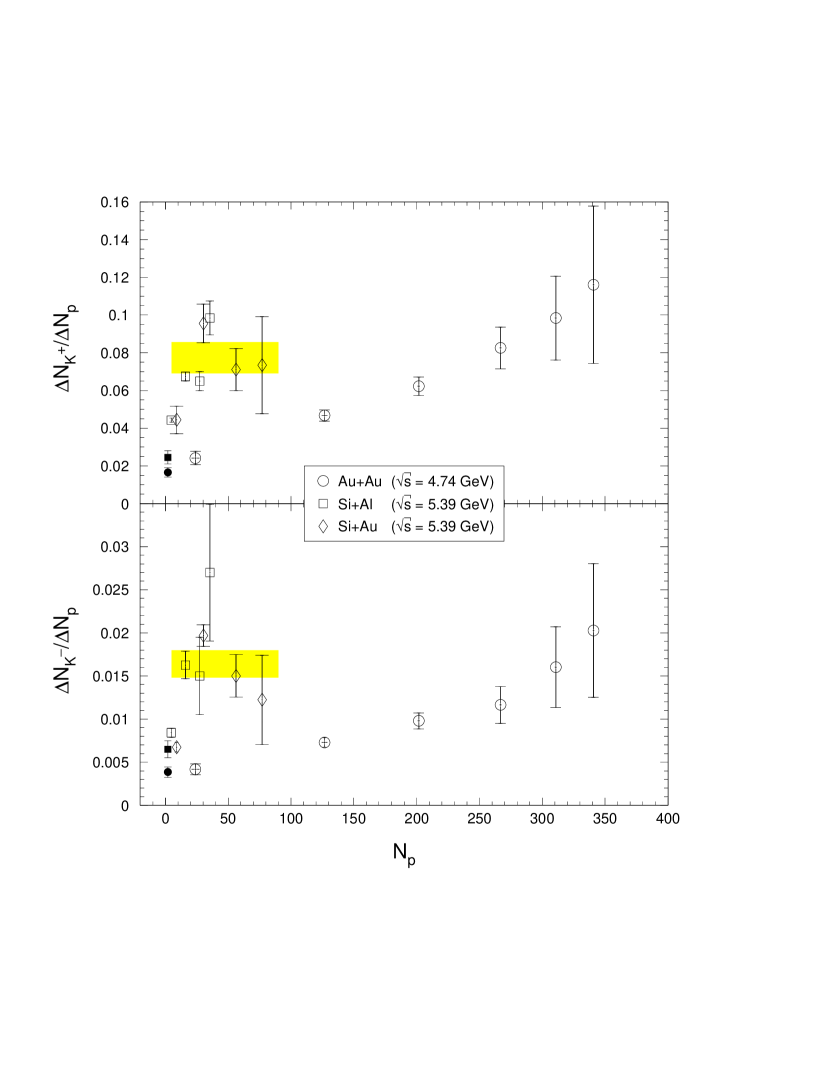
To investigate enhancement of strangeness production in heavy ion collisions relative to N+N, the heavy ion data in Fig. 7 are normalized by the N+N values and re-plotted in Fig. 9. The filled circle at (2,1) in each plot represent the N+N interactions. The yields in central Si+A collisions are 3 times those in N+N, a result that is consistent with the previously observed strangeness enhancement in Si+A collisions[7]. The normalized and yields per participant in central Au+Au collisions reach higher values than in central Si+A collisions. The and yields are enhanced by factors of and , respectively, in the most central bin of the Au+Au data relative to N+N. The enhancement factors are only and in central Si+Au collision for and , respectively. The systematic errors include those in the yields and in . Errors in the estimated kaon yields from N+N, common to all three systems, are not included in the systematic errors above. The strangeness enhancement, therefore, is more pronounced in central Au+Au at 11.1 GeV/ than in central Si+Au at 14.6 GeV/. Note that for each of the three systems, there is more enhancement in than in .
VI Conclusions
In summary, E–859 and E–866 have measured kaon production as a function of centrality in Si+Al and Si+Au collisions at 14.6 GeV/ in rapidity range , and in Au+Au collisions at 11.1 GeV/ in rapidity range . In all three systems with all centralities, the invariant transverse mass () spectra can be described by a single exponential in for both and ; the rapidity distributions can be characterized by Gaussians, with the distributions consistently broader than the ’s.
The kaon yields in Si+A and Au+Au collisions were found to have different dependencies on the total number of participants. The kaon yields from Si+A collisions increase approximately linearly with the total number of participants, whereas the kaon yields from Au+Au collisions increase faster than linearly. For the same number of participants (), the kaon yields in Au+Au collisions are lower than in Si+A collisions after the beam energy difference in kaon production rate in N+N interactions was accounted for. On the other hand, the and yields in each of the three systems have quantitatively the same dependence on the total number of participants, differing only in magnitude by a constant factor, in spite of the different distributions.
Strangeness enhancement is observed as an increase in the slope of the kaon yield with the total number of participants as well as the yield per participant. The enhancement in heavy-ion collisions relative to N+N interactions appears to turn on quickly in Si+A collisions and saturate at a moderate collision centrality in Si+Au. The enhancement increases slowly with centrality in Au+Au collisions, and in central Au+Au collisions, reaches and exceeds the value found in central Si+A collisions. The enhancement factor of production are and , respectively, for the most central 7% Si+Au collisions and the most central 4% Au+Au collisions relative to N+N at the correponding beam energy.
VII Acknowledgement
This work was supported by the U. S. Department of Energy under contracts with ANL (W-31-109-ENG-38), BNL (DE-AC02-98CH10886), Columbia University (DE-FG02-86-ER40281), LLNL (W-7405-ENG-48), MIT (DE-AC02-76ER03069), UC Riverside (DE-FG03-86ER40271), by NASA (NGR-05-003-513), under contract with the University of California, by Ministry of Education and KOSEF (951-0202-032-2) in Korea, and by the Ministry of Education, Science, Sports, and Culture of Japan.
REFERENCES
- [1] Present Address: Lawrence Berkeley National Laboratory, Berkeley, CA 94720
- [2] Present Address: CERN, CH-1211, Geneve 23, Switzerland
- [3] Present Address: IKF, August-Euler-Str. 6, D-60486 Frankfurt, Germany
- [4] Present Address: KEK National Laboratory for High Energy Physics, 1-1 Oho, Tsukuba, Ibaraki 305, Japan
- [5] Present Address: Oak Ridge National Laboratory, Oak Ridge, Tennessee 37831
- [6] Present Address: Renaissance Technologies Corp., Stony Brook, New York 11790
- [7] Present Address: The Institute of Physical and Chemical Research (RIKEN), Saitama 351-01, Japan
- [8] Present Address: Center for Nuclear Study, School of Science, University of Tokyo, Tanashi, Tokyo 188, Japan
- [9] Present Address: Yonsei University, Seoul 120-749, Korea
- [10] Present Address: Lawrence Livermore National Laboratory, Livermore, CA 94550
- [11] Present Address: Space Science Laboratory, University of California, Berkeley, CA 94720
- [12] Present Address: Brookhaven National Laboratory, Upton, New York 11973
REFERENCES
- [1] L. Ahle et al. (E802 Collaboration), Phys. Rev. C 57, R466 (1998).
- [2] P. Koch, J. Rafelski, and W. Greiner, Phys. Lett. B 123, 151 (1983).
- [3] P. Koch, B. Müller, and J. Rafelski, Phys. Rep. 142, 167 (1986).
- [4] J. Rafelski, Phys. Rep. 88, 331 (1982).
- [5] J. Rafelski and B. Müller, Phys. Rev. Lett. 48, 1066 (1982).
- [6] U. Heinz et al., Phys. Rev. Lett. 58, 2292 (1987).
- [7] T. Abbott et al. (E802 Collaboration), Phys. Rev. Lett. 64, 847 (1990).
- [8] T. Abbott et al. (E802 Collaboration), Phys. Lett. B 291, 341 (1992).
- [9] R. Matiello et al., Phys. Rev. Lett. 63, 1459 (1989).
- [10] H. Sorge et al., Phys. Lett. B 271, 37 (1991).
- [11] Y. Pang, T. J. Schlagel, and S. H. Kahana, Phys. Rev. Lett. 68, 2743 (1992).
- [12] B.-A. Li and C. M. Ko, Phys. Rev. C 52, 2037 (1995).
- [13] T. Abbott et al. (E802 Collaboration), Nucl. Instr. & Meth. A290, 41 (1990).
- [14] T. Abbott et al. (E802 Collaboration), Phys. Rev. C 50, 1024 (1994).
- [15] L. Ahle et al. (E802 Collaboration), Phys. Rev. C 58, 3523 (1998).
- [16] The E859 Level II trigger system, W.A. Zajc et al. (E802 Collaboration), AIP Conf. Proc. No. 243, 1991.
- [17] F. Videbaek et al. (E802 Collaboration), Nucl. Phys. A590, 249c (1995).
- [18] Y. Akiba et al. (E802 Collaboration), Nucl. Phys. A610, 139c (1996).
- [19] F. Wang, PhD thesis, Columbia University, May 1996.
- [20] B.A. Cole et al. (E802 Collaboration), Nucl. Phys. A590, 179c (1995).
- [21] D.P. Morrison, PhD thesis, Massachusetts Institute of Technology, May 1994.
- [22] R. Debbe et al., Nucl. Instr. & Meth. A403, 256 (1998).
- [23] L. Ahle et al. (E802 Collaboration), Phys. Lett. B 332, 258 (1994).
- [24] The efficiency corrections do not account for a multiplicity/centrality dependence to the tracking efficiency at a fixed spectrometer angle setting. Estimates of the effect of such a dependence indicate that it would reduce the most central rapidity points by at most 5% and result in a negligible change in the total yields.
- [25] E. Albini et al., Nucl. Phys. B84, 269 (1975).
- [26] T. Abbott et al. (E802 Collaboration), Phys. Lett. B 197, 285 (1987).
- [27] T. Abbott et al. (E802 Collaboration), Phys. Rev. C 45, 2933 (1992).
- [28] The average energy loss of the Au beam in the target was corrected for. The beam energy before the correction was 2009 GeV. The energy loss of the Si beam in the targets was not corrected for.
- [29] T. Abbott et al. (E802 Collaboration), Phys. Rev. C 44, 1611 (1991).
- [30] L. Ahle et al. (E802 Collaboration), Phys. Rev. C 59, 2173 (1999).
- [31] B. Moskowitz (E802 Collaboration),Heavy Ion Physics at the AGS MIT 1993, eds. G.S.F. Stephans, S.G. Steadman, W.L. Kehoe, MITLNS-2158, p. 21.
- [32] H. Fesefeldt et al., Nucl. Phys. B147, 317 (1979).
- [33] M. Gazdzicki and O. Hansen, Nucl. Phys. A528, 754 (1991).
- [34] V. Blobel et al., Nucl. Phys. B69, 454 (1974).
- [35] There is a difference of 2% in the estimated kaon yields per N+N collision between Si+Al and Si+Au due to different compositions of protons and neutrons in the two targets. The difference is well within the errors of these estimates and is neglected in the present study.
| System | Bin | |||||||
|---|---|---|---|---|---|---|---|---|
| 0–210 | 209 | 155.4 | 363 | 23.71.6 | 3.760.28 | 0.960.06 | 0.710.04 | |
| 210–309 | 209 | 259.5 | 343 | 21.21.4 | 3.300.32 | 0.970.06 | 0.870.07 | |
| 309–488 | 366 | 398.3 | 316 | 18.21.2 | 2.800.24 | 1.000.06 | 0.860.06 | |
| Au+Au | 488–744 | 523 | 616.4 | 273 | 14.20.9 | 2.150.18 | 0.990.05 | 0.800.05 |
| 744–1099 | 785 | 926.4 | 211 | 9.340.56 | 1.510.10 | 0.960.05 | 0.690.03 | |
| 1099–1615 | 1569 | 1384. | 121 | 4.170.27 | 0.640.05 | 0.910.05 | 0.680.03 | |
| 1615–2300 | 1569 | 1754. | 48 | 1.160.17 | 0.200.03 | 0.980.12 | 0.670.07 | |
| 115 | 259 | 21.8 | 83.9 | 6.130.29 | 1.190.04 | 0.670.03 | 0.560.02 | |
| Si+Au | 85–115 | 481 | 51.7 | 70.0 | 5.110.21 | 1.020.06 | 0.750.03 | 0.670.04 |
| 50–85 | 741 | 149.6 | 42.7 | 3.170.22 | 0.610.03 | 0.890.06 | 0.640.03 | |
| 0–50 | 2222 | 278.8 | 17.8 | 0.790.13 | 0.120.01 | 1.160.19 | 0.690.05 | |
| 48.5 | 97 | 118.3 | 38.7 | 2.560.04 | 0.610.03 | 0.820.01 | 0.710.04 | |
| Si+Al | 35.5–48.5 | 180 | 161.8 | 32.4 | 1.940.04 | 0.440.04 | 0.900.02 | 0.710.04 |
| 22.5–35.5 | 277 | 229.8 | 22.4 | 1.290.03 | 0.290.02 | 0.900.02 | 0.730.04 | |
| 0–22.5 | 831 | 318.2 | 9.5 | 0.420.01 | 0.0800.005 | 1.040.03 | 0.780.05 |