Search for Quadrupole Strength in the Electro-excitation of the
Abstract
High-precision H measurements at (GeV/c)2 are reported, which allow the determination of quadrupole amplitudes in the transition; they simultaneously test the reliability of electroproduction models. The derived quadrupole-to-dipole amplitude ratios, and , are dominated by model error. Previous and results should be reconsidered after the model uncertainties associated with the method of their extraction are taken into account.
13.60.Le,14.20.Gk,25.30.Rw
The conjecture that the nucleon is deformed, raised more than 20 years ago [1], continues to be the subject of intense theoretical [2, 3, 4, 5, 6, 7, 8] and experimental [9, 10, 11, 12, 13, 14, 15] activity. Because the quadrupole moment of the nucleon vanishes on account of its spin-1/2 nature, this investigation has naturally turned to the search for quadrupole strength in the (1232) transition.
Spin-parity selection rules in the transition allow magnetic dipole (M1) and electric (E2) or Coulomb quadrupole (C2) amplitudes. In the naive (spherical) quark model of the nucleon, the excitation is understood as a pure spin-flip (M1) transition. Experimentally, M1 is indeed found to dominate. In more refined models, small E2 and C2 amplitudes are predicted. The physical origin of these contributions is attributed to different mechanisms in the various models. However they invariably have important implications for our understanding of the structure of the nucleon and of QCD at low energies [2, 3, 4, 5].
In pion production, the multipole amplitudes are denoted by , , and , indicating their character (magnetic, electric, or scalar), their isospin (I), and their total angular momentum . Thus, the resonant photon multipoles M1, E2, and C2 correspond to , , and , respectively. The Electric- and Scalar-to-Magnetic-Amplitude-Ratio are defined as and respectively. Most models of the nucleon have definite predictions for these ratios. They are invariably very small at low momentum transfers, the domain of the reported measurements. The predictions for at range from 0.1% up to 5% [2, 3, 4, 5].
While measurements at are pursued with the use of real photons, its evolution and the ratio can be investigated only through electro-excitation. A number of calculations explore the dependence of and on [2, 6, 7, 8]. The experimental determination of and is severely complicated by the presence of non-resonant processes that are coherent with the resonant excitation of the [16]. These processes (such as Born contributions and tails of higher resonances), termed “background contributions,” need to be constrained with model calculations and measurements tailored to this end. Also, it is imperative that electro-production models, used in model extraction of and , are adequately tested in their ability to accurately handle small amplitudes, both resonant and background.
Precision measurements with polarized tagged photons have resulted in an at resonance of [9] and [10]. Model calculations are in reasonably good agreement with experiment [17, 18, 19]. The situation is quite different for electron scattering investigations. Experiments conducted in the late 60’s and early 70’s for up to 1 (GeV/c)2 have yielded values consistent with zero and of around 7% with large statistical and systematic errors [11, 12, 13]. A dispersion relation analysis [20] reported exceptionally large values of around in the range of (GeV/c)2, suggestive of a narrow structure peaking near (GeV/c)2. These values are consistent with the value of the ratio of isospin-mixed multipoles which was reported in a recent H experiment at (GeV/c)2 [14]. The measurements reported here, performed at the same , allow a direct comparison with the afore-mentioned data.
The coincident H cross section in the One-Photon-Exchange-Approximation can be written as [21]:
| (1) | |||||
| (2) |
where is the virtual photon flux; and are the pion momentum and the photon equivalent energy in the hadronic CM frame, respectively; , , and are electron kinematic factors; and is the nucleon azimuthal angle about the momentum transfer measured from the nucleon direction closest to the beam exit line. , , , and are the longitudinal, transverse, longitudinal-transverse, and transverse-transverse interference response functions, respectively [21].
To study the transition with high precision, an extensive program has been developed at the MIT-Bates Linear Accelerator. We report here results from the first phase of the program. We have reported the recoil proton polarization result from the same experiment [22].
The experiment [22, 23] was conducted at energies of 719 and 799 MeV and a liquid H2 target was used; the scattered electrons were detected in the “MEPS” spectrometer and the coincident protons in “OHIPS”. The focal plane instrumentation of each spectrometer consisted of one crossed vertical drift chamber for track reconstruction and scintillators for triggering. Detailed optics studies were done for each spectrometer, and the detection efficiencies were measured as functions of all independent reaction coordinates. The phase-space normalization of the cross section and various corrections applied to the data, including radiative corrections, were implemented with the aid of a Monte Carlo simulation model. The coincident cross section was measured at and for a broad range of hadronic mass W around the resonance and a range of proton polar angle about in the hadronic CM frame near .
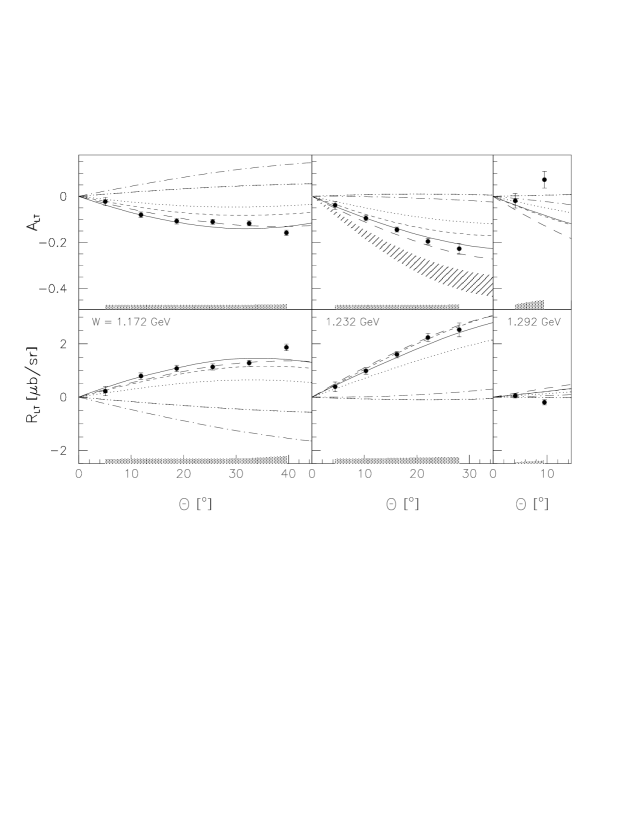
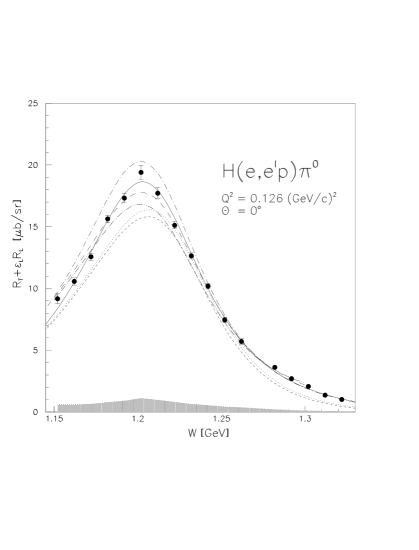
Fig. 1 shows the coincident cross section as a function of the hadronic mass W for proton detection at , where and vanish and has the maximum sensitivity to . The data exhibit a distinct resonant shape, arising mostly from . Fig. 2 shows the response function and the cross section asymmetry which are sensitive to ,
| (3) |
The measured cross section (Fig. 1), asymmetry and response function (Fig. 2), are compared with the curves that result by adjusting the relevant parameters in the models of of Drechsel et al. [17, 24] (MAID), of Sato and Lee (SL) [18, 25], and of Davidson and Mukhopadhyay (RPI) [19, 26]. All three models start from the same Lagrangian for the non-resonant terms, including explicit nucleon and light meson (, , ) degrees of freedom coupled to the electromagnetic field. Their principal differences lie in the definition of the resonance and in the method of unitarization. The solid curve is the fit of the MAID-2000 code, where the five parameters controlling the electromagnetic couplings of the (1232) and of the P11(1440) (Roper) resonances were fitted to our data. The long-dashed curve results by adjusting all seven free parameters of the RPI model, in a fashion similar to that reported in [15], while the short-dashed curve results by judiciously adjusting (without minimization) the parameters of the SL model to the data. All calculations properly obtain the position of the cross section maximum. They differ in their detailed shape and in magnitude. The adjusted MAID-2000 and RPI models provide an excellent description of the data, with the possible exception of the high W points.
The and results (Fig. 2) amply demonstrate the sensitivity of our data to the presence of resonant quadrupole amplitudes. All three models fail dramatically if the resonant quadrupole amplitudes are set to zero. However, when the quadrupole strength is adjusted, good agreement is achieved.
The sensitivity of our data to the quadrupole amplitudes allows for the determination of and either through a variant of the M1-dominance truncated multipole expansion (“TME”) fit (as in [11, 12, 13, 14]) or through model extraction, as in [15]. The derived values are shown in Table I. In TME fit (a), as in [14], it is assumed that only the multipoles and contribute and that is insignificant. Then we obtain . The hatched band in Fig. 2 shows the projected asymmetry ( confidence) for our angular range if the Bonn [14] is adopted. Our data points lie several standard deviations away. Noting that was measured in [14] near , the discrepancy may indicate that terms having a different dependence on than those included in TME fit (a) contribute significantly. If all three multipoles are adjusted, setting ==)=0, the derived value of , labeled with “TME (b)” in Table I, is noticeably larger, although not incompatible with, the value extracted through TME fit (a). This is a manifestation of the significant truncation error that characterizes the TME approach.
and values are also obtained from the fits of the MAID-2000 [24] and RPI [26] models and from the adjustment of the SL model [25]. While all three models achieve a reasonable agreement with the unpolarized data (Figs. 1 and 2), the resulting values of disagree with each other (Table I) and with the experimental value [22]. The MAID-2000 value could be considered as providing a fair agreement, lying within two standard deviations from the experimental value.
Given the overall success of the MAID-2000 model fit in accounting for our data, we adopt the values , , and . The statistically incompatible values provided by the other two, equally sophisticated, model analyses indicate that the results are characterized by substantial model uncertainty. The quantification of this uncertainty for each one of the available models is urgently needed. It could remove the apparent contradictions among the available models. We assume that the scatter of the extracted values provides an estimate of the model uncertainty. We therefore attribute, conservatively, to and model uncertainties of and respectively, and to a model uncertainty of . Previously published and results [11, 12, 13, 14, 15] have not taken into account this uncertainty. They are subject to comparable model error. This added uncertainty may remove all known inconsistencies amongst them, when properly estimated.
The data presented here exhibit unprecedented sensitivity to the presence of resonant quadrupole amplitudes. Their analysis leads us to the following conclusions: i) Extractions of quadrupole strengths based on TME fits are characterized by substantial truncation error and lead to inconsistent results; ii) Claims of large at low derived from earlier [20] and recent [14] measurements cannot be supported; iii) Even when conservative estimates of systematic and model uncertainties are taken into consideration, an unambiguously negative value for is obtained. This value supports the claims for an oblate deformed ; and iv) The available pertinent electroproduction models are on the verge of succesfully describing the high precision data that are now emerging. It is important that the model errors due to input parameters and model assumptions be quantified. It is essential that measurements be performed that are sensitive to background amplitudes, along with those that are primarily sensitive to quadrupole amplitudes.
We are indebted to Drs. S.S. Kamalov, D. Drechsel, L. Tiator, R.M. Davidson, N.C. Mukhopadhyay, T.-S.H. Lee, T. Sato, and J.M. Laget for providing us with detailed calculations and valuable comments concerning their models and the issue of “nucleon deformation.”
REFERENCES
- [1] S. L. Glashow, Physica 96A, 27 (1979).
- [2] S. Capstick and G. Karl, Phys. Rev. D41, 2767 (1990); S. Capstick and B. D. Keister, Phys. Rev. D51, 3598 (1995).
- [3] G. K. N. Isgur et al., Phys. Rev. D25, 2394 (1982).
- [4] C. E. Carlson, Phys. Rev. D34, 2704 (1986).
- [5] A. J. Buchmann et al., Phys. Rev. C55, 448 (1997).
- [6] D. H. Lu et al., Phys. Lett. C55, 3108 (1997).
- [7] S. S. Kamalov and S. N. Yang, Phys. Rev. Lett 83, 4494 (1999).
- [8] G. C. Gellas et al., Phys. Rev. D60, 54022 (1999).
- [9] G. Blanpied et al., Phys. Rev. Lett. 79, 4337 (1997).
- [10] R. Beck et al., Phys. Rev. C61, 35204 (2000).
- [11] K. Batzner et al., Nucl. Phys. B76, 1 (1974).
- [12] R. Siddle et al., Nucl. Phys. B35, 93 (1971).
- [13] J. C. Alder et al., Nucl. Phys. B46, 573 (1972).
- [14] F. Kalleicher et al., Z. Phys. A359, 201 (1997).
- [15] V. V. Frolov et al., Phys. Rev. Lett. 82, 45 (1999).
- [16] C. N. Papanicolas, in Topical Workshop on Excited Baryons, World Scientific, Singapore, 1989; A.M. Bernstein et al., Phys. Rev. C47, 1274 (1993).
- [17] D. Drechsel et al., Nucl. Phys. A645, 145 (1999).
- [18] T. Sato and T.-S. H. Lee, Phys. Rev. C54, 2660 (1996).
- [19] R. M. Davidson et al., Phys. Rev., D43, 71 (1991); R. M. Davidson and N. C. Mukhopadhyay, Phys. Lett. B353, 131 (1995).
- [20] R. L. Crawford, Nucl. Phys. B28, 573 (1971).
- [21] D. Drechsel and L. Tiator, J. Phys. G: Nucl. Part. Phys. 18, 449 (1992).
- [22] G. A. Warren et al., Phys. Rev. C58, 3722 (1998).
- [23] C. Mertz, PhD thesis, Arizona State University, unpublished (1998); C. Vellidis, PhD thesis, University of Athens, in preparation.
- [24] S. S. Kamalov, private communication, 2000.
- [25] T. Sato and T.-S. H. Lee, private communication, 2000, and to be published.
- [26] R. M. Davidson, private communication, 2000.
| Model | /M1+) | ) | ||
| (%) | (%) | |||
| TME (a) | 0 | — | ||
| TME (b) | — | |||
| RPI | ||||
| MAID | ||||
| SL | 27.7 |
.
.