ASTROPHYSICAL NEUTRON CAPTURE RATES IN s– AND r–PROCESS NUCLEOSYNTHESIS
Abstract: Astrophysical neutron capture rates of light and heavy nuclei have been measured and calculated. For the measurements the activation technique was applied at the 3.75 MV Karlsruhe Van de Graaff accelerator, and at the Geel electron linear accelerator (GELINA) the time–of–flight (TOF) method was used. The calculations were performed using direct and compound nuclear capture models.
1. Introduction
The formation of the chemical elements in the astrophysical s– and r–process scenarios is controlled by astrophysical neutron capture rates at thermonuclear energies in the range at 5 to 250 keV. At these low projectile energies the reaction energy in the capture process mainly comes from the neutron binding energy. As, in general, heavy nuclei have a high density of excited states at this energy the well–known compound nuclear capture reaction mechanism (CN) is dominant. But in light, especially, neutron–rich isotopes, and in isotopes at or close to magic neutron and/or proton shells only few excited states are expected. In these cases besides the compound capture another another capture mechanism, direct capture (DC), is comparable or even dominant. - In the measurements activation techniques and the time–of–flight method were employed. The measurements were analyzed and the results compared with compound and direct capture model calculations. Cross sections of unstable target nuclei were estimated theoretically. The astrophysical capture rates were applied in s–process calculations.
2. Activation Measurements
2.1. Activation Method
In the activation method a sample of the target isotope is irradiated by a neutron spectrum of a well–defined energy distribution, and the cross section is determined from the activity of the residual nuclei. Because of the short half–lives of many product isotopes a special activation method had to be developed at the Karlsruhe 3.75 MV Van de Graaff accelerator, the cyclic activation technique, where the irradiation and activity counting phases which form an activation cycle are repeated many times (Fig. 2).

In the cyclic activation method the time constants for each cycle adjusted to the decay rate of the investigated isotope are the irradiation time , the counting time , the waiting time (the time to switch from the irradiation to the counting phase), and the total time ( the time to switch from the counting to the irradiation phase). The accumulated number of counts from a total of cycles, , with the , the counts of the i–th cycle, irradiated by a neutron flux , is given by

| (1) | |||
The following quantities have been defined: : Ge–efficiency, : -ray absorption, : -ray intensity per decay, : the number of target nuclei, : the capture cross section. The activities of nuclides with half–lives of several hours to days can also be counted after the end of the cyclic activation consisting of cycles:
| (2) |
Here is the measuring time of the Ge–detector and the time elapsed between the end of cyclic activation and beginning of the new data acquisition. To avoid the absolute measurement of the neutron flux the sample to be investigated is sandwiched between two thin gold foils and the capture cross section is determined relative to the well–known 197Au cross section.

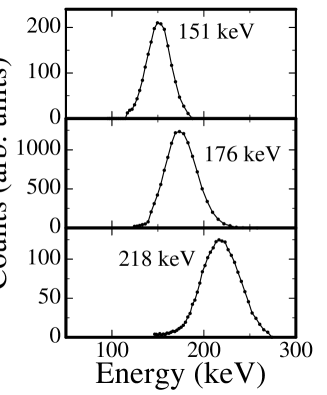
Normally the neutrons are generated by the 7Li(p,n) and T(p,n) reactions. For the energy points at 25 keV and 52 keV one can take advantage of the special properties of these reactions at the reaction threshold. For neutron energies above 100 keV the 7Li(p,n) reaction is applied at higher proton energies and with thin Li–targets (full half–width 15–20 keV). Examples of generated neutron spectra used in the measurements are shown in Fig. 2. For light isotopes reactor neutrons at 25.3 meV can be an important supplement of the measurements. This has been demonstrated for 36S and above all for 48Ca. Additionally, it is desirable to use neutrons in the energy range 5 to 12 keV. In our investigations of (p,n) reactions of different isotopes at reaction threshold we found two possible candidates. With the 51V(p,n) reaction neutrons around 6 keV can be generated. The Fig. 3 shows a time–of–flight spectrum of the 51V(p,n) reaction with a prominent resonance at 6.49 keV. A similar neutron source for neutrons of 8 keV represents the 45Sc(p,n) reaction. This reaction is still under investigation.
2.2. 26Mg and 48Ca Measurements
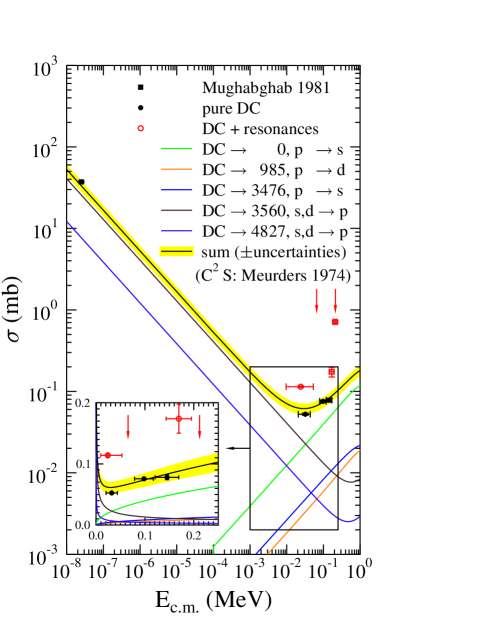
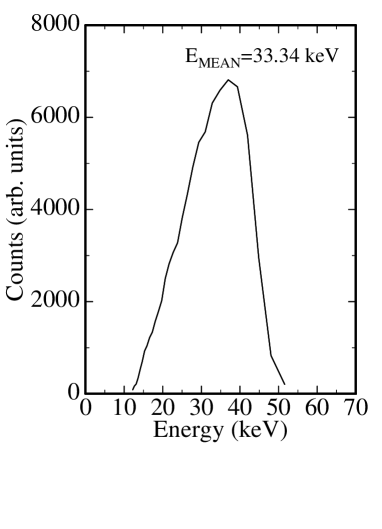
Astrophysical neutron capture rates of light isotopes are required for inhomogeneous big bang scenarios, the –rich freeze out, and the s–process of light isotopes to study neutron poisons, the s–process production of rare neutron–rich isotopes (36S, 40Ar), and isotopic anomalies (Si, Ti) . Neutron capture of light isotopes at the border of stability is often dominated by the direct capture mechanism due to the lack of resonance states of the compound system. Direct capture is a smoothly varying cross section normally smaller than 1 mbarn in the energy range above 1 keV. In the Figs. 5,6 the recent results of the measurements on 26Mg and 48Ca are shown. The data can be described adequately theoretically by the direct capture process. In the keV energy range 26Mg lies in a transition region from s– to p–wave direct capture. Therefore, the cross section (Fig. 5) which is decreasing up to 30 keV is increasing towards higher energies. The total DC capture is the sum of many individual transitions. This would make its measurement via these individual partial transitions complicated. At three of the six data points the DC capture is superimposed by compound capture of individual resonances at 68.7 and 220 keV (arrows in Fig. 5). The influence of the 68.7 keV resonance on our value at 33 keV was excluded by choosing a neutron spectrum at the threshold of the 7Li(p,n) reaction (Fig. 5). In Fig. 6 our and previous 48Ca measurements at thermonuclear energies are summarized. Our new data point at 52 keV confirms the 1/v behavior of this cross section which is the result of direct s–wave capture. No sign of a destructive interference between the non–resonant direct capture and a hypothetical 1/2+ s–wave resonance at 1.5 keV was found.
2.3. Measurements of Pt–Isotopes
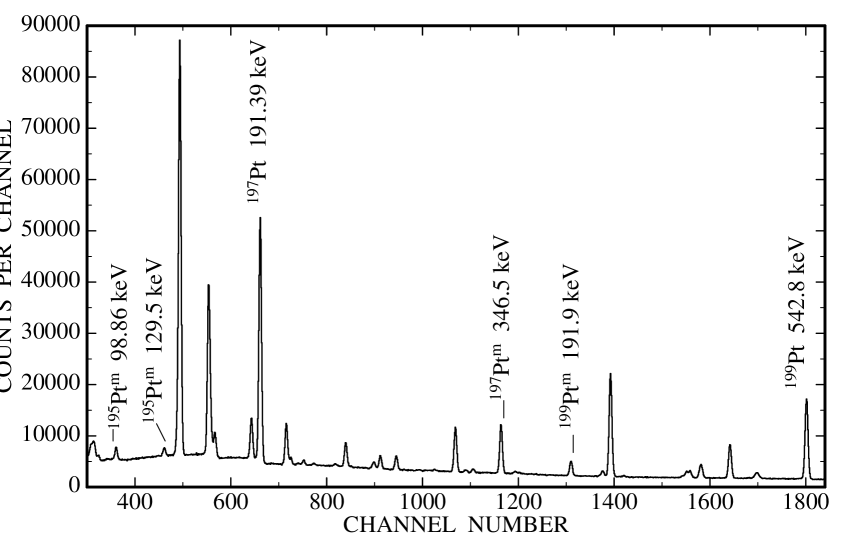
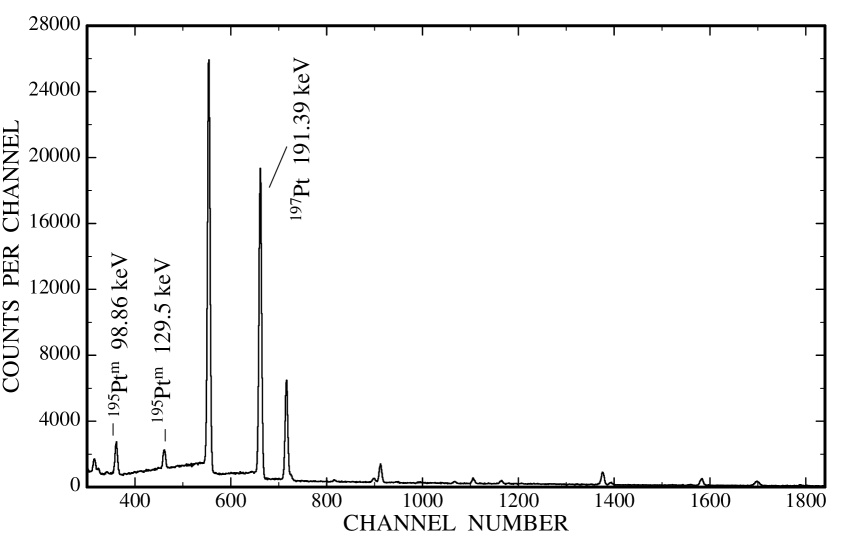
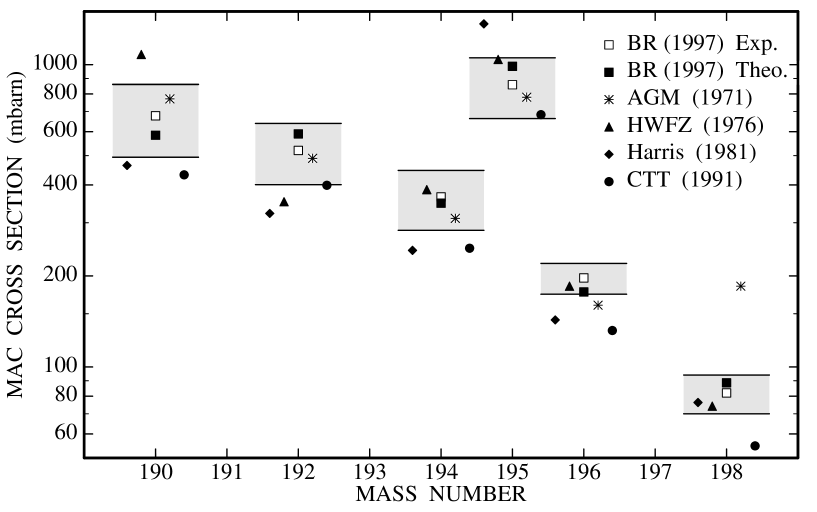
The Pt–isotopes have not yet been investigated by a time–of–flight experiment. With the activation technique capture measurements of 190,194,196,198Pt could be performed with natural Pt samples (metallic foils of 6 mm diameter) even for the rare 190Pt isotope (isotopic content 0.01 %). Although the half lives of the generated activities reach from 13.6 s to 4 d all isotopic cross sections could be measured in one run. The Figs. 8,8 show the –ray activities of the individual Pt–isotopes accumulated during and after termination of the cyclic activation measurement. During the cyclic activation –line intensities of all isotopes also of those with short lived activities can be observed (Fig. 8), whereas after the cyclic activation only the long lived activities are accumulated (Fig. 8). This demonstrates that the cyclic activation technique is an extension of the common activation method and, therefore, applicable to radioactivities of short and long half–lives as well. It is free of saturation effects which limit the reasonable irradiation time of a common activation. The results of our measurements are shown in Fig. 9 together with estimates for the isotopes 192,195Pt. Additionally statistical model calculations with the code SMOKER have been carried out. In Fig. 9 also a comparison is made between our measured and theoretically calculated Pt Maxwellian average capture (MAC) cross sections (BR) and previous theoretical results from (AGM) , (HWFZ) , (Harris) , and (CTT) . Excellent agreement between experimental and theoretical values was found for our MAC cross sections.
The s–process nucleosynthesis path in the Os to Pt mass region is shown in Fig. 10. For 191Os, 192Ir, and 193Pt there is a competition between –decay and neutron capture. The –decay half lives are dependent on temperature and electron density of the s–process environment. The abundance of s–only 192Pt originates from the branchings at 191Os and 192Ir. The isotopes 190Pt and 198Pt are not on the s–process path, therefore the seed abundances vanish during nucleosynthesis. Calculations to reproduce the s–process abundances in the Os– to Pt–mass region have been carried out using parametrized models described in detail elsewhere. In the analysis of the present branching especially the neutron density was adjusted to reproduce the solar abundance of the s–only isotope 192Pt. The calculations were carried out taking into account the uncertainties of the
MAC cross sections and the solar 192Pt abundance. At the neutron density cm-3 which was deduced using all s–process branchings the 192Pt abundance appears to be distinctly underproduced compared with the respective solar abundance. Only at definitely lower neutron densities ( cm-3) the calculated abundance values become consistent with the range of empirical 192Pt values. This distinct difference between neutron densities describing all s–process branchings on the average and the smaller values found for the 191Os– and 192Ir–branchings could be the effect of freeze–out for the 22Ne(,n) neutron source. To confirm this effect the MAC cross sections of the unstable 191Os and 192Ir isotopes have to be determined to better than 20 %.
3. Time–of–Flight Measurements
3.1. 136Ba and 209Bi Results
Among the heavy nuclei the isotopes near or at magic neutron shells have got the smallest capture cross sections. These bottleneck isotopes which control the s–process nucleosynthesis are characterized below 100 keV neutron energy by resonance structure which can be well resolved in high resolution time–of–flight measurements. At the electron linear accelerator GELINA in Geel, Belgium, neutron capture measurements of the bottleneck isotopes 138Ba and 208Pb have been carried out using a pair of C6D6 liquid scintillation detectors at the 60 m flight path station. Details of the detection geometry and the characteristics of the detector efficiency can be found elsewhere. These experiments were continued with new measurements of 136Ba and 209Bi . Both measurements are in agreement within quoted uncertainties with previous results. The stellar rate of s–only 136Ba is now one of the best known astrophysical rates. It should be noted that the MAC cross section of 209Bi at =30 keV reported by Mughabghab is an erroneous calculation from the resonance parameters.
With these reliable MAC cross sections of the bottleneck isotopes the s–process calculations were improved. Parametrized s–process model calculations have been carried out. In the standard SP–model it is attempted to fit global and local structures of the synthesis by one major neutron source burning at =27.1 keV. A better reproduction of the solar s–process abundances was obtained in the DP–model by combined burning of two neutron sources ignited at =8 and 28 keV, respectively. The new MAC cross section of 209Bi confirms this s–process analysis at the termination of the synthesis.
| 134/136 | 135/136 | 137/136 | 138/136 | ||
|---|---|---|---|---|---|
| (mbarn-1) | |||||
| solar ratiosa | 0.308 | 0.839 | 1.430 | 9.129 | |
| s–Bab | 0.3410.003 | 0.1350.003 | 0.6840.007 | 6.220.08 | |
| SP model | 0.188 | 0.37 | 0.15 | 0.74 | 6.22 |
| (0.296) | (0.35) | (0.14) | (0.75) | (7.89) | |
| DP model | 0.102 | 0.31 | 0.16 | 0.76 | 6.22 |
| (0.140) | (0.30) | (0.15) | (0.76) | (7.21) |
a Ref., b Ref.
The special role of the 138Ba MAC cross section and the new measurement of 136Ba also allows a more detailed investigation of the isotopic anomalies in barium ascribed to the s–process. In Table 1 Ba isotopic ratios obtained from s–process calculations are compared with the observed s–Ba ratios detected in meteoritic SiC grains . Additionally the solar ratios are given, too. The isotopic chain of Ba has got unique s–process features. The abundance ratio of the s–only isotopes 134Ba/136Ba depends on a branching at 134Cs which is sensitive to both s–process neutron density and temperature. The isotope 138Ba controls the average neutron exposure in the s–process. The character of this dependence shows the ratio
| (3) |
where the MAC cross section is comparable with . A necessary condition that the exposure sensitivity of the successive Ba–isotopes 136, 137, and 138 on the unique synthesis path can be studied is the fact that 138Ba/136Ba is significantly less than , i.e., there is a strong deviation from the anticorrelation between abundance and MAC cross section (compare e.g., the s–process 138Ba/136Ba ratios of Tab. 1 with = 13.26 at =8 keV). In the SP– and DP–model calculations the exposure has been adjusted to reproduce the 138Ba/136Ba ratio. The s–Ba composition seems to be different from the solar s–process (in brackets in Tab. 1) because the ratio 138Ba/136Ba is different and consequently also the average exposure (Table 1).
The support of the Volkswagen–Stiftung (Az: I/72286), the Deutsche Forschungsgemeinschaft (DFG) (project Mo739) and the Fonds zur Förderung der wissenschaftlichen Forschung (FWF S7307–AST) is gratefully acknowledged. TR is supported by an APART fellowship of the Austrian Academy of Sciences.
References
References
- [1] H. Oberhummer, H. Herndl, T. Rauscher, and H. Beer, Surveys in Geophys., 17 (1996) 665
- [2] H. Beer, G. Rupp, F. Voß, and F. Käppeler, Ap. J. 379 (1991) 420
- [3] H. Beer, M. Wiescher, F. Käppeler, J. Görres, and P. E. Koehler, Ap. J. 387 (1992) 258
- [4] H. Beer, P. V. Sedyshev, Yu. P. Popov, W. Balogh, H. Herndl, and H. Oberhummer, Phys. Rev. C52 (1995) 3442
- [5] H. Beer, C. Coceva, P. V. Sedyshev, Yu. P. Popov, H. Herndl, R. Hofinger, P. Mohr, and H. Oberhummer, Phys. Rev. C54 (1996) 2014
- [6] J. Meißner, H. Schatz, J. Görres, H. Herndl, M. Wiescher, H. Beer, and F. Käppeler, Phys. Rev. C53 (1996) 459
- [7] J. Meißner, H. Schatz, H. Herndl, M. Wiescher, H. Beer, and F. Käppeler, Phys. Rev. C53 (1996) 977
- [8] P. Mohr, H. Oberhummer, and H. Beer, Proc. of the Int. Symposium on Capture Gamma–Ray Spectroscopy and Related Topics, ed. G. Molnar, Budapest 1996, in print
- [9] P. Mohr, H. Oberhummer, H. Beer, W. Rochow, V. Knölle, G. Staudt, P. V. Sedyshev, and Yu. P. Popov, Phys. Rev. C, submitted
- [10] H. Beer, F. Corvi, and P. Mutti, Ap. J. 474 (1997) 843
- [11] H. Beer and F. Käppeler, Phys. Rev. C21 (1980) 534
- [12] H. Beer, G. Rupp, G. Walter, F. Voß, and F. Käppeler, Nucl. Instr. Methods A337 (1994) 492
- [13] W. Ratynski and F. Käppeler, Phys. Rev. C37 (1988) 595; and R. L. Macklin, private communication
- [14] P. Hoppe, S. Amari, E. Zinner, T. Ireland, and R. S. Lewis, Ap. J. 430 (1994) 870
- [15] K. H. Kim, M. H. Park, and B. T. Kim, Phys. Rev. C35 (1987) 363
- [16] F. Käppeler, G. Walter, and G. J. Mathews, Ap. J. 291 (1985) 319
- [17] H. Beer and T. Rauscher, Ap. J., submitted
- [18] F.-K. Thielemann, M. Arnould, and J. W. Truran, in Adv. in Nucl. Astrophys., eds. E. Vangioni-Flam et al. (Gif-sur-Yvette: Editions Frontières 1987), p. 525
- [19] B. J. Allen, J. H. Gibbons, and R. L. Macklin, Adv. Nucl. Phys., 375 (1971) 823
- [20] J. A. Holmes, S. E., Woosley, W. A. Fowler, and B. A. Zimmerman, At. Data Nucl. Data Tables 18 (1976) 306
- [21] M. J. Harris 1981, Astrophys. Space Sci. 77 (1981) 357
- [22] J. J. Cowan, F.-K. Thielemann, and J. W. Truran, Phys. Rep., 208 (1991) 267
- [23] K. Takahashi and K. Yokoi, Atomic Data Nucl. Data Tables 36 (1987) 375
- [24] F. Corvi, G. Fioni, F. Gasperini, and P. B. Smith, Nucl. Sci. Eng. 107 (1991) 272
- [25] P. Mutti, F. Corvi, K. Athanassopulos, and H. Beer, in Nuclei in the Cosmos, Notre Dame, USA, 20.–27. June, 1996, ed. M. Wiescher, Nucl. Phys. A (Suppl.), in print
- [26] P. Mutti, F. Corvi, K. Athanassopulos, and H. Beer, Int. Conf. on Nuclear Data for Science and Technology, Trieste, Italy, 19.–24. May, 1997
- [27] F. Voss, K. Wisshak, and F. Käppeler, Phys. Rev. C52 (1995) 1102
- [28] P. E. Koehler, R. R. Spencer, R. R. Winters, K. H. Guber, J. A. Harvey, N. W. Hill, and M. S. Smith, Phys. Rev. C54 (1996) 1463
- [29] S. F. Mughabghab, Neutron Cross Sections, Vol 1, Part B (Academic Press, INC., Orlando 1984)
- [30] H. Palme and H. Beer, in Landolt Börnstein, New Series VI, Astronomy and Astrophysics, Subvolume 3a, (Berlin: Springer 1993), p. 196
- [31] C.A. Prombo, F.A. Podosek, S. Amari, and R.S. Lewis, Ap. J. 410 (1990) 393