Measurements of the reactions and
Abstract
Charged current reactions of on have been studied using a decay-at-rest beam from the Los Alamos Meson Physics Facility. More than 500 events from the exclusive reaction were measured in a large Liquid Scintillator Neutrino Detector (LSND). The observed energy dependence of the cross section and the angular distribution of the outgoing electron agree well with theoretical expectations. Measurements are also presented for inclusive transitions to excited states, and compared with theoretical expectations. Results are consistent with a recent Continuum Random Phase Approximation (CRPA) calculation.
pacs:
14.60.Lm, 13.15.+gI Introduction
There are two principal reasons for measuring low energy (E52 MeV) neutrino-nucleus scattering. First the extracted cross section provides unique insight into nuclear dynamics. The yield depends on dynamics as expressed by nuclear axial-vector and vector currents, thereby providing additional information beyond the vector currents which are obtained from electron-nucleus scattering. Next, the neutrino-nucleus cross sections are required both for calculating certain astrophysical processes and for characterizing the response of neutrino detectors. In the former case, neutrino-nucleus interactions in the outer shells of stars undergoing supernova explosions cause further nucleosynthesis to occur [1]. Neutrinos of all flavors are produced in the interior of the star during supernova collapse. These neutrinos undergo interactions with nuclei changing the nuclear composition of the star via charge-changing processes and the excitation of particle unstable nuclear states. In the latter case, many of present day active neutrino detectors are composed of 12C or 16O nuclei, in addition to 1H or 2H, and thus require accurate knowledge of these neutrino-nucleus cross sections to reliably interpret the detector output.
At the present time, relatively few measurements of neutrino-nucleus cross sections exist. Neutrino-carbon cross sections for neutrinos created from the decay of stopped positive muons have been measured only twice before this experiment. E225 [2] at LAMPF and the KARMEN collaboration [3] at ISIS facility of the Rutherford Laboratory have measured the cross section for the exclusive reaction and for the more inclusive reaction to all the other accessible final states. The yield to the ground state dominates the total yield, as it is the only allowed () transition that occurs in this process. In this paper we report on our measurement of the same processes. Our results are more accurate than the earlier measurements [2-4] and in good agreement with them. We have also measured the angular distributions of the electrons with respect to the direction for these processes as well as the energy dependence of the ground state transition. All are in excellent accord with expectation.
Calculation of neutrino- cross sections have attracted a good deal of attention [5-9]. The cross section for producing the ground state can be calculated to an accuracy of 2% as it can be represented in terms of form factors [5] that can be reliably extracted from other measurements. Calculating the inclusive yield to the excited states is a far less certain procedure. The Fermi Gas Model (FGM) is not applicable as the momentum transfers (Q 100 MeV/c) are much smaller than the Fermi momentum (200 MeV/c) in carbon. Thus it is necessary to employ a model that reliably reflects the nuclear dynamics. The most recent work [9] uses a model that includes the residual particle-hole interaction via the random-phase approximation (CRPA). The authors have argued that the CRPA calculation for this process should be accurate once the parameters have been determined via fitting to a comparable process such as, say, negative muon capture on . Their calculations correctly represent the experimental results we present in this paper but it should be mentioned that their prediction [9] for our preliminary results [10, 11] on the inclusive yield from obtained using higher energy from decay in flight is too large by nearly a factor of two. This discrepancy has generated considerable theoretical interest [12, 13] but remains unexplained. We will publish our final results on this measurement in a subsequent paper [14].
Finally, we note the relevance of the analysis presented in this paper to the evidence for neutrino oscillations previously presented by the LSND collaboration [15]. The excellent agreement found with expectations and with previous experiments for the reaction provides important confirmation of our understanding of the neutrino beam and the detector performance. The neutron analysis presented in section VII likewise provides a valuable test of the techniques used for neutron identification.
II The Neutrino Source
The data reported here were obtained in 1994 and 1995 at the Los Alamos Meson Physics Facility (LAMPF) using neutrinos produced at the A6 proton beam stop. The neutrino source is described in detail elsewhere [16]. This facility is now the Los Alamos Neutron Science Center (LANSCE). The beam stop consists of a 30 cm water target surrounded by steel shielding and followed by a copper beam dump. The high-intensity 800 MeV proton beam from the linear accelerator generates a large pion flux from the water target. The flux of used for the measurements reported here arise from the decay at rest (DAR) of stopped and . This decay chain yields almost equal intensities of and with the well determined energy spectra shown in Fig. 1.
The corresponding decay chain for and is highly suppressed due to three factors. First, production of is approximately eight times smaller than for at LAMPF. Second, which stop are absorbed by nuclear interactions. Finally, most which stop are absorbed before they can decay. These stopped arise from which decay in flight since which stop are absorbed. Approximately 3.4% of the and 5% of the decay in flight (DIF) yielding fluxes of and that are used for the complementary measurements described elsewhere [11, 14].
The LAMPF beam dump has been used as the neutrino source for previous experiments E31 [17], E225 [2] and E645 [18]. A calibration experiment, E866 [19], measured the rate of stopped from a low intensity proton beam incident on an instrumented beam stop. The rate of stopped per incident proton was measured as a function of several variables and used to fine tune a beam dump simulation program [20]. This simulation program can then be used to calculate the flux for any particular beam dump configuration. The calibration experiment determined the DAR flux to % for the proton energies and beam stop configurations used at LAMPF. This 7% uncertainty provides the largest source of systematic error for the cross sections presented here. It is worth mentioning that the measurements of the cross section made by the KARMEN collaboration [3] and E225 [2] also rely on this calibration experiment and beam dump simulation program. The LAMPF proton beam typically had a current of 800 A and an energy of approximately 770 MeV at the A6 beam stop. The integrated beam current was 5904 C in 1994 and 7081 C in 1995. The calculated ratio of stopped per proton was 0.090 and 0.084 for 1994 and 1995 respectively with the lower ratio for 1995 arising because the water target was out for 32% of the 1995 data. Upstream targets A1 and A2 contribute 1.4% to the DAR flux. The DAR flux averaged over the LSND detector was then for 1994 and for 1995.
III The LSND Detector
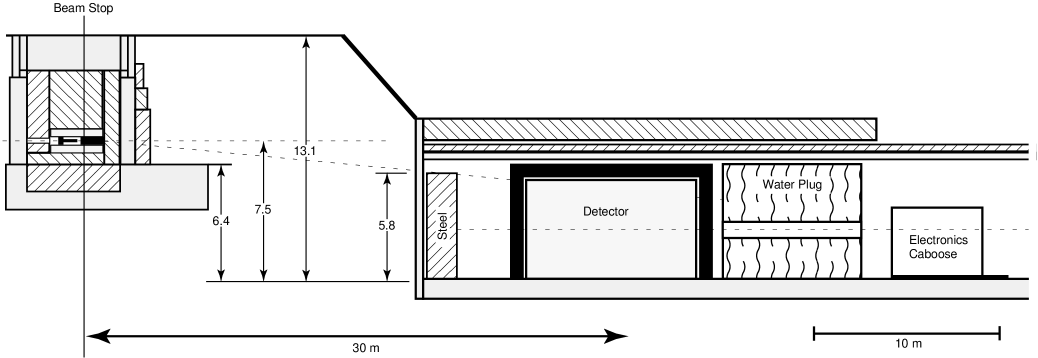
The detector is located 29.8 m downstream of the proton beam stop at an angle of to the proton beam. Fig. 2 shows a side-view of the setup. Approximately 2000 of shielding above the detector attenuates the hadronic component of cosmic rays to a negligible level. Enclosing the detector, except on the bottom, is a highly efficient liquid scintillator veto shield which is essential to reduce contributions from the cosmic ray muon background to a low level. The detector is also well shielded from the beam stop so that beam associated neutrons are attenuated to a negligible level. Ref. [16] provides a detailed description of the detector, veto and data acquisition system which we briefly review here.
The detector is a roughly cylindrical tank containing 167 tons of liquid scintillator and viewed by 1220 uniformly spaced 8” Hamamatsu PMTs covering 25% of the surface inside the tank wall. When the deposited energy in the tank exceeds a threshold of approximately 4 MeV electron-equivalent energy and there are fewer than 4 PMT hits in the veto shield, then the digitized time and pulse height of each of these PMTs (and of each of the 292 veto shield PMTs) are recorded. A veto, imposed for 15.2 s following the firing of 5 veto PMTs, substantially reduces () the large number of background events arising from the decay of cosmic ray muons that stop in the detector. Activity in the detector or veto shield during the 51.2 preceding a primary trigger is also recorded provided there are 17 detector PMT hits or 5 veto PMT hits. This activity information is used in the analysis to further reject events arising from muon decay. Data after the primary event are recorded for 1 ms with a threshold of 21 PMTs (approximately 0.7 MeV equivalent). This low threshold is necessary for neutron identification as described below. The detector operates without reference to the beam spill, but the state of the beam is recorded with the event. Approximately 93% of the data is taken between beam spills. This allows an accurate measurement and subtraction of cosmic ray background surviving the event selection criteria.
The detector scintillator consists of mineral oil () in which is dissolved a small concentration (0.031 g/l) of b-PBD [21]. This mixture allows the separation of erenkov light and scintillation light and produces about 33 photoelectrons per MeV of electron energy deposited in the oil. The combination of the two sources of light provides direction information and makes particle identification (PID) possible for relativistic particles. Identification of neutrons is accomplished through the detection of the from neutron capture on free protons. Note that the oil consists almost entirely of carbon and hydrogen. Isotopically the carbon is 1.1% 13C and 98.9% 12C.
The veto shield encloses the detector on all sides except the bottom. Additional counters were placed below the veto shield after the 1993 run to reduce cosmic ray background entering through the bottom support structure. These counters around the bottom support structure are referred to as bottom counters. The main veto shield [22] consists of a 15-cm layer of liquid scintillator in an external tank and 15 cm of lead shot in an internal tank. This combination of active and passive shielding tags cosmic ray muons that stop in the lead shot. A veto inefficiency is achieved with this detector for incident charged particles. The veto inefficiency is large for incident cosmic ray neutrons.
IV Analysis Techniques
Each event is reconstructed using the hit time and pulse height of all hit PMTs in the detector [16]. The present analysis relies on the reconstructed energy, position, direction and particle ID parameter, . The particle direction is determined from the Cerenkov cone. The parameter is used to distinguish electron events from events arising from interactions of cosmic ray neutrons in the detector. Fortunately, it is possible to measure the response of the detector to electrons and neutrons in the energy range of interest for this analysis. We also make use of a detailed Monte Carlo simulation, LSNDMC [23], which was written to simulate events in the detector using GEANT.
The response of the detector to electrons was determined from a large, essentially pure sample of electrons (and positrons) from the decay of stopped cosmic ray in the detector. The known energy spectra for electrons from muon decay was used to determine the absolute energy calibration including its small variation over the volume of the detector. The energy resolution was determined from the shape of the electron energy spectrum and was found to be 6.6% at the 52.8 MeV endpoint. The position and direction resolution obtained from the LSNDMC simulation are approximately 30 cm and respectively for electrons in the energy region of interest, 16 to 35 MeV. The precision of position reconstruction has been checked from a comparison of the reconstructed positions of the and the decay of a large sample of events [16]. The accuracy of the direction measurement is discussed more in section VI.
There are no tracking devices in the LSND detector and thus event positions must be determined solely from the PMT information. The reconstruction process determines an event position by minimizing a function which is based on the time of each PMT hit corrected for the travel time of light from the assumed event position to the PMT [16]. This reconstruction procedure was found to systematically shift event positions away from the center of the detector and thus effectively reduces the fiducial volume [15]. In the analysis presented in this paper a fiducial cut is imposed by requiring D 35 cm, where D is the distance between the reconstructed event position and the surface tangent to the faces of the PMTs.
The effect of the reconstruction bias on the fiducial acceptance was determined from the analysis of a sample of stopping muon events for which both the muon and the subsequent decay electron were detected. No fiducial cut was imposed on either the muon or the electron so that essentially all muons which stopped in the scintillator and decayed were included. For comparison a sample of simulated stopping muon events was generated using LSNDMC. The observed and generated distributions of the distance D were compared for electrons satisfying a minimum energy requirement. The observed distribution was found to be shifted outward relative to the generated distribution. Five independent analysis of this type yielded the acceptance factor of for D35 cm due to the reconstruction bias. There is independent support for this conclusion. A new reconstruction procedure has been developed which relies both on PMT pulse height and timing information, and is expected to be less biased. This new reconstruction procedure calculates the likelihood for the observed PMT charge distribution and time distribution as a function of position. The final position is then determined by maximizing the likelihood. Comparison of positions obtained with the new and the standard reconstruction procedures indicate a pushing out effect in good agreement with that obtained from the stopping muon analysis.
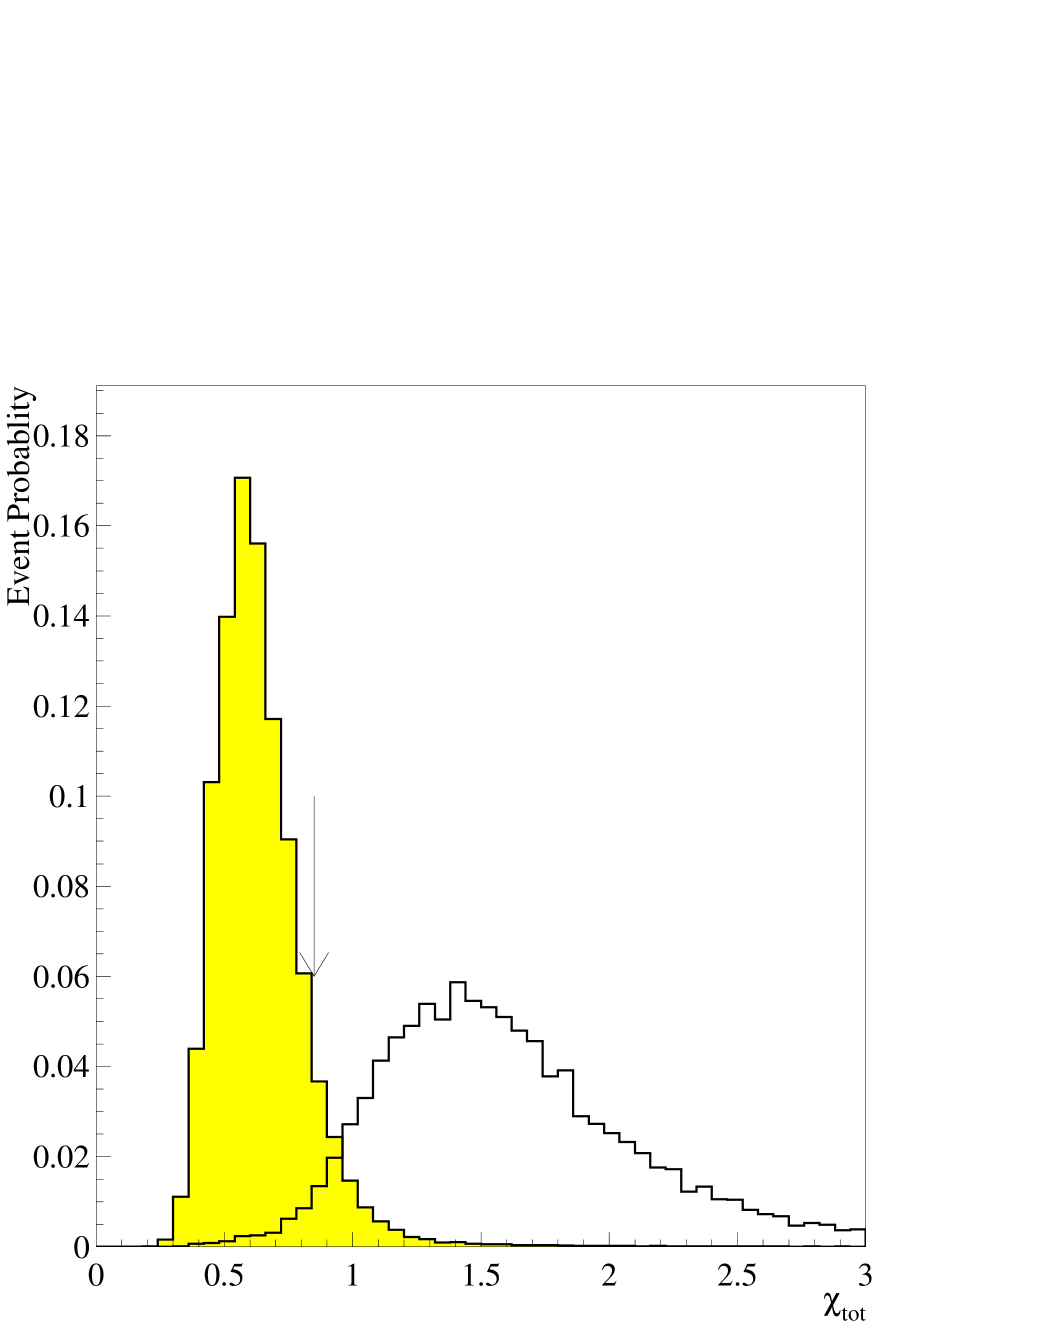
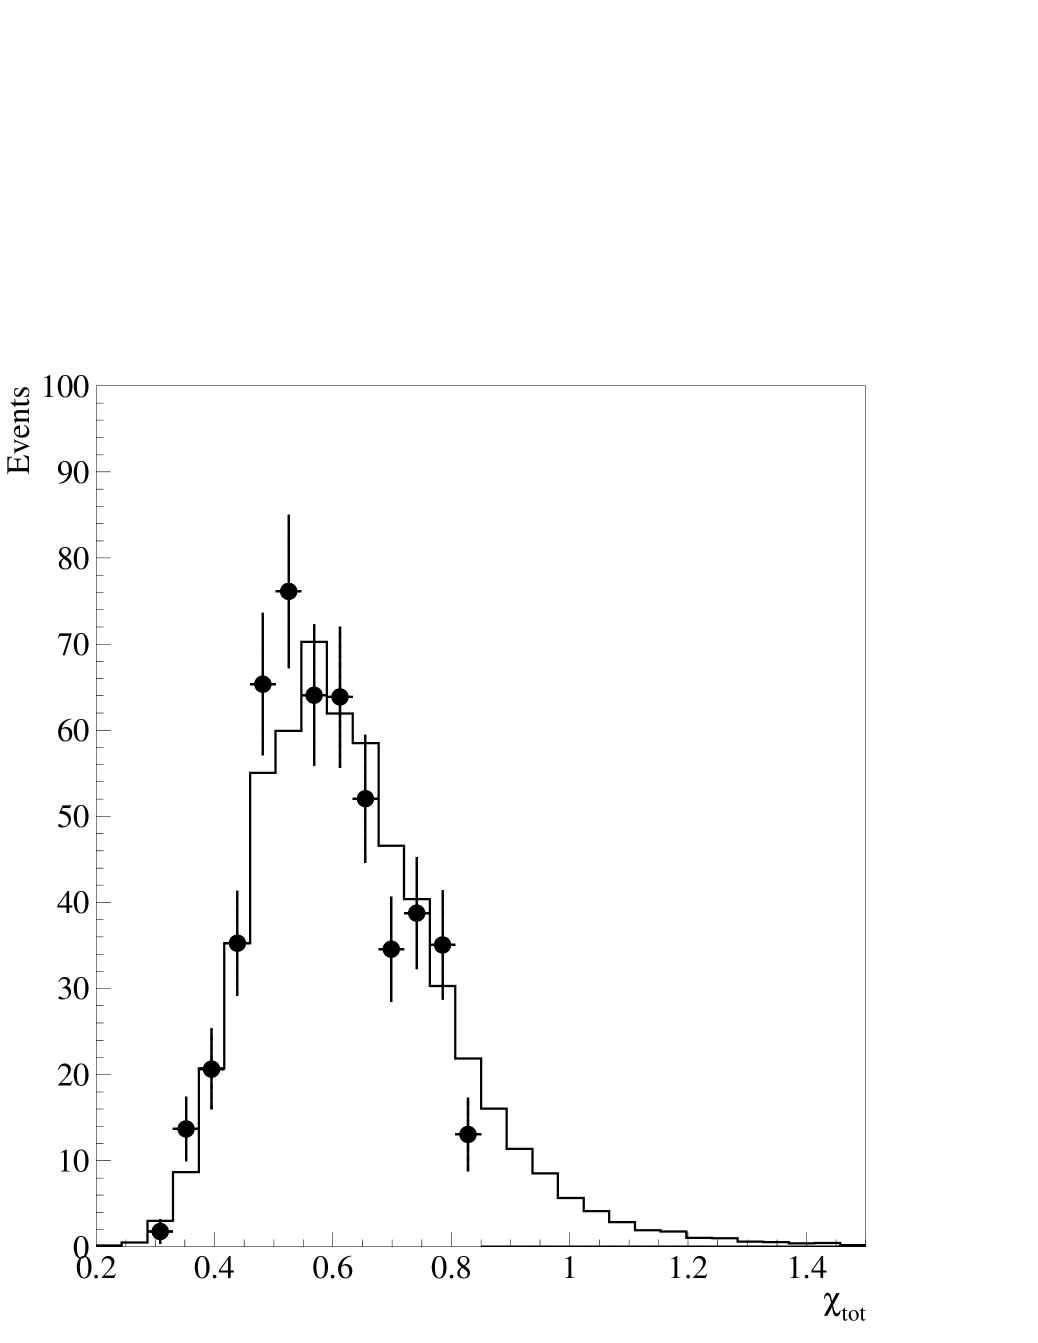
The particle identification procedure is designed to separate particles with velocities well above Cerenkov threshold from particles below Cerenkov threshold by making use of the four parameters defined in Ref. [16]. Briefly, and are the quantities minimized for the determination of the event position and direction, is the fraction of PMT hits that occur more than 12 ns after the fitted event time and is proportional to the product of and . For the present analysis we use only . Fig. 3 shows the distributions for electrons from stopping decay and for cosmic ray neutrons with electron equivalent energies in the MeV range. For a neutron is the equivalent electron energy corresponding to the observed total charge. In the present analysis we eliminate most cosmic ray neutron background by requiring 0.85.
The presence of a neutron can be determined by the neutron capture reaction . The mean capture time in the LSND detector is expected to be 186 , essentially independent of the initial neutron energy. Three variables are used to identify a capture correlated with a neutron in the primary event: the number of PMT hits for the , the distance of the from the primary event and the time of the from the primary event. Fig. 4 shows the distributions of these variables for correlated s and for uncorrelated (accidental) s. A likelihood technique, discussed in Ref. [15], has been developed to separate the correlated component due to neutrons from the uncorrelated component. An approximate likelihood ratio is calculated for each event from the three measured variables. If there is no within 1 ms and 2.5 m from the primary event then R for the event. The expected distributions of R are shown in Fig. 5 for a correlated sample (every event has one neutron) and for an uncorrelated sample (no event has a neutron). The correlated R distribution was found to be almost independent of event position within the fiducial volume [15]. The accidental gamma rate is higher near the bottom front corner of the detector then elsewhere, but the shape of the uncorrelated R distribution has little position dependence. In the present paper we use the analysis solely to verify that the events in the samples are not accompanied by neutrons and to study the cosmic ray background. The measured R distribution is fit to a mixture of the two distributions shown in Fig. 5 and the fraction of events with neutrons is obtained.
Beam-off data taken between beam spills plays a crucial role in the analysis of this experiment. Most event selection criteria are designed to reduce the cosmic ray background while retaining high acceptance for the neutrino process of interest. Cosmic ray background which remains after all selection criteria have been applied is well measured with the beam-off data and subtracted using the duty ratio, the ratio of beam-on time to beam-off time. This ratio was 0.080 for 1994 and 0.060 for 1995. Beam-on and beam-off data have been compared to determine if there are any differences other than those arising from neutrino interactions. No differences are found in trigger rates, veto rates or various accidental rates, including accidental rates, and there is no evidence of beam neutrons at any energy. From these and more detailed comparisons we find no indication of any non-neutrino induced beam background or any problem with the beam-off subtraction procedure.
V The transition to the ground state
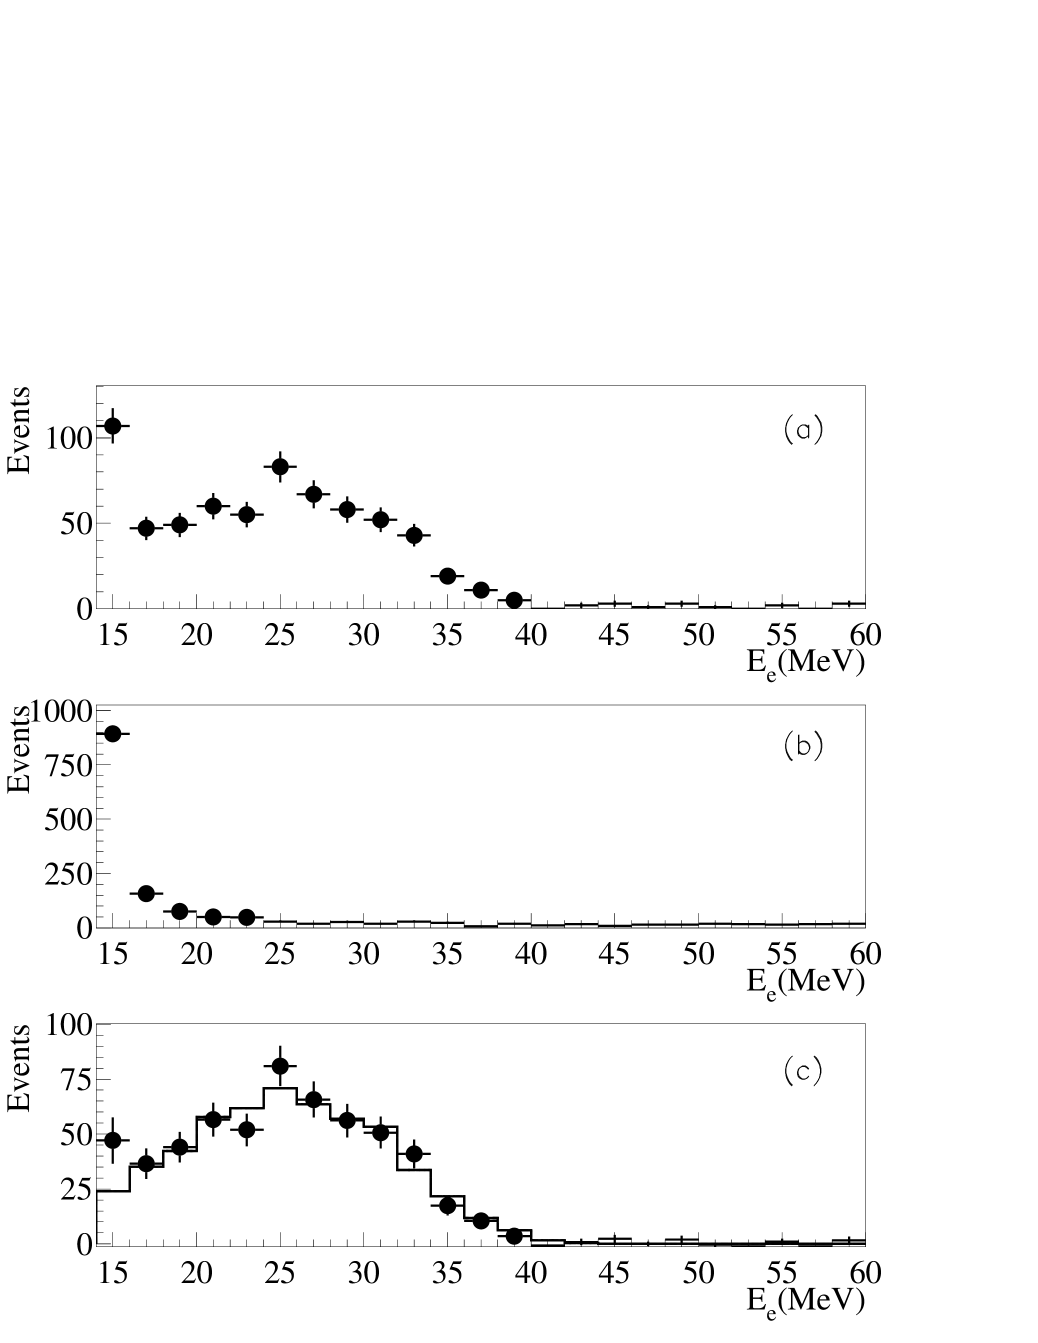
The reaction is identified by the detection of the followed, within 45 ms, by the positron from the decay of the . Transitions to excited states of 12N decay by prompt proton emission and thus do not feed down to the 12N ground state or contribute to the delayed coincidence rate. The scattered electron has a maximum kinetic energy of 35.5 MeV due to the Q value of 17.33 MeV. The beta decay has a mean lifetime of 15.9 ms and maximum positron kinetic energy of 16.33 MeV. The cross section to the ground state has been calculated by several groups [5-9]. The form factors required to calculate the cross section are well known from a variety of previous measurements. This cross section and the known flux are used to obtain the expected electron kinetic energy spectru. Fig. 6 shows the observed electron energy distribution in the beam-on, beam-off and beam-excess samples for events with an identified beta decay. Fig. 6(c) compares the expected and observed energy distributions.
The selection criteria and corresponding efficiencies for the electron are shown in Table I. The reconstructed electron position is required to be a distance cm from the surface tangent to the faces of the PMTs. There are 12C nuclei within this fiducial volume. A lower limit on the electron energy of 16.0 MeV eliminates the large cosmic ray background from beta decay as well as most 15.1 MeV gamma rays from the neutral current excitation of carbon. The nuclei arise from the absorption of stopped on nuclei in the detector.
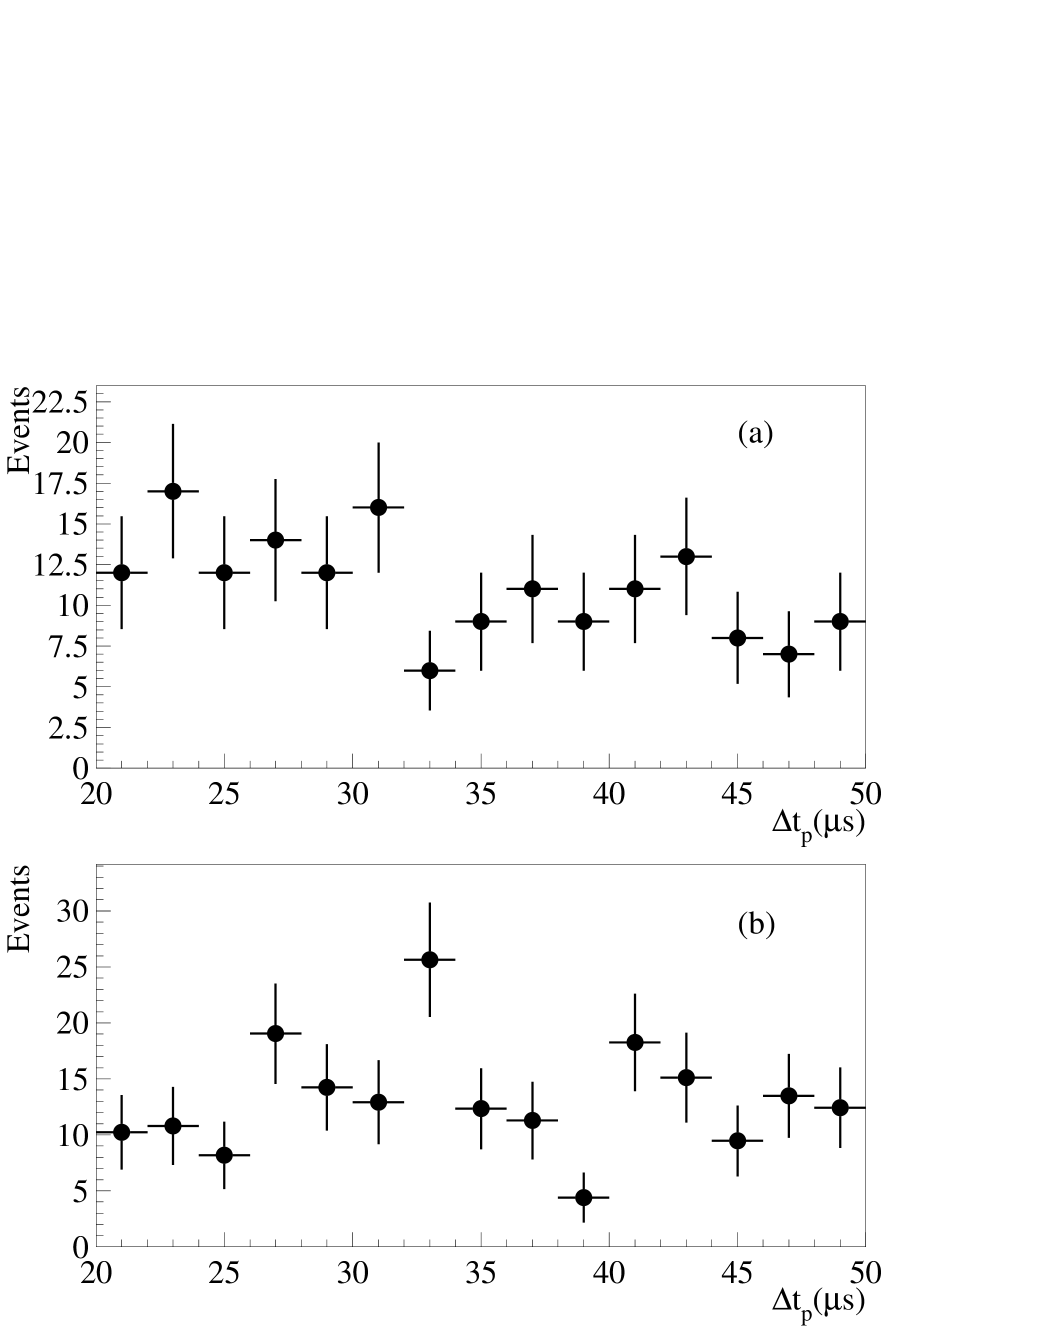
The past activity cut is designed to reject most electron events arising from cosmic ray muons which stop in the detector and decay. This background has a time dependence given by the 2.2 muon lifetime. The past activity selection criteria reject all events with activity within the past 20 . Events with activity between 20 and 35 in the past are rejected if for the activity either (a) the detector charge is greater than 3000 photoelectrons ( MeV) or (b) the number of tank hits is greater than 100. Beyond 35 no cut is applied. Fig. 7 shows the distribution of time to the closest past activity for beam-off and beam-excess events passing these criteria. Only events with past activity between 20 and 50 are plotted. The relatively loose cut applied in the 20 to 35 time interval is still adequate to reject most muons surviving this long. This can be seen in Fig. 7(a) where the rate of beam-off events is comparable above and below 35 s and there is no indication of a time dependence corresponding to the 2.2 muon lifetime. The rate of beam-excess events, shown in Fig. 7(b), is also comparable above and below 35 , consistent with the small calculated loss of acceptance (4.6%) for the 20 to 35 s interval. In-time veto cuts are designed to reject events arising directly from cosmic ray particles which enter the detector. Events with more than 3 veto hits or any bottom counter coincidence during the 500 ns event window are eliminated . The beam-off subtraction procedure removes the small cosmic ray background which survives the above cuts.
The acceptances for the election selection criteria are shown in Table I separately for 1994 and 1995 data samples. The acceptances for the past activity and in-time veto cuts are obtained by applying these cuts to a large sample of events triggered with the laser used for detector calibration. These laser events are spread uniformly through the run and thus average over the small variation in run conditions. The acceptance for the 15.1 trigger veto is included in the past activity efficiency. A sample of Michel electrons (electrons from the decay of stopped ) was analyzed to obtain the acceptance of electrons for the particle identification cut. The Michel electrons were given weights as a function of energy so that the weighted spectrum agrees with the observed energy spectrum for the sample. Similarly, events are weighted as a function of position. Fig. 8 compares the distribution of the electrons in the sample with the weighted Michel sample. The agreement is excellent.
Table II gives the selection criteria and efficiencies for the beta decay positron. Fig. 9 shows the observed beta decay time distribution compared with the expected 15.9 ms lifetime. Fig. 10 shows the distance between the reconstructed electron and positron positions for the beam-excess sample. A cut was applied at 100 cm resulting in an acceptance of . Following an electron produced by a neutrino interaction an uncorrelated particle, such as the positron from beta decay, will occasionally satisfy all the positron criteria including the requirements of time (45 ms) and spatial (1 m) correlation with the electron. The probability of such an accidental coincidence can be precisely measured from the Michel electron sample. The background from this source is also shown in Fig. 9 and 10. The efficiency of 81.5% caused by the 15.1 s veto and the trigger dead time of 3% are the same as for the electron. Positrons with 4 or more in-time veto hits or any bottom veto coincidence are rejected. Fig. 11 shows the observed distribution for the positron for the beam-excess sample. No cut on is applied. The energy distribution of the positron is calculated from the beta decay using
| (1) |
where and is the total positron energy (including rest energy). The decays to the ground state ( MeV) 94.6% of the time. Beta decay transitions to the excited states of carbon are 1.9% ( MeV, followed by a 4.4 MeV ), 2.7% ( = 9.17 MeV) and 0.8% ( = 6.5 MeV) [24]. The positron annihilates with an electron after stopping. The Monte Carlo was used to generated expected distributions for the positron energy and for number of hit PMTs. There was a trigger requirement of 100 PMT hits for 1994 and 75 PMT hits for 1995. Fig. 12 compares the observed and expected positron energy distributions. The good agreement shows that the energy calibration is valid for these low energy electrons.
Table III provides a breakdown of the number of events satisfying the selection criteria as well as the acceptances, the neutrino flux and the resulting flux averaged cross section for both years of data. For the complete data sample the flux averaged cross section is
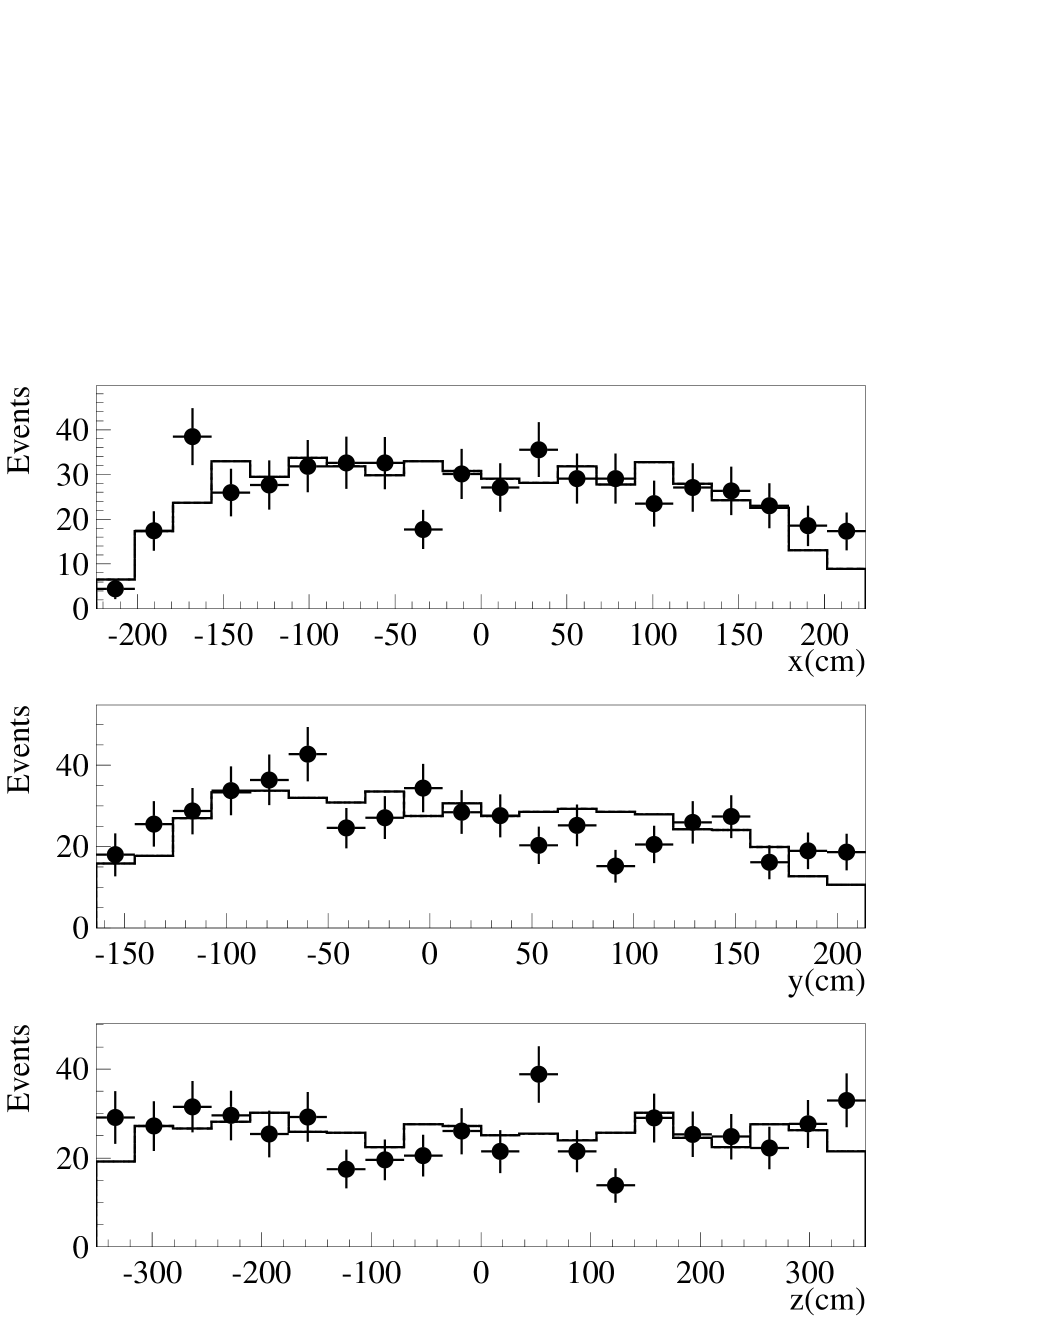
where the first error is statistical and the second is systematic. The two dominant sources of systematic error are the neutrino flux (7%) discussed in section II and the effective fiducial volume (6%) discussed in section IV. The spatial distribution of the electrons is shown in Fig. 13. The measured cross section decreases by % when the fiducial volume is reduced by requiring that the electron be at least 50 cm (instead 35 cm) from the surface of the PMT faces. For comparison the two previous measurements, the LSND result and several theoretical predictions for the flux averaged cross section are presented in Table IV. They are all in agreement with each other.
For this reaction to the ground state it is also straightforward to measure the energy dependence of the cross section. The recoil energy of the nucleus is negligible and thus where is the electron kinetic energy. Fig. 14 shows that the measured cross section agrees with the requisite energy dependence [5]. The expected shape shown in the figure includes the effects of detector resolution and acceptance obtained from the Monte Carlo. Fig. 15 shows the observed and expected [5, 25] angular distribution between the electron and the incident neutrino. The only previous measurement [26] had very limited angular acceptance.
VI Transitions to excited states of
Electrons below 52 MeV are expected to arise from four major neutrino processes: , , and neutrino electron elastic scattering. The expected energy and angular distributions of these processes are shown in Fig. 16 and Fig. 17, respectively. The different event characteristics of these reactions are used to select a sample due primarily to the reaction . This sample is then used to determine the flux averaged cross section and the electron energy and angular distributions for this reaction.
All three types of DAR neutrinos ( and ) elastically scatter off electrons in the detector but the rate is dominated by scattering [27]. The contribution due to DIF and scattering on electrons is negligible. The scattered electron for this process is strongly forward peaked as shown in Fig. 17, and thus such events can largely be eliminated with an angle cut.
A second background arises from the interaction of on 13C nuclei (1.1% of the carbon). The expected number of events obtained from the calculated cross section [28, 6] for this process is fairly small. The value is 2.1 MeV and thus about half of the background can be eliminated by requiring an electron energy below 34 MeV. We use the cross section calculated by Kubodera [28] , , and conservatively assign a 50% uncertainty to this number.
The reaction is also a source of background since the from the beta decay of is not always identified. Any event with an identified in delayed coincidence is of course excluded. The background of events with unidentified is calculated using the positron acceptance given in Table II and subtracted.
Slightly tighter selection criteria are needed for the electron in this analysis than was the case for the analysis where the requirement of an in delayed coincidence substantially reduced the background. Fig. 18 shows the measured electron energy distribution for beam-off and beam-excess events excluding identified events. For this analysis the electron energy is required to be between 20 and 34 MeV, a region that contains 58% of the expected signal. The lower limit of 20 MeV excludes beta decay induced by the capture of cosmic rays on and is enough above the 15.1 MeV from the neutral current excitation of that most events from this source are eliminated. The upper limit of 34 MeV minimizes the background from the process as well as from the possible oscillation signal [15] seen mostly above this energy.
A slightly tighter fiducial requirement is also imposed. Fig. 19 shows the distribution for beam-off and beam-excess events. The requirement cm removes the region where a large beam-off subtraction results in large statistical errors. Fig. 20 shows the distribution of the cosine of the angle between the electron and the incident neutrino. The expected distribution from all processes is also shown in Fig. 20. The requirement removes the forward peak due to scattering. The selection criteria and acceptance for this analysis are shown in Table V. The total number of beam-on and beam-excess events satisfying these criteria, the number of background events, and the resulting numbers of events and cross section for the process are shown in Table VI. The flux averaged cross section obtained from the full data sample is
.
There are several contributions to the systematic error. The 7% flux uncertainty and 6% uncertainty in the effective fiducial volume have been described previously. There is a 4% uncertainty arising from the 50% error in the cross section. The uncertainty in the acceptance for the background subtraction leads to a 5% uncertainty in the cross section. The uncertainty in the duty ratio results in a 2% error in the cross section. We also rely on the theory to obtained the fraction of events (58.2%) with electrons in the region 20 MeV 34 MeV. Cascade gammas arising from nuclear transitions contribute to the measured energy for some events and slightly increase the acceptance of the electron energy cut. There is an estimated 3% uncertainty in the cross section from this effect. An excess of events satisfying criteria for neutrino oscillation has been reported [15]. Most of this possible oscillation signal is above the 34 MeV energy requirement used in this analysis. The resulting background for the N∗ cross section would be 1 to 5% depending on the value of . The spatial distribution of events agrees well with expectations. The measured cross section decreased by % when the fiducial volume is reduced by requiring that the electron be at least 50 cm (instead of 35 cm) from the surface formed by the PMT faces. Similarly, requiring cm (instead of cm) reduces the cross section by %. Removing the explicit cut reduced the cross section by %. The flux averaged cross section measured by LSND is compared with other measurements and with theoretical calculations in table VII. The value obtained by LSND agrees well with a recent CRPA calculation [9] and with both earlier experimental results within errors [4, 2].
The total charged current cross section for interactions on can be obtained by combining the measurement presented here on transitions to with the measurement presented in section V for the process . The resulting flux averaged cross section for the process is
.
The errors given take into account the correlations between the two measurements. The dominant sources of systematic error are the neutrino flux (7%) and the effective fiducial volume (6%).
There is a clear forward peak due to neutrino electron elastic scattering in Fig. 20. A measurement of this process will be reported in a future publication after we take one more year of data. The good agreement of the observed and expected number of events in the forward peak indicates that the direction determination is reliable. For the slowly varying angular distribution for electrons from carbon interactions the angular resolution is more than adequate. The angular distribution was also measured for a sample of Michel electrons. Small systematic distortions (10%) related to the detector geometry were observered in the angular distribution. These distortions were well reproduced in the detector Monte Carlo and are corrected for in the distributions shown.
The measured and expected distributions of electron energy and cos are shown in Fig. 21 and Fig. 22, respectively for the process . The cos distribution is enhanced in the backward direction as expected [6, 25]. The backward peaking of the angular distribution is largely a result of the negative parity of the N∗ states expected to contribute, levels at 1.20 and 4.14 MeV and levels at 6.40 and 7.68 MeV. The angular momentum transfer to the A12 system favors momentum transfer of approximately 100 MeV/c, and hence the backward peaking.
VII Neutron analysis
The electron event samples were also analyzed to determine the fraction of events with an associated neutron. The presence of a neutron is determined by detection of the from the reaction , using the procedure discussed in section IV. No neutron production is associated with two of the reactions previously discussed, and neutrino electron elastic scattering. Further, there are kinematic constraints on neutron production by the interaction of DAR on and . Neutron production is not possible for and , respectively, for electron energies above 21 and 31 MeV. Nevertheless, the neutron analysis provides a useful check on our understanding of the sources of inclusive electrons in our data samples.
The distribution of the likelihood ratio R for correlated s from neutron capture is very different than for uncorrelated (accidental) s as shown in Fig. 5. The measured R distribution for a data sample can be fit to a mixture of the two sources of s to determine the fraction of events with a neutron. Fig. 23 shows the R distribution for the clean sample of beam-excess events, discussed in Section V, for which neutron production is not possible. The best fit, also shown, corresponds to a fraction of events with a neutron of % and thus agrees well with expectations.
The sample of inclusive electron events discussed in Section VI was also analyzed for neutron production. To enhance the sensitivity to possible sources with neutrons, the requirement was imposed. This eliminated most neutrino electron elastic scattering events. Similarly, events with identified decays were excluded. Fig. 24(a) shows the R distribution for the beam-excess sample. The fraction of events with neutrons obtained from the fit to this distribution is %. Thus there cannot be a significant background in the sample due to any source of events with associated neutrons.
A similar analysis for events in the beam-off data sample provides an improved understanding of the sources of cosmic ray backgrounds. High energy cosmic ray neutrons which enter the detector will occasionally produce “electron like” events which satisfy the electron particle ID criteria. The magnitude of this neutron background is very sensitive to the requirement on as can be seen in Fig. 3. For the physics analysis in this paper the relatively loose criteria has been used. The cosmic ray neutron component can be independently determined from the R distribution since the neutrons eventually thermalize and produce capture s. Fig. 24(b) shows the R distribution for the beam-off sample. The fraction of events with neutrons obtained from the fit to this distribution is %. If we apply a tighter particle ID criteria, , the neutron component is reduced to %.
Thus the cosmic ray neutron component can be identified both from the particle ID parameter, , obtained from the fit to the primary event and from the likelihood ratio R. Fig. 25(a) shows the distribution for all beam-off events in the sample. The distribution for events with R 30, shown in Fig. 25(b) , is very different. These events should arise predominately from cosmic ray neutron interactions and, indeed, their distribution is very similar to the distribution for neutrons shown in Fig. 3 for the region of concern, . A better procedure than simply requiring R 30 is to use the R information to extract the distributions for the correlated and uncorrelated components. The distribution for the uncorrelated component, shown in Fig. 25(c), is similar to that obtained from Michel electrons except for a small excess at high . The distribution for the correlated component, shown in Fig. 25(d), agrees with the distribution expected for cosmic ray neutrons. Thus there are two main types of cosmic ray events that pass the selection criteria: (1) events due to electron or photon interactions followed only by uncorrelated photons and (2) events due to cosmic ray neutron interactions. Further, the cosmic ray neutron component can be reduced to a low level by applying a tight particle ID requirement as is done in the oscillation search [15]. This study of the beam-off events is useful as a test of the analysis technique and our understanding of the backgrounds and detector response. It should be emphasized, however, that the physics analysis presented in sections V and VI depends on the highly reliable beam-off subtraction procedure to remove the cosmic ray background that survives the event selection criteria.
VIII Conclusions
The process has been measured with a clean sample of 500 events for which both the and the from the beta decay of the are detected. For this process cross section calculations using empirical form factors are expected to be very reliable. The flux averaged cross section is measured to be in good agreement with other experiments and theoretical expectations. The angular and energy distributions of the electron also agree well with theoretical expectations.
The process has also been measured. There are larger uncertainties in this calculated inclusive cross section than for the transition. The flux averaged cross section is found to be , in agreement with a recent CRPA calculation and earlier but less precise experimental results as shown in Table VII. The energy and angular distributions are also consistent with theoretical expectations.
Acknowledgments
The authors gratefully acknowledge the support of Peter Barnes, Cyrus Hoffman, and John McClelland. It is particularly pleasing that a number of undergraduate students from participating institutions were able to contribute to the experiment. We acknowledge many interesting and helpful discussions with Edwin Kolbe and Petr Vogel. This work was conducted under the auspices of the US Department of Energy, supported in part by funds provided by the University of California for the conduct of discretionary research by Los Alamos National Laboratory. This work is also supported by the National Science Foundation. We are particularly grateful for the extra effort that was made by these organizations to provide funds for running the accelerator at the end of the data taking period in 1995.
| Quantity | Criteria | 1994 Eff. | 1995 Eff. |
|---|---|---|---|
| Fiducial Volume | D35.0 cm | ||
| Electron Energy | MeV | 0.005 | 0.005 |
| Particle ID | |||
| Intime Veto | PMTs | ||
| Past Activity | |||
| DAQ Dead time | |||
| Total |
| Quantity | Criteria | 1994 Eff. | 1995 Eff. |
|---|---|---|---|
| decay time | |||
| Spatial Correlation | r | ||
| PMT Threshold | 100 for 1994, 75 for 1995 | ||
| Fiducial Volume | D0 cm | ||
| Trigger Veto | |||
| Intime Veto | PMTs | ||
| DAQ Dead time | |||
| Total |
| 1994 | 1995 | |
| Beam-on Events | 241 events | 308 events |
| Beam-off Events Duty Ratio | events | events |
| Beam-excess Events | 226 events | 289 events |
| Accidental Background | 3.3 events | 4.2 events |
| Efficiency | 0.216 | 0.256 |
| flux | ||
| Experiment | |
|---|---|
| LSND | |
| E225[2] | |
| KARMEN[3] | |
| Theory | |
| Donnelly[6] | |
| Fukugita et al.[5] | |
| Kolbe et al.[9] | |
| Mintz et al.[7] |
| Quantity | Criteria | 1994 Eff. | 1995 Eff. |
|---|---|---|---|
| Fiducial Volume | D35.0 cm | ||
| Vertical Position | -120.0 cm | ||
| Direction Angle | cos | ||
| Electron Energy | MeV | 0.006 | 0.006 |
| Particle ID | |||
| Intime Veto | PMTs | ||
| Past Activity | |||
| DAQ Dead time | |||
| Total |
| 1994 | 1995 | |
|---|---|---|
| Beam-on Events | 695 events | 689 events |
| Beam-excess Events | 302.5 events | 357.8 events |
| elastic background | 4.2 events | 4.8 events |
| 13C background | events | events |
| background | events | events |
| events | events | |
| Experiment | |
|---|---|
| LSND | |
| E225[2] | |
| KARMEN[3] | |
| Theory | |
| Donnelly[6] | |
| Kolbe et al.[9] |


(a) , (b) ,
(c) and (d) e elastic scattering.


REFERENCES
- [1] S. E. Woosley et al., Astrophys. J 356, 272 (1990), E.Kolbe et al., Nucl. Phys. A 540, 599 (1992)
- [2] D. A. Krakauer et. al. Phys. Rev. C 45, 2450 (1992).
- [3] B. E. Bodmann et. al. Phys. Lett. B 332, 251 (1994).
- [4] G. Drexlin, KARMEN Collaboration, data presented at the Nuclear Physics Spring Meeting of the DPG, March 1995.
- [5] M.Fukugita et al. Phys. Lett. B 212. 139 (1988)
- [6] T. W. Donnelly and R. D. Peccei, Phys. Rep. 50, 1 (1979). T. W. Donnelly, Phys. Lett. B43, 93 (1973).
- [7] S. L. Mintz and M. Pourkaviani, Phys. Rev. C 40, 2458 (1989). S. L. Mintz, J. Phys. G 16, 569 (1990).
- [8] J. Bernabeu and P. Pascual, Nucl. Phys. A 324, 365 (1979)
- [9] E. Kolbe, K. Langanke, S. Krewald, Phys. Rev. C 49, 1122 (1994).
- [10] M. Albert et. al. Phys. Rev. C 51, 1065 (1995).
- [11] H. J. Kim, LSND Collaboration, XIV International Conference on Particles and Nuclei(PANIC 96), May 1996.
- [12] Y. Umino et. al. Phys. Rev. Lett. 74, 4993 (1995).
- [13] E.Kolbe et. all.,Phys. Rev. C52, 3437(1995)
- [14] C. A. Athanassopoulos et. al., to be submitted to Phys. Rev. C.
- [15] C. A. Athanassopoulos et. al., Phys. Rev. C 54, 1359 (1996).
- [16] C. A. Athanassopoulos et. al., to be published in Nucl. Instrum. Methods.
- [17] S. Willis et. al. Phys. Rev. Lett. 44, 522 (1980).
- [18] S. J. Freedman et. al. Phys. Rev. D 47, 811 (1993).
- [19] R. C. Allen, et. al. , Nucl. Instrum. Methods A 284, 347 (1989).
- [20] R. L. Burman, M. E. Potter, and E. S. Smith, Nucl. Instrum. Methods A 291, 621 (1990).
- [21] R. A. Reeder et. al. , Nucl. Instrum. Methods A 334, 353 (1993).
- [22] J. Napolitano, et. al. , Nucl. Instrum. Methods A 274, 152 (1989).
- [23] K. McIlhany, et. al. , Proceedings of the Conference on Computing in High Energy Physics, April 1994, LBL Report 35822, 357 (1995).
- [24] F. Ajzenberg-Selove, Nucl. Phys. A 506, 1 (1990).
- [25] E. Kolbe, Phys. Rev. C, in press.
- [26] R. C. Allen, et. al. , Phys. Rev. Lett. 64, 1871 (1990).
- [27] R. C. Allen, et. al. , Phys. Rev. D 47, 11 (1993).
- [28] M. Fukugita, et. al. , Phys. Rev. C 41, 1359 (1990).