K+ production in the reaction 58Ni+58Ni at incident energies from 1 to 2 AGeV
Abstract
Semi-inclusive triple differential multiplicity distributions of positively charged kaons have been measured over a wide range in rapidity and transverse mass for central collisions of 58Ni with 58Ni nuclei. The transverse mass () spectra have been studied as a function of rapidity at a beam energy 1.93 AGeV. The distributions of K+ mesons are well described by a single Boltzmann-type function. The spectral slopes are similar to that of the protons indicating that rescattering plays a significant role in the propagation of the kaon. Multiplicity densities have been obtained as a function of rapidity by extrapolating the Boltzmann-type fits to the measured distributions over the remaining phase space. The total K+ meson yield has been determined at beam energies of 1.06, 1.45, and 1.93 AGeV, and is presented in comparison to existing data. The low total yield indicates that the meson can not be explained within a hadro-chemical equilibrium scenario, therefore indicating that the yield does remain sensitive to effects related to its production processes such as the equation of state of nuclear matter and/or modifications to the K+ dispersion relation.
, , , , , , , , , , , , , , , , , , , , , , , , , , , , , , , , , , , , , , , , , , , , , , , , , , , , , , , , , , , , ,
1 INTRODUCTION
One of the main topics addressed in the study of relativistic nuclear collisions is the question whether hadronic properties undergo modifications in an environment of hot and dense nuclear matter. In particular, theoretical predictions indicate that the self energy, or effective mass, of hadrons may change in an environment of high density and temperature [1]. Indeed, recent results collected via leptonic probes at the SPS/CERN [2, 3] have been interpreted [4] as evidence that the mass of the meson has dropped by a large fraction of its vacuum mass in the measured system. To address this topic via the much more abundant hadronic observables requires a detailed understanding of how the chosen probes propagate through the dynamically expanding system after the moment of highest density has been attained. In this context the behavior of particles with strange quark content have attracted much theoretical and experimental attention for some time [5]. Due to the small elastic cross-section ( mb) and the conservation of strangeness in the strong interaction, the yield and phase space distributions of mesons have been considered a promising tool to probe the dense matter formed in the initial stage of the collision [6]. Furthermore, numerous calculations show that K+ meson production in nucleus-nucleus collisions is intimately related to the mean potential or the self-energies of the kaons in dense nuclear matter [7]. Such modifications to the in-medium properties of K+ mesons are also predicted to persist at beam energies of 1 to 2 AGeV where baryonic densities of up to 3 times normal nuclear matter is expected to be reached in the initial stages of the reactions. At these beam energies which are near to or below the K+ meson production threshold in free nucleon-nucleon collisions, kaon production in first chance nucleon-nucleon collisions is suppressed. As a result transport model calculations for nucleus nucleus collisions indicate that the K+ meson yield and spectra are very sensitive to the nuclear equation of state (EOS) [8]. Primarily this is because the yield is strongly dependent on the rate of multi-step processes which increases rapidly with increasing density. However, for lighter systems above threshold it is expected that the EOS has little effect on the K+ meson yield [9, 10]. Instead, the dominating factor here is the effective threshold for K+ production in any individual baryon-baryon collision, which is sensitive to the kaons in-medium properties such as its dispersion relation.
In an effort to collect evidence on whether changes to the K+ meson’s properties in a high baryon density region can be confirmed, collisions of 58Ni with 58Ni nuclei have been measured near the free nucleon-nucleon production threshold. After a short description of the experimental device and the method of particle identification, the K+ meson differential cross sections are presented as a function of transverse mass and rapidity, thereby allowing a sensitive test of the extent to which the available phase space is evenly populated. These data are compared to a similar analysis of and proton distributions [11]. Next the total K+ meson multiplicity is estimated and presented as a function of the beam energy. These results are compared to predictions within a thermal model and discussed in the context of transport model calculations. Finally, the results are summarized.
2 EXPERIMENTAL SETUP
2.1 Detector
Collisions of the nuclei 58Ni on 58Ni have been measured at incident energies of 1.06, 1.45, and 1.93 AGeV by the FOPI detector at the SIS accelerator at GSI/Darmstadt. The FOPI detector is a highly modular system of several subdetectors for fixed target experiments [12, 13]. It consists of 2 main parts, each with nearly complete azimuthal symmetry. One main component is the highly segmented Forward Wall (FW) which covers the polar angles between over the full azimuthal range. It provides the energy loss and position information in addition to a Time–of–Flight (ToF) measurement, thus allowing velocity and charge determination. This setup is supplemented by the Central Drift Chamber (CDC), a cylindrical tracking detector covering an additional range of polar angle from . The CDC is a drift chamber of the jet type which operates at atmospheric pressure and is 200 cm long with inner and outer radii of 20 and 80 cm respectively. In the azimuthal direction, the chamber is divided into 16 sectors each containing 60 sense wires. For charged particles, each sense wire provides an accurate measurement of the radial and azimuthal (r and ) coordinates via the recorded drift time ( m) and a less precise measurement of the z coordinate along the beam axis by charge division cm for minimum ionizing particles. The CDC operates inside a magnetic field of 0.6 T produced by a superconducting solenoid thus allowing the momentum of charged particles to be determined. The transverse momentum resolution () has been determined by simulations with the GEANT package [14] to be about 4% for GeV (c1) and worsens to 9% near GeV [15]. The polar angle resolution is better than . Furthermore, the CDC provides a multiple sampling of the specific energy loss with a relative energy resolution ()/ of about 15% for minimum ionizing particles.
2.2 Particle Identification
Although negative pions can be unambiguously identified at all momenta by the direction of curvature in the magnetic field ( mesons are neglected here since their relative yield is on the level), the identification of positively charged particles in the CDC relies on the Bethe–Bloch relation of the mean energy loss of a track with its laboratory momentum . As a result, mesons can only be identified up to MeV where the of the much more numerous protons approaches that of the pions. In order to enhance the particle identification capabilities of the CDC, the tracks are extrapolated to the Scintillator and Čerenkov array (Barrel) that surrounds the CDC and matched with the appropriate Barrel hit. The Barrel covers the polar angular range of and has a time of flight resolution of about ps over the full length of the detectors. During the measurements reported on here only one third of the total azimuthal range was covered by the Barrel. The velocity is determined by dividing the path length as measured with the CDC by the time of flight from the Barrel.
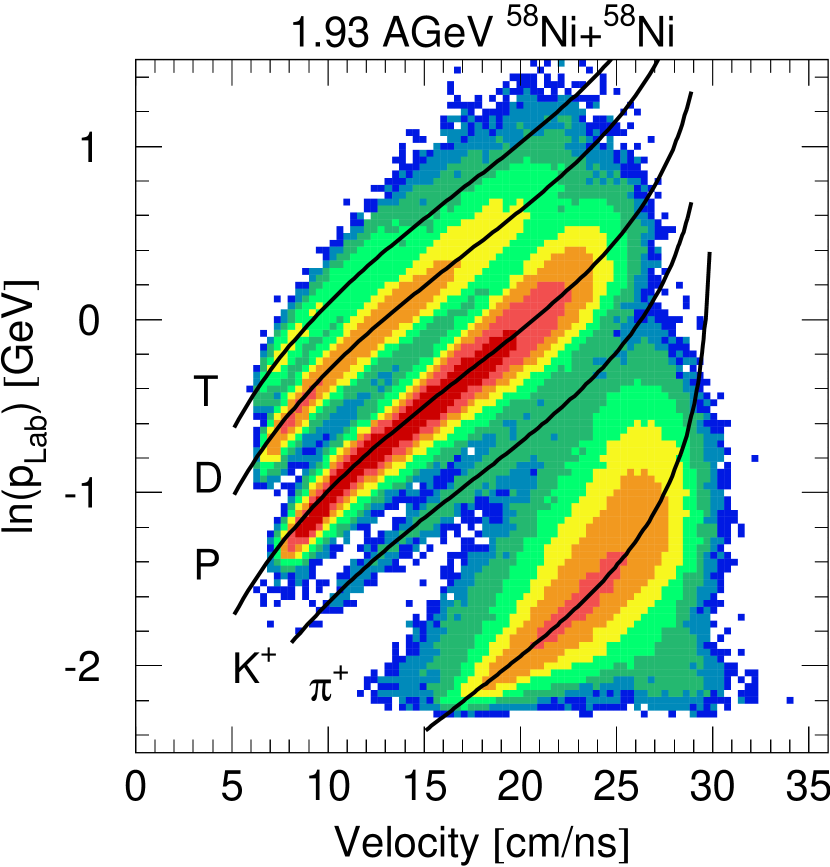
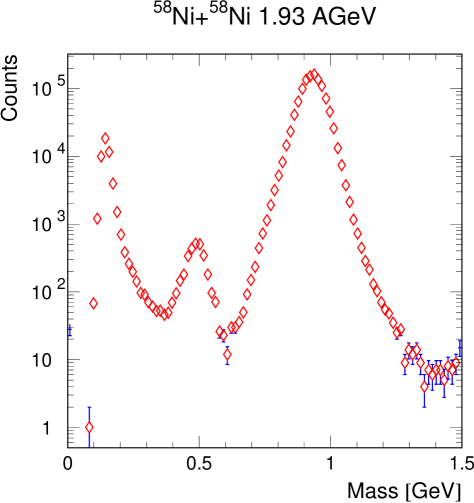
Particles of different charge are distinguished by combining the information with the velocity. After selecting charge +1 particles, the natural logarithm of is shown plotted as a function of the velocity in Figure 1. In this figure lines corresponding to pions, protons, deuterons, and tritons are clearly resolved over the full velocity range. In addition a line between the pions and the protons is visible which results from the K+ mesons. After an upper limit of MeV has been applied, the mass spectrum is obtained as shown in Figure 2. A peak at the kaon mass of 494 MeV is clearly visible above a background arising from the and proton peaks. A total of about 3000, 500, and 120 K+ mesons have been identified within the 2.6106, 1.4106, and 1.5106 central events collected at beam energies of 1.93, 1.45, and 1.06 AGeV, respectively. Further details on the particle identification procedure and the acceptance investigations can be found in Ref. [13, 16].
The strength of the FOPI detector is its ability to simultaneously measure large regions of phase space. However, to insure clean K+ meson identification, only kaons within the acceptance of the Barrel sub-system have been analyzed. To illustrate which region of phase space has been analyzed, the transverse momentum () versus rapidity () is plotted for K+ mesons in Figure 3. As denoted by the solid line in this figure, the acceptance of the Barrel starts at a laboratory polar angle of 44∘. The upper momentum at which K+ mesons can be cleanly identified is about 500 MeV which is marked by the dashed curve. The population at lower momenta is suppressed because the kaon lifetime ( cm) [17] is of the same order as the typical flight path of about 125 cm. In addition, an absolute lower transverse momentum limit of 100 MeV exists since the 0.6 T solenoidal magnetic field prevents particles with lower from reaching the Barrel. For comparison, the arrows mark the location of mid-rapidity at the beam energies studied here.
2.3 Event Selection
An ensemble of events with emphasis on small impact parameters (b) has been collected. The event selection criterion exploited the strong correlation between the impact parameter and the total particle multiplicity (PMUL) observed in the reaction between . The connection of PMUL to b is made by taking the differential cross section to be a monotonous function of , whereby the observed cross section has been determined from the integrated beam luminosity, the target thickness (225 mg/cm2), and the data acquisition deadtime. The events analyzed here were taken from the 350 mb with the highest PMUL, which would correspond to b less than 3.3 fm within a sharp cutoff model. The actual ensemble however, includes events with considerably higher b due to the large multiplicity fluctuations in this small system. In order to facilitate the comparison of these results with other experiments and theoretical predictions, an often used convention is followed in which the average number of nucleons with geometrical overlap () has been calculated [18]. After taking the b fluctuations into account, the mean value is estimated for the central events investigated here.
3 RESULTS
3.1 Transverse Mass Spectra
The differential multiplicity distribution of K+ mesons has been measured in a wide range of rapidity and and corrected for in-flight decay as well as known detector acceptance effects. In order to facilitate comparisons of results collected at different beam energies the scaled rapidity () is used, where target rapidity is at -1 and midrapidity is at 0. Since these data show no significant azimuthal anisotropy [19], this degree of freedom has been integrated and the results are presented as a function of the transverse mass () and rapidity. This representation has been chosen because a thermal Boltzmann source would produce spectra of the following simple form for a narrow window in rapidity :
| (1) |
where both the Boltzmann inverse slope parameter () and the intercept () are functions of rapidity. For a given isotropic thermal source of temperature T, the values are not constant, but instead possess the following functional dependence on rapidity:
| (2) |
Figure 4 shows the measured positive kaon spectra as a function of () for several rapidity slices in units of . These data were collected for central events (see Sec 2.3) of 58Ni+58Ni collisions at 1.93 AGeV. The lowest spectrum corresponds to the highest rapidity value, and the th spectrum has been multiplied by 10n starting with at the most central rapidity window. Within the detector acceptance and the statistical fluctuations, the spectra are well described by the exponential functions above. Each spectrum has been fit with this function and the results are represented by the dashed lines in Figure 4. The overall distribution of per degree of freedom is between 0.5–2; however, estimates of the total yield (in the following section) must take into account the negative correlation between the two parameters and . Since this procedure is carried out at many narrow rapidity intervals, both and have been determined as functions of rapidity, and the values are listed below in Table 1.
The proton and spectra have also been studied [11]. While the protons can be well described by a single exponential in all rapidity intervals, the pion spectra exhibit a concave shape, which can be described by the sum of two such exponential functions with inverse slope parameters and for the softer and stiffer components, respectively. The inverse slope parameters of the K+ mesons, protons, and both pion components are plotted together in Figure 5 for the different rapidity slices. The symbols of the left indicate the measured data which have been reflected onto the right side for symmetry reasons. At midrapidity the proton slopes are higher than the pion. This observation may indicate that the system contains a collective expansion velocity in addition to a thermal component. The magnitude of the K+ meson slopes near target rapidity is similar to or lower than the proton slopes, which is qualitatively in agreement with the midrapidity results from the KaoS collaboration [20], but in contrast to the somewhat harder K+ than proton spectra as obtained by Schnetzer et al. in the system Ne+NaF at 2.1 AGeV [21].
Away from midrapidity () the measured inverse slope parameters of all particles decrease with increasing . For the pions, the rapidity distribution of the values follow the function in Eq. 2 for , in agreement with isotropic emission from a source at midrapidity. This shape however is rather insensitive to the presence or absence of radial flow due to the small pion mass. The pion’s distribution is somewhat flatter than expected from Eq. 2, which is in agreement with suggestions that this component is governed primarily by the decay kinematics of the resonance [22]. On the other hand, the proton distribution (open circles) is noticeably narrower than the dependence which is shown by the solid line in Fig. 5, thus indicating a more complex source behavior. The distribution for the K+ mesons has a form similar to that of the protons indicating significant elastic K+N scattering.
3.2 Rapidity Distributions
In order to determine the multiplicity density , the exponential fits to the double differential yields are integrated from to . This integral can be expressed in the following closed form:
| (3) |
with /m. The statistical error for (standard deviation) is evaluated from the uncertainty of the right term of this formula using the variances and covariances of and . The values for mesons which have been determined by this procedure are presented in Table 1 together with the parameters. The values quoted include the statistical and systematic uncertainties (see Sec. 3.4), respectively.
| (MeV) | |||
|---|---|---|---|
| -1.2 | |||
| -1.0 | |||
| -0.8 | |||
| -0.6 |
The rapidity distributions of positive kaons are shown in Figure 6 in comparison to the and proton results. Again the measured points on the left side have been reflected around midrapidity. The dashed lines represent the expected distribution for a purely thermal source located at midrapidity, and the solid lines shown in this figure represent the expected distribution for a radially expanding thermal source [23], which has been shown to be an essential component to describe the energy and rapidity spectra (see e.g. [24, 25]). In this case the temperature (T=92 MeV) and flow velocity (=0.32) parameters were determined by a simultaneous fit to the , proton, and deuteron midrapidity spectra [11] and the yield was normalized to the data.
The distributions for the produced particles ( and K+) are well reproduced by the two curves showing a thermalized source both with and without a radial flow component. In contrast, the non-thermal behavior of the protons is very noticeable. Although the increased width of the proton rapidity distribution may be reproduced by allowing for either significant transparency or longitudinal flow, the increase is most probably a result of so called “Halo” effects which arise from the coarse centrality selection available in this rather small system (Ni+Ni) due to the large fluctuations of the observed particle multiplicity.
3.3 Total Production Probability
The total production probability of pions and protons over the full phase space has been determined at all three beam energies by integrating the respective spectra. However, for K+ mesons this direct method was not possible at the lower beam energies because the recorded statistics were insufficient to perform the above mentioned differential analysis to obtain , and at the highest energy (1.93 AGeV) because mid-rapidity was not covered. Therefore, to determine the total multiplicity, the form of the K+ phase space distribution has been taken from an isotropic, radially expanding source with the temperature and flow velocity parameters determined from the mid-rapidity pion, proton, and deuteron spectra at each beam energy as quoted above. With decreasing beam energy, this resulted in a detection efficiency that increased from about 5% to 10% of the total yield in the backward hemisphere, without including decay losses. In support of this assumption of the source shape we have added the midrapidity data from the KaoS collaboration to Figure 6 as the filled triangle [20]. Since the KaoS measurement was taken at 1.8 AGeV, their result for an equivalent centrality selection was increased by 45% using the following scaling:
| (4) |
where the exponent of the beam energy was determined to be from the K+ excitation function discussed below.
The total K+ meson multiplicity in the central events measured here are listed in Table 2. In order to facilitate the comparison of these exclusive results with other experimental data, the yield is expressed relative to the mean number of participating nucleons .
| 1.060 AGeV | (4.41.1) |
|---|---|
| 1.450 AGeV | (2.60.65) |
| 1.930 AGeV | (1.10.28) |
The data in Table 2 have thus been scaled by a factor (see Section 2.3). The errors quoted in this table are dominated by the systematic uncertainty in the extrapolation over the full phase space.
For comparison, these data values have been plotted in Figure 7 together with the Ni + Ni results from the KaoS collaboration [20]. The KaoS results which were obtained in a narrow window at mid-rapidity have been scaled by the reaction cross section (2.71 b) and by the mean number of participating nucleons, which is for an inclusive measurement of a symmetric system within a geometric model [18]. Although this normalization of the yield by is quite successful for pions in small and medium mass systems [26], for large systems (Au) at sub-threshold energies [27] this ratio does vary with centrality for K+ mesons. The dashed line in this figure shows a fit with the function presented in Equation 4 which results in an exponent . The solid line marks the expected production rate from the empirical scaling presented by V. Metag [28] after multiplying the abscissa by the K+ free production threshold. This curve essentially shows the pion production rate that would be expected if it had the same free production threshold as the K+ meson. The data clearly lie below this curve; however with increasing beam energy (from 1 to 2 AGeV) the magnitude of the discrepancy is reduced by a factor two. This large deviation of the K+ yield from the scaling is a first indication that the kaons do not go through a state of chemical equilibrium at these beam energies.
3.4 Systematic Errors
The uncertainties shown in figures 4-6 are statistical errors, and errors smaller than the symbol size are not shown. The systematic error on the inverse slope parameters is about 10%, which is largely due to the rapidity binning and the range of used in the fitting procedure, as well as uncertainties arising from the poor polar angle resolution. The systematic errors for the results vary with rapidity and are estimated to vary from 13% to 20%. This comes from errors in tracking efficiencies (10%), particle identification (2%), and from the extrapolation procedure (from 8% to 15% with increasing rapidity). These errors are assumed to be incoherent. Tracking efficiency was obtained both by comparing the results of visual scanning of several hundred events with the output of the tracking program [16], and by comparing the results of several different tracking algorithms based on local and global tracking methods respectively [15]. The errors for particle identification are estimated from variations made in the software selections. The systematic uncertainty arising from the extrapolation procedure of the measured spectra over the full range was estimated by comparing the total yield of all charged reaction products (up to 4He) to the initial 58Ni nuclei. Although only 57% of the total charge was actually measured, after the extrapolation procedure, the total charge was reproduced to within 5%.
The background estimation for the K+ meson spectra has been performed as follows: The mass spectra have been investigated in the measured laboratory momentum range of 100 to 500 MeV with a binning of 20 MeV. Since the structure of the background is not precisely known, a worst case analysis has been applied. Since the form of the mass spectrum (see Fig. 2) between any particle pair is concave, an upper limit of the background contribution is estimated by connecting the minimum between the proton and the K+ meson peaks with the minimum between the K+ and the peaks using an exponential function. The integration of this exponential over the range from the K+ peak gives an upper limit of the background contribution to the kaon yield. This contribution is negligible below 400 MeV then rises sharply to reach 20% at 500 MeV. In comparison, the correction for the in-flight decay of the K+ is assumed to introduce little systematic error since the lifetime is very well known and the measured fraction increases from 45% at a laboratory momentum of 200 MeV to over 70% at 500 MeV.
4 DISCUSSION
This section begins with an attempt to determine the extent to which the K+ mesons deviate from uniform phase space population. This is important because a system that goes through a phase of equilibrium loses much information about the specific production processes prior to when the particle has decoupled from its surrounding environment. Following this, the results from several theoretical models are compared to these measurements in an attempt to determine whether any modification of the K+ meson’s properties during the dense stage of the reaction can be inferred from these data.
4.1 Approach to Equilibrium
To address the question to what extent at least a part of the system
is in thermal equilibrium, the following observations on the phase
space distributions can be drawn from the data presented here:
Globally the nucleons display large deviations from isotropic thermal
behavior. However, the proton’s elongated distribution
by itself is not sufficient to differentiate whether the nucleons can
be described in terms of a single component that is only partially
stopped (or fully stopped followed by longitudinal expansion) in the
collision, or if it is more appropriate to consider a two component
description where a sub-set of the initial system goes through a state
approaching thermal equilibrium, and the remainder proceeds relatively
unaffected by the collision. However, the high for protons at
midrapidity and the rapid drop with increasing normalized rapidity favor
the two-component description since transparency or longitudinal
expansion would rather lead to a wider distribution.
Taking the softer component of the pions to be primarily a result of
the decay kinematics, the remaining pions (hard component)
near mid-rapidity have and distributions that are
consistent with a state close to thermal equilibrium.
The K+ mesons have a similar distribution to the protons
indicating that rescattering plays a significant role, and as a result
the momentum distribution may remain sensitive to the propagation of
the kaons in the dense medium as discussed below.
These observations are thus consistent with a picture where a portion
of the initial nucleons are stopped at mid-rapidity, building a
roughly thermalized system which is surrounded by the remaining cooler
nucleons which remain close to beam rapidity.
The next step is to determine whether the measured particle yields are consistent with expectations for a mid-rapidity source which is also in chemical equilibrium. Taking the formalism used in reference [29], the particle ratios such as K+/nucleon can be calculated including finite size effects and directly compared to the measured values in Table 2. The necessary parameters have been determined as follows: the degeneracies from spin and isospin are for the nucleons and for the kaons (only K+ are under consideration). The temperature (92 MeV) and the Baryon chemical potential ( GeV) have been extracted from the measured data [11, 30]. The strangeness chemical potential can be calculated within the model by itself (for a given and ) by requiring strangeness conservation, i.e. the total density of particles with quarks must equal the density of particles with quarks (i.e. ). For this and , a value GeV results 111 Alternatively, can be deduced by the ratio K-/K. Taking the measured ratio K-/K+ to be 0.03 [31], then GeV.. With this set of parameters the measured pion yield can be well reproduced. Furthermore, the production of the meson, which has a similar free production threshold as the K+ meson, has also been measured in the same system (58Ni + 58Ni at 1.9 AGeV) [32]. Here too the relative yield of the can be understood in terms of chemical equilibrium. In contrast to the non-strange mesons however, the corresponding ratio K+/nucleon = 3% is in strong disagreement with the measured result of 0.11% at 1.93 AGeV. Variation of these parameters within reasonable boundaries such that the spectra remain well described can reduce the expected K+/nucleon ratio by at most a factor of 2, which still leaves an order of magnitude discrepancy to the data.
This interpretation of the positive kaon yield in terms of the approach toward an equilibrium value is also reflected in the kaon excitation function. The suppression of the K+ yield below that of the empirical scaling shown in Figure 7 is observed to decrease by more than a factor of two with increasing beam energy over the range covered here. This convergence is consistent with qualitative expectations that with increasing beam energy the K+ meson source increases in temperature and density, thus reducing the relaxation time and allowing the source to come closer to its equilibrium value. Similarly, this interpretation might provide an alternative explanation for the observed rise of the K ratio with source size as observed at both SIS and AGS energies [20, 33] without having to introduce a change of the in-medium kaon mass [34, 35].
To summarize this discussion the following conclusions can be drawn: the momentum distribution of K+ mesons seems to have a large influence from elastic scattering with the surrounding nucleons, and the total K+ yield is irreconcilable with a state that is also in chemical equilibrium.
4.2 Microscopic Model Calculations
These observations provide the basis from which details of the K+ meson production processes might be extracted. However, due to the complex nature of the system under discussion, it appears necessary to compare the experimental results with microscopic transport model calculations in order to separate effects arising from the behavior of kaons in the initial, compressed state from the dynamics of the later expanding stages. Several of the models that exist have been used to calculate K+ meson production in the system 58Ni+58Ni at 1.93 AGeV. For instance, the IQMD model [36] predicts that the kaons are produced with relatively small momenta (mainly due to the limited phase space) and then on average gain energy by elastic scattering with the surrounding baryons thereby hardening the K+ spectra and widening the distribution. In fact, RBUU calculations of this system with an impact parameter b=2 fm suggest that a K+ suffers on average over 2 elastic scatterings after its production [37]. Thus, the similarity between the measured K+ and proton slopes shown in Figure 5 seems to indicate a considerable amount of elastic scattering of K+ mesons with the nucleons even in this relatively small system. Despite this rescattering, the K+ mesons should remain sensitive to the dense stage of the reactions since within the QMD studies more than 60% of the positive kaons have their last interaction at a density greater than normal nuclear matter density. In order to make a more detailed comparison of the data with these various model predictions, the theoretical calculations must be subject to the appropriate experimental filter in order to account for more subtle aspects of the detector’s acceptance and efficiency.
The total K+ meson yield has also been studied. However it has been predicted that the sensitivity to the EOS is greatly reduced in this rather small system size at the highest energy presented here [9]. Instead, a more sensitive measure of the EOS might be obtained by trying to reproduce the shape of the kaon excitation function. In fact it has been suggested that the sub-threshold K+ meson yield is sensitive not only to the bulk compressibility of nuclear matter, but also to details in the shape of the EOS, for instance the existence of density isomers [38]. Within these microscopic model calculations a jump in the excitation function by up to an order of magnitude might be expected. However, the K+ meson excitation function shown in Fig. 7 exhibits a smooth increase by over two orders of magnitude as the beam energy is varied from deep sub-threshold to well above the free production threshold. Since no such discontinuity is seen in the data, the existence of density isomers can not be confirmed.
At this point a large amount of freedom still remains in a number of input parameters to the theoretical calculations, for example the cross sections of various meson-baryon and baryon-baryon collisions. In order to overcome this uncertainty in the predictions of the K+ meson yield, it has been suggested that other aspects of the phase space distribution may also retain information on the kaon properties during the dense stage of the reaction for instance the K+ sideward flow may be sensitive to the kaon potential in the dense nuclear medium [39]. In fact, calculations [40] that have been compared to our data [19] would imply that the K+ mesons do indeed feel a only weakly repulsive potential, implying that there is a very attractive scalar component in this dense nuclear medium. Other approaches however are able to reproduce the measured flow values without having to introduce potentials [41].
5 SUMMARY
In this paper the production of positive kaons in central collisions of 58Ni+58Ni with beam energies from 1 to 2 AGeV has been presented. At the highest energy the spectra of the K+ mesons can be described by single component Boltzmann functions. The inverse slope parameters are similar to the protons and the spectra are compatible with the hypothesis of a thermal source with temperature 92 MeV and radial expansion velocity which describes the pion, proton, and deuteron mid-rapidity spectra. The K+ meson excitation function rises smoothly, in agreement with other measurements of Ni + Ni. The magnitude of the yield however is far below that expected for a system in chemical equilibrium. This non-equilibrium behavior is an important prerequisite to extract details about the production processes from the particle spectra in the final state. In an attempt to distinguish production from propagation effects, transport models have been employed. Despite the expected sensitivity of some observables (e.g. sub-threshold kaon yield to the EOS), it has been seen that other effects can influence these observables by a similar magnitude. Thus an analysis of the sideward flow could be very useful to determine the magnitude of the mean potential felt by the kaons in the dense nuclear medium. Although it is not yet possible to unambiguously conclude whether the kaon mass changes in a system of high density, an even greater sensitivity is expected with the negative kaon results [42].
ACKNOWLEDGMENTS
We would like to dedicate this work to the memory of V. L. Krylov who played a central role in the design and construction of the BARREL detector.
Furthermore we gratefully acknowledge the many useful discussions with G. E. Brown, C. Hartnack, S. W. Huang, G. Q. Li, and P. Senger, as well as the important comments from P. Braun-Munzinger.
This work has been supported in part by the German Bundesministerium für Forschung und Technologie under contracts 06 HD 525 I(3), X051.25/RUM-005-95 and X081.25/N-119-95 and by the Polish State Committee of Scientific Research (KBN) under grants 2 P302 1104 and 2 P03B 019 11.
References
- [1] For a recent review see e.g. C. M. Ko and G. Q. Li, J. Phys. G: Nucl. Part. Phys. 22 (1996) 1673.
- [2] G. Agakichiev et al., Phys. Rev. Lett. 75 (1995) 1272.
- [3] M. Masera et al., Nucl. Phys. A590 (1995) 93c.
-
[4]
G. Q. Li, C. M. Ko, and G. E. Brown, Phys. Rev. Lett. 75 (1995) 4007;
W. Cassing et al., Phys. Lett. B377 (1996) 5;
G. Q. Li, C. M. Ko, G. E. Brown, and H. Sorge, Nucl. Phys. A in print (npa2893). -
[5]
G. E. Brown et al., Phys. Rev. C 43 (1991) 1881;
C. M. Ko et al., Phys. Rev. Lett. 66 (1991) 2577;
G. E. Brown et al., Nucl. Phys A 567 (1994) 937. -
[6]
W. Zwermann and B. Schürmann, Nucl. Phys. A 423 (1984) 525;
B. Schürmann and W. Zwermann, Phys. Lett. B 183 (1987) 31;
J. Aichelin and C. M. Ko, Phys. Rev. Lett. 55 (1985) 2661;
H. Kruse et al., Phys. Rev. Lett. 54 (1985) 289;
W. Cassing et al., Phys. Rep. 188 (1990) 361;
J. Aichelin, Phys. Rep. 202 (1991) 233;
G. Q. Li et al., Nucl. Phys. A 537 (1992) 645. -
[7]
X. S. Fang et al., Phys. Rev. C 47 (1993) 1678,
ibid Phys. Rev. C 49 (1994) R608,
ibid Nucl. Phys. A 575 (1994) 766;
M. Lutz, A. Steiner, and W. Weise, Phys. Lett. B 278 (1992) 29,
ibid Nucl. Phys. A574 (1994) 755;
J. Schaffner et al., Phys. Lett. B 334 (1994) 268;
G. Q. Li and C. M. Ko, Nucl. Phys. A 594 (1995) 460;
T. Waas, N. Kaiser, and W. Weise, Phys. Lett. B 379 (1996) 34. -
[8]
J. Aichelin and C. M. Ko, Phys. Rev. Lett. 55 (1985) 2661;
K. Weber et al., Nucl. Phys. A 539 (1992) 713;
S. W. Huang et al., Phys. Lett. B 298 (1993) 41;
C. Hartnack et al., Phys. Rev. Lett. 72 (1994) 3767;
G. Q. Li and C. M. Ko, Phys. Lett. B 349 (1995) 405. - [9] S. W. Huang private communications;
-
[10]
J. Schaffner, J. Bondorf, and I. Mishustin, nucl-th/9607058;
W. Cassing et al., nucl-th/9609050. - [11] B. Hong and the FOPI collaboration, to be submitted to Phys. Rev. C.
- [12] A. Gobbi et al., Nucl. Inst. Meth. 324 (1993) 156.
- [13] J. Ritman, Nucl. Phys. B 44 (1995) 708.
- [14] GEANT3.15, CERN Program Library Long Writeup W5013, CERN (1993).
- [15] D. Pelte et al., Z. Phys A in print.
- [16] D. Best, Ph.D. thesis, Heidelberg, 1996.
- [17] Review of Particle Properties, Phys. Rev. D 45 (1992).
- [18] H. Nifenecker and J. P. Bondorf, Nucl. Phys. A442 (1985) 478.
- [19] J. L. Ritman et al., Z. Phys. A 352 (1995) 355.
-
[20]
P. Senger, Proceedings of Meson ’96, May 1996, Cracow;
W. Ahner et al., Phys. Lett. B in print. -
[21]
S. Schnetzer et al., Phys. Rev. Lett. 49 (1982) 989,
ibid Phys. Rev. C 40 (1989) 640. -
[22]
J. Sollfrank, P. Koch, and U. Heinz, Z. Phys C52 (1991) 593;
G. E. Brown, J. Stachel, and G. M. Welke, Phys. lett. B253 (1991) 19. - [23] P. Siemens and J. O. Rasmussen, Phys. Rev. Lett. 42 (1979) 880.
-
[24]
S. C. Jeong et al., Phys. Rev. Lett. 72 (1994) 3468;
W. Reisdorf et al., Nucl. Phys. A in press (npa2913). - [25] M. A. Lisa et al., Phys. Rev. Lett. 74 (1995) 2662.
- [26] J. W. Harris et al., Phys. Rev. Lett. 58 (1987) 463.
- [27] D. Miskowiec et al., Phys. Rev. Lett. 72 (1994) 3650.
- [28] V.Metag, Prog. Part. Nucl. Phys. 30 (1993) 75.
-
[29]
P. Braun-Munzinger et al., Phys. Lett. B 344 (1995) 43;
P. Braun-Munzinger et al., Phys. Lett. B 365 (1996) 1. - [30] B. Hong, Proceeding to the International Research Workshop on Heavy Ion Physics, Pioana Brasov 1996, World Scientific.
- [31] D. Best et al., GSI Report 96-1 (1996) 49.
-
[32]
TAPS Collaboration, M. Appenheimer, Ph.D Thesis, Univ. Gießen 1997;
R. Averbeck, submitted to Phys. Lett. B. - [33] F. Wang, Proceedings to Heavy Ions at the AGS 1996.
- [34] C. M. Ko, Nucl. Phys. A 583 (1995) 591c.
- [35] W. Ehehalt and W. Cassing, Nucl. Phys. A 602 (1996) 449.
- [36] C. Hartnack et al., Nucl. Phys. A 580 (1994) 643.
- [37] G. Q. Li, private communication.
- [38] C. Hartnack et al, Phys. Rev. Lett. 72 (1994) 3767.
- [39] G. Q. Li, C. M. Ko and B. A. Li, Phys. Rev. Lett. 74 (1995) 235.
-
[40]
G. Q. Li, G. E. Brown, C.-H. Lee, and C. M. Ko, nucl-th/9703040;
D. Best, Proceedings to 12th Winter Workshop on Nuclear Dynamics, Snowbird, Utah, February 3–9, 1996. - [41] C. David et al., nucl-th/9611016 submitted to Nucl. Phys. A
- [42] G. Q. Li and C. M. Ko, Phys. Rev. C 54 (1996) 54.