Characterization of nuclear physics targets using Rutherford backscattering and particle induced x-ray emission
Abstract
Rutherford backscattering and particle induced x-ray emission have been utilized to precisely characterize targets used in nuclear fission experiments. The method allows for a fast and non destructive determination of target thickness, homogeneity and element composition.
1 Introduction
Many experiments in nuclear physics require targets with a precise characterization. In particular, one needs a precise determination of quantities such as the target thickness, the homogeneity, and the amount and kind of impurities, in order to investigate rare processes or perform high accuracy measurements.
Recently, we have investigated 3He- and 4He-induced nuclear fission of several compound nuclei at bombarding energies between 20 and 145 MeV measured at the 88-Inch Cyclotron of the Lawrence Berkeley National Laboratory [1, 2, 3, 4]. To study the excitation energy dependence of the first chance fission probability, which is determined by subtracting similar cross sections of two neighboring isotopes [4], it is essential to measure the cumulative fission cross sections with high precision. While statistical errors can be minimized by measuring a sufficiently large number of fission events, systematic errors, as for example caused by uncertainties in the target thickness or uniformity, are of particular concern and must be evaluated.

To qualitatively illustrate the accuracy needed for our measurements, we schematically show in Fig. 1 the fission excitation functions of three neighboring lead isotopes [4]. The first chance fission probability is determined by the difference in the cross sections of the mother (triangle) and daughter nucleus (circle) separated by the kinetic and the binding energies of the evaporated neutron. Due to the flattening of the curves at large excitation energies, the cross sections become more similar and thus precise cross sections measurements are required.
The presence of contaminations from heavier elements represents another systematic uncertainty in fission cross sections measured from targets made of lighter elements in the rare earth region: Due to their substantially lower fission barriers, even a small contamination from heavy elements ( 1 ppm) can significantly increase the measured fission cross sections [5]. This effect is most prominent at low excitation energies near the fission barrier of the lighter element.
In this paper, we report on the use of Rutherford backscattering and particle induced x-ray emission for a precise off-line characterization of targets used in nuclear physics experiments. Furthermore, we introduce a sensitive method to check the relative accuracy of cross section measurements.
2 The Rutherford backscattering technique
Rutherford scattering was studied at the beginning of the century by Rutherford [6], Geiger and Marsden [7]. Their experiments were purely of nuclear physics interest, i.e. they were designed to confirm the atomic model proposed by Rutherford. The analytical nature of the Rutherford backscattering method (RBS), however, was not fully realized until the late 1950s [8].
For several decades, RBS has been used as a technique to characterize the surface and near surface properties of thin films of thicknesses between 100Å and 1m (see e.g. Ref. [9]). The major push to use this method has come from the need to analyze electronic materials like semiconductors [10, 11]. The technique has also been used to investigate ion implantations into solids [12].
As in the original experiments by Rutherford, Geiger and Marsden, the RBS technique analyzes the Coulomb interaction between a projectile of charge and a target nucleus of charge . As we will briefly discuss in this section, the energy and scattering angle of the scattered particle provide information on the thickness, the nature of constituents, and the profile of the target. A typical experimental setup requires a beam generating device (providing a collimated monoenergetic beam of charged particles), a scattering chamber where the beam interacts with the target, and a detector for the backscattered particles. As mentioned before, the measured quantities are the backscattering angle and the energy of the detected particle. Good energy resolution is obviously an essential quantity for the accuracy of the analysis.
In the following, we give a brief description of the method. More detailed information can be found, e.g., in the book by Chu, Mayer and Nicolet [13].
The most important quantity determined in RBS is the kinematic scattering factor , defined by the ratio of the energy of the backscattered particle and the incident energy of the projectile :
| (1) |
Here, and are the masses of the projectile and the target, respectively. The knowledge of the mass and energy of the projectile and the measurement of the energy and the angle of the backscattered particle allows the identification of the elementary constituents of the sample.
The thickness of the sample can be derived from the energy loss , i.e. by determining the energy of the backscattered particles and at both edges of the sample [13].

Due to the specific energy loss in different materials, contaminations in the sample show up as distortions of the RBS spectrum. This is schematically shown in Fig. 2 for a sample which contains three different constituents. Since the amount of backscattered particles from any given element is proportional to its concentration, RBS can be used to investigate quantitatively the depth profile of individual elements in the sample.
We note that due to the strong dependence of the scattering cross section, the RBS technique shows a lack of sensitivity for low contaminants imbedded in high Z materials. RBS spectrometers using heavy ions as projectiles have been designed and utilized to improve the sensitivity to low constituents [14].
The advantages of the RBS method are many. It provides precise information about the sample without employing physical or chemical sectioning techniques and gives a quantitative analysis without references or standards. Furthermore, this technique is fast and non destructive.
3 Target thickness and homogeneity
We have utilized an RBS spectrometer at Lawrence Berkeley National Laboratory using monoenergetic 4He+ particles of = 1.95 MeV generated by a 2.5 MeV van der Graaf accelerator. The diameter of the beam size was 0.75 mm. A silicon surface barrier detector was positioned at 165∘ with respect to the ion beam to collect and analyze the scattered helium particles [15].
Four different targets made of natural and isotopic lead (nat,206,207,208Pb) have been investigated. The free standing targets were mounted on a thin aluminum target frame with a circular opening of 19 mm. The target thicknesses were 0.5 mg/cm2. The commercially made targets were manufactured using an evaporation method [16].

In Fig. 3, we show the measured energy spectra from the RBS analysis for four lead targets. The thicknesses of the foils are deduced from the widths of the RBS spectra using the energy loss data of the ions in Pb. The high energy edge reflects the front and the low energy edge the back of the sample. Small inhomogeneities in the target thickness can clearly be seen in the figure. In general, the spectral edges are sharply defined indicating well defined surfaces. In Table 1, we compare the thicknesses determined by direct weighing, using a geometric correction factor to account for evaporation nonuniformity [16], with thicknesses determined by the RBS method. Note that the thickness measured by RBS is given in areal density (atoms/cm2), i.e. the amount of materials present to scatter the incident He ions. This areal density can be directly compared to the data obtained by the direct weighing method using Avogadro’s number and the known isotopic weight of the Pb isotope. To determine the overall homogeneity of the target, we have measured the thickness at 3 different points (center, lower left and upper right edge). The distance between the different points was 6 mm. The standard weighing technique provides only an average thickness and does not provide any information on the homogeneity of the target foils. We have also calculated an average thickness using the results from the RBS measurements according to . The observed agreement between the average thicknesses determined by the two methods is good.

In Fig. 4, we show the thickness as a function of the distance from the center on the surface for the 207Pb target. Measurements were made in 2 mm steps to determine the homogeneity. Within the central 8-10 mm, the thickness fluctuation is small. However, the sides are not symmetric. A systematic decrease of the target thickness from the center to the edges is found which is due to the evaporation process used to produce the target. In our fission experiments, the diameter of the beam spot on the target was less than 5 mm and the accuracy of the center focus was 1 mm. Therefore, the differences in the target thickness given in Table 1 represent an upper limit for the uncertainty in the homogeneity.
| Target | |||||
|---|---|---|---|---|---|
| (g/cm | (g/cm | (g/cm | (g/cm | (g/cm | |
| natPb | 544 | 553 | 582 | 538 | 538 |
| 206Pb | 555 | 543 | 558 | 531 | 541 |
| 207Pb | 560 | 548 | 550 | 534 | 561 |
| 208Pb | 500 | 490 | 503 | 496 | 472 |
We note that the relative uncertainty of the RBS target thickness measurement is below 1% and thus provides the necessary accuracy to minimize systematic errors in cross section measurements and associated quantities like, in our experiment, the first chance fission probability.

The sharpness of the low energy edges of the RBS energy spectra shown in Fig. 3 provides information on the surface condition, surface contaminations, and foil roughness. Non uniformities of the surface or significant contaminations will broaden the energy of the backscattered 4He particle. For all targets the front edges are very sharp and for three targets the back edges are also quite sharp. However, for the 206Pb case, the back edge is significantly washed out compared to other targets. In Fig. 5, we show 206Pb data in comparison to the simulated sum spectrum obtained from the RBS analysis [17]. While the agreement is good for the front edge and inside the target material, a large deviation is observed at the back edge. This is most likely caused by either a significant surface inhomogeneity or the presence of large particles in the foil.
4 Target impurities
In order to determine whether any significant target impurities were present, particle induced x-ray emission (PIXE) has been measured simultaneously during the RBS experiments. PIXE is an analytical method which relies on the spectrometry of characteristic x-rays emitted by the target atoms due to the irradiation with a high energy ion beam. The method can identify various constituents in a compound target via their characteristic x-rays. To measure the x-rays, we have used a lithium drifted silicon detector which was located at 30∘ with respect to the incident beam. Under the most favorable conditions, a detection limit of 1 ppm for thin foils can be achieved [15]. Compared to RBS, this method is significantly more sensitive to determine target impurities [15].
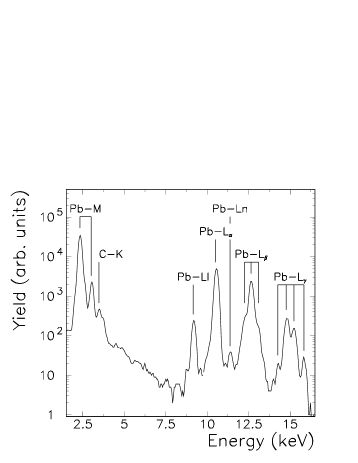
In Fig. 6, we show the accumulated x-ray spectrum for one of the targets (207Pb). The spectrum is dominated by the various M and L x-ray peaks of Pb confirming that Pb is the major constituent. In addition, a small peak from the carbon backing of the target is seen. No sizable contribution of other contaminations has been detected. We note that for the present experimental conditions the detectable limit for most transition metals is 10-50 ppm.
5 Relative cross sections
A good relative accuracy of the measured fission cross sections of the neighboring compound nuclei is very important to minimize the associated error in measurements of first chance fission cross sections. To check this quantity for several separated isotopic targets, we have applied an independent method based on the measurement of the cross section of the corresponding natural target.
In our experiment, we have measured the fission cross sections of four different lead targets (206,207,208Pb and natPb). The composition of natural lead is: 52.4% of 208Pb, 22.1% of 207Pb, 24.1% of 206Pb, and 1.4% of 204Pb. Unfortunately, we have not measured the fission cross section of the latter isotope and had to estimate it from the ratio of the cross sections for 208Pb and 206Pb. This estimate is in agreement with measured fission cross sections for all three isotopes [18]. We have calculated the “natural” cross section by adding up the relative isotopic cross sections using the target thicknesses determined by RBS:
| (2) |
Here, represents the contribution of the isotope to the natural composition.

In Fig. 7, we show the results of this analysis; the calculated cross sections from Eq. 2 have been normalized by the cross section measured for the natural lead target. A rather constant value close to unity has been found. This good agreement allows us to conclude that the relative cross sections are known to 2%. This accuracy is a substantial improvement over previous experiments [18] and is sufficiently good to allow extraction of first chance fission probabilities from our data [4].
6 Summary
In this paper, we have presented results of a method that allows precise characterization of thin target foils used in nuclear physics experiments. The applied Rutherford backscattering and particle induced x-ray emission techniques provide information on the thickness, homogeneity, and constituents of a target material. Furthermore, this method is fast and – more importantly – non-destructive.
The information allows one to minimize systematic errors due to uncertainties in the target thickness and homogeneity. The technique described in this paper thus provides a powerful tool to determine the purity of a target and is especially useful if it is applied in advance of an experiment.
This work was supported by the Director, Office of Energy Research, Office of High Energy and Nuclear Physics, Nuclear Physics Division of the US Department of Energy, under contract DE-AC03-76SF00098.
References
- [1] L.G. Moretto, K.X. Jing, R. Gatti, R.P. Schmitt, and G.J. Wozniak, Phys. Rev. Lett. 75, 4186 (1995).
- [2] Th. Rubehn, K.X. Jing, L.G. Moretto, L. Phair, K. Tso, and G.J. Wozniak, Advances in Nuclear Dynamics 2, Proceedings of the 12th Winter Workshop on Nuclear Dynamics, Snowbird, Utah, 1996, ed. by W. Bauer and G. Westfall (Plenum, New York) 129 (1996).
- [3] Th. Rubehn, K.X. Jing, L.G. Moretto, L. Phair, K. Tso, and G.J. Wozniak, Phys. Rev. C (submitted); (Lawrence Berkeley National Laboratory, LBNL-38865, 1996)
- [4] Th. Rubehn, private communication and to be published (1996).
- [5] G. M. Raisbeck and J.W. Cobble, Phys. Rev. 153, 1270 (1967).
- [6] E. Rutherford, Phil. Mag. 21, 669 (1911).
- [7] H. Geiger and E. Marsden, Phil. Mag. 25, 606 (1913).
- [8] S. Rubin, T.O. Passell, and E. Bailey, Anal. Chem. 29, 737 (1957).
- [9] J.S. Williams, Nucl. Instr. Meth. 149, 207 (1978), and references therein.
- [10] F. Nava, C. Nobili, G. Ferla, G. Iannuzzi, G. Queirolo, and G. Celotti, J. Appl. Phys. 54, 2434 (1983).
- [11] M. Wittmer, J. Appl. Phys. 54, 5081 (1983).
- [12] J.S. Williams and J.M. Poate, eds., Ion Implantation and Beam Processing, Academic Press, New York, 1984, and references therein.
- [13] W.-K. Chu, J. W. Mayer, M.-A. Nicolet, Backscattering Spectrometry, Academic Press, New York, San Francisco, London, 1978.
- [14] K.M. Yu, M.S. thesis, Lawrence Berkeley Laboratory, University of California, Berkeley, 1984, and references therein.
- [15] K.M. Yu, Ion beam analysis facility, 1996 (unpublished).
- [16] Micromatter, P.O. Box 123, Dear Harbor, WA 98243, USA, private communication (1996).
- [17] J. Saarilahti and E. Rauhala, Nucl. Instr. Meth. B64, 734 (1992).
- [18] A. Khodai-Joopari, Ph.D. thesis, University of California, Berkeley, 1966.