Hadron yields and spectra in
Au+Au collisions at the AGS
Roger Lacasse
Foster Radiation Laboratory,
McGill University, Montréal, Canada H3A 2B1
For the E877 Collaboration:
J. Barrette4, R. Bellwied8, S. Bennett8, R. Bersch5,
P. Braun-Munzinger5, W. C. Chang5, W. E. Cleland6,
M. Clemen6, J. D. Cole3, T. M. Cormier8, Y. Dai4, G. David1,
J. Dee5, O. Dietzsch7, M.W. Drigert3, K. Filimonov4,
J. R. Hall8, T. K. Hemmick5, N. Herrmann2, B. Hong5,
C. L. Jiang5, S. C. Johnson5, Y. Kwon5, R. Lacasse4,
A. Lukaszew8, Q. Li8, T. W. Ludlam1, S. McCorkle1,
S. K. Mark4, R. Matheus8, D. Miśkowiec5,
J. Murgatroyd8, E. O’Brien1,
S. Panitkin5, P. Paul5,
T. Piazza5, M. Pollack5, C. Pruneau8, Y. Qi4, M. N. Rao5,
M. Rosati1, N. C. daSilva7, S. Sedykh5, U. Sonnadara6,
J. Stachel5, N. Starinski4, E. M. Takagui7, M. Trzaska5, S. Voloshin6,
T. Vongpaseuth5, G. Wang4, J. P. Wessels5, C. L. Woody1,
N. Xu5, Y. Zhang5, Z. Zhang6, C. Zou5
1BNL -
2GSI -
3Idaho Nat. Eng. Lab. -
4McGill Univ. -
5SUNY, Stony Brook -
6Univ. of Pittsburgh -
7Univ. of São Paulo, Brazil -
8Wayne State Univ.
Abstract
Inclusive double differential multiplicities and rapidity density distributions of hadrons are presented for 10.8A GeV/c Au+Au collisions as measured at the AGS by the E877 collaboration. The results indicate that large amounts of stopping and collective transverse flow effects are present. The data are also compared to the results from the lighter Si+Al system.
1 INTRODUCTION
The availability of the first truly heavy beams at the AGS allows the study of hot and dense nuclear matter over the largest volumes that will effectively be available in the laboratory. Early results on transverse energy production [1] indicate that with such heavy beams, energy densities predicted to lead to a quark-gluon plasma phase transition are probably reached. The study of hadron spectra provides a more detailed description of the reaction dynamics and, in particular, of its evolution as a function of the mass of the colliding system.
Preliminary results on hadron production at 10.8A GeV/c from the E877 Collaboration were presented at Quark Matter 1995 [2]. Au beam data were taken during the 1993, ’94 and ’95 AGS heavy ion runs. Here, we will present mostly ’93 data with some preliminary results from the ’94 run. The E877 experimental setup is presented in T. K. Hemmick’s contribution to this conference [3]. It can be summarized into two groups of detectors: nearly calorimetry around the target and a forward spectrometer. The centrality determination is done using the calorimeters surrounding the target [4] and the particle spectra discussed here were obtained with the spectrometer.
2 PROTON DISTRIBUTIONS
Since at AGS energies creation of baryon-antibaryon pairs is nearly negligible, the rapidity distribution of protons allows the study of the energy deposition in the reaction, i.e. the nuclear stopping power.

E877’s measurement of proton transverse mass spectra in Au+Au collisions for the most central 4% of is presented in figure 1. One of the key features of the E877 spectrometer is that its acceptance includes . In terms of rapidity, the spectrometer’s acceptance for protons starts at with data extending to . The vertical scale in figure 1 is so that a thermal (Boltzmann type) source would produce an exponential distribution. As in all the figures of this paper, the data are presented with statistical error bars only.
Overall, the transverse mass spectra exhibit thermal shapes with increasing slope parameter when approaching mid-rapidity. As expected, deviation from a purely exponential distribution is observed around beam rapidity () for GeV/c2. This colder low transverse momentum component to the proton spectra can be attributed to spectator protons from the projectile [5].

The values of the inverse slope constants obtained from fitting each of the proton transverse mass spectra with an exponential (full lines in figure 1) are plotted in figure 2. The data are compared to values obtained for 14.6A GeV/c Si+Al () [6] and are plotted as a function of .
The measured inverse slope constants for the two systems are quite similar around beam rapidity. Systematically increasing differences are observed between the Au+Au and Si+Al systems which reach their largest values closest to the center of mass rapidity. The present result could be interpreted as being due to a larger collective transverse flow component in Au+Au compared to what was observed in Si+Al [7].
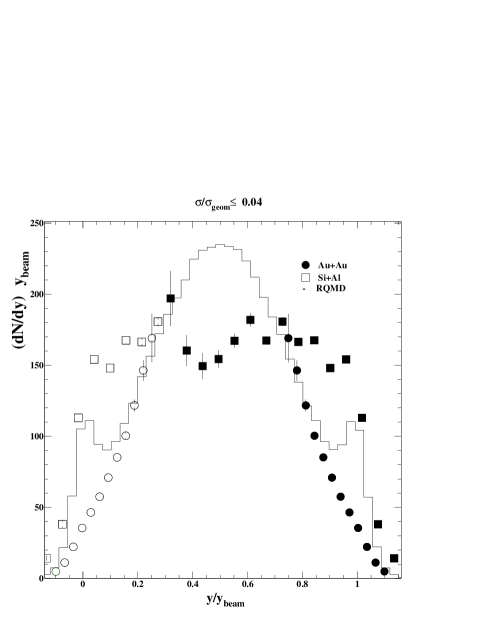
The proton rapidity density distribution shown in figure 3 is obtained by integrating the transverse mass spectra where data are available and extrapolating to using the Boltzmann fits (see figure 1). The measured rapidity distribution for Au+Au (circles) is plotted as a function of in order to compare with Si+Al data (squares) [6] and is multiplied with the proper Jacobian (). The Si+Al rapidity density distribution was also renormalized by the ratio of the number of nuleons in Au+Au to that in Si+Al so as to better compare the shapes of the two distributions. The open symbols are obtained by reflecting the experimental results about . The solid line is the result of an RQMD 1.08 [8] calculation for Au+Au.
The RQMD calculation exhibits a structure near originating from projectile protons which have had no or minimal interaction with the target. This structure includes protons originating from the dissociation of the spectators treated as unbound in RQMD. The measured rapidity distribution of protons in Au+Au is significantly narrower than what was observed for Si+Al. The distribution is still wider than predicted by an isotropic thermal distribution, using the temperature deduced from the pion spectra, and is consistent with a longitudinaly expanding thermalized source [9]. Although the stopping was already shown to be high in Si+Al [10], the measured Au+Au rapidity distribution indicates that an even larger amount of stopping is involved. This is understood as being a consequence of the smaller surface to volume ratio and increased average number of rescatterings in the Au+Au system. This interpretation is supported by the RQMD calculation that reproduces both overall widths of the Si+Al [6] and the Au+Au measurements.
3 PION DISTRIBUTIONS
Pions are produced copiously at AGS energies. Because of their light masses and large cross sections for interaction in nuclear matter they are expected to thermalize easily. Furthermore, their spectra are not as affected as those of heavier particles by a given collective flow velocity and thus are good probes for studying thermal properties at freeze-out.

The pion spectra in Au+Au collisions for the most central 4% of are shown in figure 4 as a function of transverse mass and rapidity. The pion data extend to 0.8 GeV/c2 in and cover rapidities 2.8 to 4.5. The transverse mass spectra are exponential with slopes decreasing with increasing rapidity. A clear enhancement above a pure exponential is observed for 0.2 GeV/c2. A similar effect was already observed for the Si+Pb system and was explained by the contribution from decay pions of resonances [11]. To better display the enhancement for the rapidity slice, the data were divided by an exponential fitted to the part of the spectra above 0.2 GeV/c2. As shown on the insert, the enhancement reaches values as large as 4 at 0 GeV/c2. The enhancement is systematically increasing as one goes toward .

Close inspection of the transverse mass curves of figure 4 reveals that the deviations from a pure exponential emission are systematically larger for than for . The charge asymmetry of the pion production is better studied by plotting the ratio of to as done in figure 5. In order to improve statistical errors in the ratio, the data were divided into three large rapidity bins. The ratio is consistent with unity at large transverse mass values. A strong charge asymmetry is observed starting at GeV/c2 with a minimum value of at GeV/c2 for the rapidity slice. The asymmetry is also observed to systematically decrease as a function of rapidity. The observed rapidity dependence is in line with the charge asymmetry of measured by the E866 collaboration near at similar centrality [12].
The observed pion charge asymmetry and its rapidity dependence could be due to the different Coulomb potentials seen by each charge type at freeze-out. Coulomb interactions have been discussed at this conference in terms of their influence on the interpretation of particle correlations [13, 14, 15]. The study of the Coulomb effect on the shape of the particle spectra will be pursued since it provides a different approach to the determination of the spacetime particle distribution at freeze-out.

The rapidity distribution for pions obtained by integrating the transverse mass spectra is shown in figure 6. The distributions are plotted as a function of laboratory rapidity, covering the rapidity range . The RQMD calculations agree very well with our data over their entire range. A similar agreement was also observed for the the Si+Pb system [16].
The proton rapidity distribution is also included at the bottom of figure 6. Contrary to what was observed in the Si+Al [7], where the proton distribution was wider than that of the pion, the rapidity distribution widths are similar for Au+Au. The measured narrowing of the proton distribution from the Si+Al is reproduced by the RQMD calculation. These observations are consistent with full stopping and similar values of longitudinal and transverse expansion of [9].
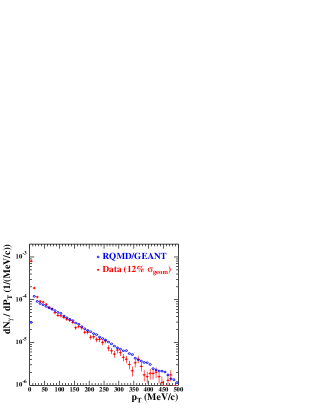
The inclusive photon spectra, and indirectly the yield, was measured using a CsI photon detector [17]. This detector was placed 35 m from the target at an angle of and covered . The photon inclusive transverse momentum measurement is shown on left side of figure 7 (open symbols). Because of the small size of the detector, reconstruction of the using the two decay photons was impossible. A model dependent method was used to derive a limit on production using single photons. An RQMD calculation was performed followed by tracking of the decay photons through the E877 spectrometer using a GEANT (full symbols) [18]. The RQMD+GEANT calculation is in fair agreement with the shape of the measured photon spectra except for the lowest transverse momentum values MeV/c.
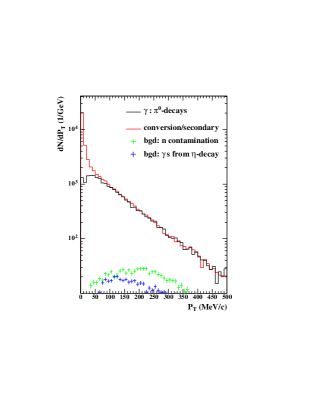
As the calculation shows on the right side of figure 7, the single photon spectrum is dominated, above MeV/c, by photons that originate from decays. The calculation also indicates that the dominant contributions at low transverse momentum ( MeV/c) are secondary photons. These secondary photons originate from interactions in the spectrometer material located upstream of the CsI detector. The contributions to the measured photon spectrum from neutron contamination and decays are also shown. A careful inspection of the higher end of the inclusive photon spectrum on left side of figure 7 reveals that the calculation systematically overpredicts the yield of photons. Using the photon spectrum decomposition made above, the discrepancy is found to correspond to an overprediction by RQMD of roughly of the yield [17]. RQMD predicts a ratio between the pion yields of at a centrality of 12% of . Thus the present result does not support the predicted excess of neutral pions.
4 KAON DISTRIBUTIONS

The study of the production kaons and other strange particles provides information on the level of chemical equilibrium achieved and is also relevant to determine whether chiral restoration is achieved. At Quark Matter 95, preliminary kaon spectra were presented that created a high level of interest [2]. The measured transverse mass spectra of K+ seemed to exhibit an unexpected enhancement at the lowest transverse mass values.
In order to validate the shape of these spectra, new measurements of the kaon spectra were performed in 1994 with slightly different experimental conditions. In addition, the preliminary results from the 1993 run were complemented by an independent re-analysis of the data [19].
The results from the re-analysis of the 1993 data for the top 10% of are plotted in figure 8. The scales are divided into bins equal to 20 MeV/c in for K+ and 40 MeV/c for K-. The K+ spectra no longer show a statistically significant enhancement at low transverse mass. The origin of the structure was traced to an albedo source located at the spectrometer’s collimator edge, closest to the beam trajectory. The present results are confirmed by the preliminary analysis of the 1994 data. Both sets of data show an indication of a dip at very low in the K+ spectra.
The fitted exponential inverse slopes have values of 60 to 90 MeV which are consistent with those presented at Quark Matter ’95 for K+. These values are lower than the ones obtained from the E866 data (T to MeV) in the same rapidity range [9, 20]. The E866 data cover transverse mass values of up to 1 GeV/c2 whereas our measurement covers the first 0.1 GeV/c2.
5 DEUTERON DISTRIBUTIONS

The production of composite particles at the AGS has yet to be studied extensively. Their production is just starting to be considered in the cascade models. Deuterons are, because of their mass, good probes to study expansion and collective transverse flow velocities.
Preliminary results from the measurement of deuteron production from the 1994 run are presented in figure 9 for the most central collisions (4% of ). The deuteron acceptance covers the rapidity 1.2 to 2.2 and the data extend to 0.25 GeV/c2 in for . The measured deuteron spectra are very flat over the covered transverse mass range and exhibit only a slight rapidity dependence.
On the right side of figure 9, data for deuterons (circles) and protons (triangles) are compared to the corresponding RQMD calculations (lines) for the production of different types of composites (p, d, t, He4) in the rapidity slice [21]. The result from the cascade version of RQMD (dashed histogram) is found to overshoot the data. A modified version of RQMD that simulates the presence of a mean field (full line histogram) reproduces the measured deuterons yield quite well but still overshoots the proton data. A Boltzmann fit to the large region of the RQMD deuteron calculation (full line) shows that even the simple cascade model deviates from a thermal shape and produces much flatter distributions at low .
The spectral shapes of the deuteron data support the importance of the mean field to describe the measured yields. The model predicts an increasing flattening with mass and thus the measurement of the spectra of more complex composites would serve to better determine the importance of mean field effects in relativistic heavy ions collisions.
6 CONCLUSION
We have presented new data on the particle distributions of hadrons produced in Au+Au collisions at AGS energies. The rapidity distributions show increased stopping relative to lighter systems leading to a center of mass region richer in baryons. The rapidity dependence of the slopes of the particle spectra and the rapidity distributions show evidence of large collective transverse and longitudinal flow. The data are consistent with a larger collective component in the Au+Au final state than what was observed for the Si+Al system. The slope and yield of the measured deuteron spectra at low suggest the presence of sizable mean field effects. The addition of a new vertex detector system to the E877 spectrometer and the better statistical samples from the runs of 1994 and 1995 should soon provide interesting new results, particularly on deuteron, K- and production.
The avalaible data on both global observables and particle spectra in Au+Au collisions are consistent with the formation of baryon rich nuclear matter at density and temperature close to that expected for a phase transition. It is particularly interesting to note that heavy systems provide us with new observables, such as collective flow, mean field and Coulomb effects, that will help us to better understand the space-time evolution of the system during the collision and yield additional signatures for new phenomena.
Support from US DoE, the NSF, the Canadian NSERC, and CNPq Brazil is gratefully acknowledged.
References
- [1] J. Barrette et al., E814 Collaboration, Phys. Rev. Lett. 70, (1993) 2996.
- [2] J. Barrette et al., E814 Collaboration, Nucl. Phys. A590 (1995) 259c.
- [3] T. K. Hemmick for the E877 Collaboration, Quark Matter 96, these proceedings.
- [4] J. Barrette et al., E877 Collaboration, Phys. Rev. C51 (1995) 3309.
- [5] J. Barrette et al., E814 Collaboration, Phys. Rev. C50, (1994) 3047.
- [6] J. Barrette et al., E814 Collaboration, Z. Phys. C59, (1993) 211-214.
- [7] P. Braun-Munzinger, J. Stachel, J. P. Wessels and N. Xu, Phys. Lett. B344, (1995) 43.
- [8] H. Sorge, H. Stöcker and W. Greiner, Ann. Phys. (NY) 192 (1989) 266.
- [9] J. Stachel, Quark Matter 96, these proceedings.
- [10] J. Barrette et al., E814 Collaboration, Phys. Rev. Lett. 64, (1990) 1219.
- [11] J. Barrette et al., E814 Collaboration, Phys. Lett. B351, (1995) 93.
- [12] F. Videbaeck, for the E866 Collaboration, Nucl. Phys. A590 (1995) 249c.
- [13] D. Miśkowiec for the E877 Collaboration, Quark Matter 96, these proceedings.
- [14] K. Kadija for the NA49 Collaboration, Quark Matter 96, these proceedings.
- [15] G. Baym and P. Braun-Munzinger, Quark Matter 96, these proceedings.
- [16] T. K. Hemmick for the E814 Collaboration, Nucl. Phys. A566 (1994) 435c.
- [17] C. M. Zou, Ph.D. Dissertation, SUNY at Stony Brook, December 1995.
- [18] R. Brun et al., Geant 3 Users Guide, Cern Data Handling Division Report N0. DD/EE/84-1, 1984 (unpublished).
- [19] R. Lacasse, Ph.D. Dissertation, McGill University, in preparation.
- [20] Y. Akiba for the E866 Collaboration, Quark Matter 96, these proceedings.
- [21] R. Mattiello, private communication.