Double beta decay of 48Ca
Abstract
48Ca, the lightest double beta decay candidate, is the only one simple enough to be treated exactly in the nuclear shell model. Thus, the half-life measurement, reported here, provides a unique test of the nuclear physics involved in the matrix element calculation. Enriched 48Ca sources of two different thicknesses have been exposed in a time projection chamber, and yield T years, compatible with the shell model calculations.
pacs:
PACS numbers: 21.10.Tg, 21.60.Cs, 23.40.Hc, 27.40.+z, 23.40.-sAmong all candidates for double beta decay, 48CaTi is unique, since it is the only one which can be treated “exactly” in the nuclear shell model by solving the problem of eight nucleons distributed within the shell without truncation. Consequently, this decay has been a favored testing ground of nuclear theories [3]. However, until now only a lower limit of the decay half-life, T years, has been determined experimentally [4].
In a recent paper [5] it was shown that the nuclear shell model, constrained by the requirement that it describes well the spectroscopy of the nuclei, restricts the corresponding half-life also from above, T y. Therefore the experimental observation of the decay acquired added significance; if it turns out that the shell model cannot predict this theoretically tractable rate, we have to wonder about our ability to describe the nuclear matrix elements in the more complex nuclei, including perhaps even the matrix elements responsible for the neutrinoless decay. Here we will present the result from a new experiment using a time projection chamber (TPC).
The search for double beta decay of 48Ca was among the first to be attempted in live-time experiments beginning in the early fifties (for an extensive chronology see [6]). With the largest energy release of all candidates 48Ca (Qββ = 4.3 MeV) has a sum-energy spectrum that extends to higher energies than most radioactive background. Yet calcium has a tendency to harbor chemically similar radio-impurities such as 90Sr and 226Ra, which do intrude on a major fraction of the 48Ca spectral range.
When the two particles are tracked in a TPC they are seen to both carry negative charge, originate from a common point, and have separately measured energies. Although this distinctive visualization eliminates the bulk of unrelated activity, there remain several well-known mechanisms for production of negative electron pairs that constitute background for decay. The most serious of these are Möller scattering of single particles, and - cascades in which a -ray internally converts or Compton scatters. These processes are fed principally by the primordial decay chains, but also by cosmogenic and man-made radionuclides. Decay-chain induced background events can often be tagged by or particles from neighboring links if the source is thin enough to allow the tagging particles escape into the TPC gas.
The miniscule 0.187% natural abundance of 48Ca makes enrichment both necessary and expensive. Potential exposure to loss of costly isotope is a deterrent to chemical purification or conversion to the lightest stable compound. The material used was supplied by the Kurchatov Institute as finely powdered CaCO3 enriched to 73% in 48Ca, and relatively free of U and Th ( ppb by mass spectroscopic analysis). The speculative assumption of secular equilibrium and the absence of serious amounts of other high Q-value impurities, led to a projected experimental sensitivity in excess of years for this material. Accordingly, a relatively thick source was made to maximize the number of exposed 48Ca nuclei. The CaCO3 powder was injected into a large glass box in bursts of compressed gas, allowed to settle uniformly onto a 4 m Mylar substrate, then fixed with a mist of Formvar. Two such deposits, face-to-face, formed the first source, with a total of 42.2 g of CaCO3 (18.5 mg/cm2 total thickness with substrate and binder.)
The shielded UC Irvine TPC [7, 8] containing the source as the central electrode in a magnetic field was located in a tunnel at the Hoover Dam under a minimum of 72 m of rock. Data were recorded on magnetic tape, and subsequently passed through stripping software to select clean 1e- and 2e- events. The 2e- events were individually scanned by a physicist. All unambiguous negative pairs emitted from opposite sides of the source with a common point of origin were fitted with helices, and the parameters written to a candidate file or a 214Bi file, depending on whether a 214Po particle appeared at the vertex within the following millisecond. The far more numerous 1e- events were fitted automatically by software and also written to a parameter file.
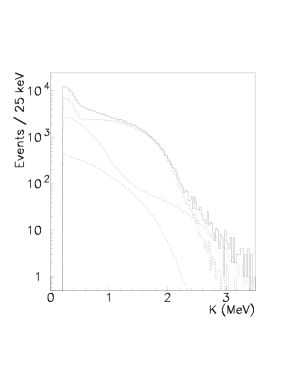
The lone electron (1e-) spectrum plotted against kinetic energy in Fig. 1 represents the total beta activity of source contaminants, and can be broken down into the contributions from individual radionuclides by a least squares fit. 90Sr (2250 Bq/g), 226Ra (530 Bq/g) and their daughters account for the bulk of the spectrum. Contributions from 137Cs (940 Bq/g), and daughters of 228Ra (90 Bq/g), are also present. The two Ra activities being much larger than the mass spectroscopic limits on U and Th, indicate severe breaking of equilibrium in the respective series. The daughters of greatest concern (Q MeV) are 90Y, 214Bi, 228Ac, 212Bi, and 208Tl. As a check of the fitting procedure, the energy spectrum of electrons tagged by 214Po -particles was noted to closely match the fitted 214Bi component when adjusted for the escape probability (P from an independent measurement.)
The activities determined from the lone electron spectrum were used as input to a Monte Carlo calculation of the 2e- background. 90Sr and its daughter 90Y are essentially pure emitters, and contribute only through Möller scattering. The other high Qβ nuclei have complex decay schemes with multiple gamma rays [9], all of which were included in the Monte Carlo with their corresponding conversion coefficients. Most of these simulated 2e- backgrounds were directly testable against TPC measurements, with good agreement: The measured 214Bi component was simply the 2e- data subset tagged by the 214Po , and corrected for the escape probability. The 90Y 2e- measurement was provided by a drop of 90Sr solution applied to a natural isotopic replica of the 48Ca source, and placed in the TPC. The 212Bi and 208Tl 2e- measurements were scaled from those produced by an injection of 220Rn, by comparing observed rates of the rapid 212Bi-212Po, - sequence.
Since the Monte Carlo 2e- rates were derived from intrinsic activity levels in Bq/g, their agreement with direct measurements also confirms the Monte-Carlo predicted 2e- efficiency of the TPC. A Monte-Carlo generated background spectrum was essential only for 228Ac where we have no TPC measurement, but in our 2e- background model we elected to use the smoother, better-statistics Monte Carlo spectra for the other contributions as well.
An alternative determination of 2e- background was carried out by a separate subgroup of the collaboration, and included independent Monte Carlo calculations and a greater reliance on the above-mentioned TPC measurements as opposed to lone-electron fits. We refer to this direct measurement method as analysis “A”, and the lone-electron based method as analysis “B”. To eliminate events with the poorest energy resolution, analysis B included a cut on electrons making the smallest angles with the magnetic field, ().
The 2e- sum spectrum from the 48Ca source, after event-by-event removal of the -tagged 214Bi, is shown in Fig. 2a with a singles threshold of 400 keV. The various remaining background spectra as determined by analysis A are superimposed. The residual spectrum following background subtraction, appears in Fig. 2b.

The above procedure was repeated for a series of singles thresholds and one relatively high sum threshold, with consistent results. The corresponding half-lives were calculated in each case, as shown for two of the threshold combinations in Table I. The 2 MeV sum threshold was accompanied by an additional singles spectrum cut on the strong 214Bi conversion line at 1.3 MeV. Quoted errors in the table are statistical. The calculated half-life is independent of threshold and analysis A or B within errors.
Since the half-life precision was degraded by the unexpectedly large Ra and Sr contamination, the 42.2 g source was replaced after 2440 hours exposure, with one containing only 10.3 g of enriched CaCO3, and total thickness 5.4 mg/cm2. The thinner source was exposed 4001 hours, and these results are also included in Table I. The 214Bi rejection improved greatly as a result of an increase in Pα from 0.24 to 0.69, and the 90Y component was weakened by the large reduction in target mass for Möller scattering.
In view of these significant improvements, the relatively small increase in signal-to-background ratio observed for the thin source was disappointing. We now understand that multiple Coulomb scattering caused a nonlinear dependence of total Möller cross section on source thickness. In addition, the thick source degraded a larger percentage of electrons to sub-threshold energies, and thereby suppressed background more effectively than the generally more energetic events. Nevertheless, it is encouraging that despite different dependence on source mass for the 48Ca signal and the background rates (particularly 214Bi,) the half-lives derived from thick and thin sources agree within statistics.
The thick and thin source residual spectra were each corrected for energy loss and efficiency distortion, then combined for the Kurie plot shown in Fig. 3. Including the singles threshold () in an integration of the Primakoff-Rosen spectral approximation [10] produced a Kurie formula that retains the linear energy dependence of a transformed spectrum in the presence of a singles threshold cut. The resulting formula is then
where
and
with electron mass (). The Kurie plot energy intercept at MeV is consistent with the 48Ca Qββ value of MeV [11]. The small error bars resulting from the Kurie transformation, have been omitted in the figure. By comparison, the -tagged 214Bi 2e- events produce a distinctly bowed Kurie plot, and the plot for measured 208Tl (Q MeV) events is grossly nonlinear.
Since the thick and thin sources were exposed separately, corresponding pairs of columns in the table can be combined as independent measurements. For example, combining thick and thin events for 0.400/0.800 MeV singles/sum thresholds, analysis A, yields T y. Either of the other two thick-thin pairs would combine to give an equally valid result. However, since the other two results would not be statistically independent from the first, we do not attempt a grand average. Rather we choose the above number, since it includes a broader range of the spectrum than the higher sum threshold, and we include the A-B analysis difference in the systematic error. The remainder of the systematic error is largely in the detector efficiency. Thus we quote a final result of T y.
| Thick Source (0.0775 mol) | Thin Source (0.0310 mol) | |||||
| Singles threshold (MeV) | 0.400 | 0.200 | 0.400 | 0.200 | ||
| Sum threshold (MeV) | 0.800 | 2.000 | 0.800 | 2.000 | ||
| 214Bi 1.3 MeV line cut | No | Yes | No | Yes | ||
| Analysis A | Analysis B | Analysis A | Analysis B | |||
| Small polar angles cut | No | Yes | No | No | Yes | No |
| Counts | ||||||
| With tag | 55 | 50 | a | 79 | 72 | a |
| Without tag | 500 | 472 | 72 | 142 | 134 | 21 |
| Backgrounds b | ||||||
| Untagged 214Bi | ||||||
| Möller events c | ||||||
| 228Ac, 212Bi, 208Tl d | ||||||
| Total background | ||||||
| events | ||||||
| Efficiency e | 0.0973 | 0.0902 | 0.0414 | 0.1046 | 0.0972 | 0.0469 |
| T y) | ||||||
| Signal/Background | 0.18 | 0.25 | 1.35 | 0.25 | 0.40 | 2.04 |
| Kurie plot intercept (MeV) | ||||||

This observation is consistent with the spectroscopy-constrained shell model of reference [5]. For most nuclei the agreement between the experimental half-life and the calculated one has been obtained only with the empirical quenching of the Gamow-Teller (GT) strength, i.e., the multiplication of all matrix elements of the operator by a universal quenching factor 0.77. Taking into account the range of lifetimes compatible with the limits of Ref. [5], and the experimental uncertainties described above, we cannot, alas, make a definitive statement about the GT quenching for the double beta decay (but for the optimal shell model the quenching is clearly required). On the other hand, some calculations [12] that are unconstrained by the spectroscopy test, suggest a much longer half-life for 48Ca in disagreement with the present experiment.
Although the 48Ca enriched sample contained traces of radium and strontium activity, backgrounds were well defined by associated alpha particles and the lone electron spectrum. The residual data give half-life values that are consistent between two sources of different thickness, and among various energy thresholds. The corresponding Kurie plots all intercept the energy axis near the 48Ca Qββ value, unlike plots made from measured samples of the various backgrounds. We believe these results constitute strong evidence for 48Ca double beta decay at a half-life supporting the relatively rigid shell model calculations for this lightest double beta decay nucleus.
We gratefully acknowledge the hospitality of Blaine Hamann and William Sharp at the Hoover Dam. We thank Felix Boehm for his advice and support, and one of us (A.P.) wishes to acknowledge the support of the Alexander von Humboldt Foundation. This work was funded by the US Department of Energy under contracts DE-FG03-01ER40679 and DE-FG03-88ER40397.
REFERENCES
- [1] Present address: Dynamics Technology, Inc., 21311 Hawthorne Blvd., Suite 300, Torrance, CA 90503-5610.
- [2] Present address: 3901 E. Desert Flower Lane, Phoenix, AZ 85044.
- [3] For a representative list see F. Boehm and P. Vogel, Physics of Massive Neutrinos, Cambridge: Cambridge Univ. Press. 2nd ed. (1992)
- [4] R. K. Bardin, P. J. Gollon, J. D. Ullman and C. S. Wu, Nucl. Phys. A158, 337 (1970).
- [5] A. Poves, R. P. Bahukutumbi, K. H. Langanke and P. Vogel, Phys. Lett. B361, 1 (1995).
- [6] W. C. Haxton and G. J. Stephenson, Jr, Progr. Part. Nucl. Phys. 12, 409 (1984).
- [7] S. R. Elliott, A. A. Hahn and M. K. Moe, Nucl. Instrum. Meth. in Phys. Res., A273, 226 (1988).
- [8] M. K. Moe, M. A. Nelson and M. A. Vient, Prog. Part. Nucl Phys. 32, 247 (1994).
- [9] Table of Isotopes — 7th Edition, edited by C. M. Lederer and V. S. Shirley (John Wiley & Sons, New York, 1978).
- [10] H. Primakoff and S. P. Rosen, Rep. Prog. Phys. 22, 121 (1959).
- [11] A. H. Wapstra and G. Audi, Nucl. Phys. A432, 1 (1985).
- [12] K. Muto, E. Bender and H. V. Klapdor-Kleingrothaus, Z. Phys. A339, 435 (1991); M.K.Cheoun, A. Bobyk, A. Faessler, F. Simkovic, and G. Teneva, Nucl. Phys. A561, 74 (1993).