Comment on “Circumstantial Evidence for Critical Behavior in Peripheral Au+Au Collisions at 35 MeV/nucleon.”
Mastinu et al. recently reported the observation of several positive signals possibly indicating critical behavior in peripheral collisions of Au+Au at =35 MeV [1].
In our comment, we examine the choice of variables used to determine the presence (or absence) of critical behavior. We do this by repeating the analysis of ref. [1] on “data” from a simulation with no critical behavior.
The simulation samples a charge distribution and conserves charge (breaking up a source of size ). The charge particle multiplicity is specified at the outset. Within an event, at multiplicity (where ) the probability to emit a particle of a given Z is
| (1) |
under the constraint that at each “emission step” , the of the emitted particle be sufficiently small so that the event will satisfy the requirement of containing particles. We chose and = 79. The choice of exponential charge distribution (and =0.3) is arbitrary as is the specific implementation of charge conservation.
Using this simulation we constructed “events” and examined the proposed observables for critical behavior.
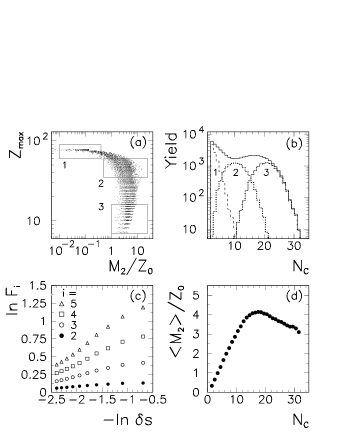
In Fig.1a is shown the Campi scatter plot of versus . We observe the two-branch feature commonly interpreted as indicating “sub-critical” and “over-critical” events.
By applying cuts similar to those in ref. [1], we have plotted the resulting multiplicity distribution (Fig.1b). Qualitative agreement with the experimental data [1] is achieved with this simple event selection. We question whether these cuts “select” events that can be associated with critical behavior.
Using the same cut (2) in the Campi plot for “potentially critical” events as in ref. [1], we have constructed the horizontally scaled factorial moments. These moments are shown in Fig.1c. The linear rise with decreasing bin size is quite apparent. It has already been pointed out [2, 3] that spurious intermittency signals can be observed by mixing events of different multiplicity, which is clearly the case for ref. [1] and for which the authors appropriately express concern.
Finally, we show a plot of versus (Fig.1d). A peak in such a plot is often mistakenly taken as an indication of critical behavior. While we observe a peak, our simulation is one that assuredly contains no critical behavior. Perhaps one should instead examine the location, height and width of the peak to search for evidence of critical behavior. However, even then such an analysis may not reliably distinguish different fragmentation mechanisms [4].
We have repeated the analysis shown in Fig. 1 for power law charge distributions and different implementations of charge conservation but the qualitative results remain the same.
Before doing this analysis, we were under the mistaken impression that the simple observables listed above give an indication of the presence or absence of critical behavior. Part of our confusion came from the vast commentary in the literature that points to these observables as indicators of critical phenomena. In fact, positive signals in all of these observables are probably found in any simulation that conserves charge and where light particle emission is preferred over heavy. And so we caution that the positive signals observed in ref. [1] are insufficient to establish critical behavior since they appear even in simple models which contain neither a phase transition nor critical behavior.
L. Phair, Th. Rubehn, L.G. Moretto, and G.J. Wozniak
Nuclear Science Division
Lawrence Berkeley National Laboratory
Berkeley, California 94720
REFERENCES
- [1] P.F. Mastinu et al., Phys. Rev. Lett. 76, 2646 (1996).
- [2] L. Phair et al., Phys. Lett. B 291, 7 (1992).
- [3] X. Campi and H. Krivine, Nuc. Phys. A 589, 505 (1995).
- [4] K.C. Chase and A.Z. Mekjian, Phys. Rev. C 52, R2339 (1995).