Scaling laws and transient times in 3He induced nuclear fission
Abstract
Fission excitation functions of compound nuclei in a mass region where shell effects are expected to be very strong are shown to scale exactly according to the transition state prediction once these shell effects are accounted for. The fact that no deviations from the transition state method have been observed within the experimentally investigated excitation energy regime allows one to assign an upper limit for the transient time of 10-20 seconds.
pacs:
PACS number(s): 25.85.Ge, 24.75.+iI Introduction
More than half a century after its discovery [1], the study of fission is still of general interest. While the availability of relativistic heavy ions has enabled the study of several aspects of the fission process in the high energy region [2, 3, 4, 5, 6, 7, 8], it has been shown recently that a new approach [9] to investigate excitation functions of low energy, light particle induced fission allows for the model independent extraction of fundamental quantities of the fission process, like fission barriers, shell effects, and the much discussed fission delay time (see e.g. Refs. [9, 10, 11]).
From early studies it is well known that the fission excitation functions vary dramatically from nucleus to nucleus over the periodic table [12, 13, 14]: Some of the differences can be understood in terms of a changing liquid-drop fission barrier with the fissility parameter, others are due to to strong shell effects which occur e.g. in the neighborhood of the double magic numbers =82 and =126. Further effects may be associated with pairing and the angular momentum dependence of the fission barrier [15, 16].
Fission rates have been calculated most often on the basis of the transition state method introduced by Wigner [17], and applied to fission by Bohr and Wheeler [18]. The success of this method has prompted attempts to justify its validity in a more fundamental way, and to identify regimes in which deviations might be expected. Recent publications claim the failure of the transition state rates to account for the measured amounts of prescission neutrons or -rays in relatively heavy fissioning systems [10, 11, 19]. This alleged failure has been attributed to the transient time necessary for the so-called slow fission mode to attain its stationary decay rate [20, 21, 22, 23, 24, 25, 26, 27, 28]. The larger this fission delay time, the more favorably neutron decay competes with the fission process. This leads to an effective fission probability smaller than predicted by the Bohr - Wheeler formula. The experimental methods of these studies, however, suffer from two difficulties: First they require a possibly large correction for post-saddle, but pre-scission emission; second, they are indirect methods since they do not directly determine the fission probability. The measured prescission particles can be emitted either before the system reaches the saddle point, or during the descent from saddle to scission. Only from the anomalies in the first component, would deviations of the fission rate from its transition state value be expected. The experimental separation of the two contributions, however, is fraught with difficulties which make the evidence ambiguous. It seems therefore desirable to search for transient time effects by directly measuring the fission probability and its energy dependence against the predictions of the transient state method for a large number of systems and over a broad energy range.
In the last few decades, several studies have investigated heavy ion and high energy light ion induced fission [16]. These reactions involve a large and variable deposition of energy, mass and, most important, of angular momentum. The latter, in particular, greatly affects the fission process and makes comparisons with liquid drop model calculations difficult [15, 16]. In contrast, the problem of excessive angular momentum, mass and energy transfer and the associated uncertainties can be minimized by the use of light projectiles and relatively low bombarding energies, see e.g. Ref. [12, 14, 29]. Becchetti et al. have, in particular, measured 3He induced fission excitation functions of several nuclei with masses between 159 and 232 at bombarding energies ranging from 19.1 to 44.5 MeV [30]. Their analysis with statistical fission theory indicates fission barriers which, in contrast to heavy ion induced fission, differ only slightly from liquid drop model predictions.
In a recent letter, a new scaling of fission excitation functions based upon the transition state prediction, collapses a large number of fission excitation functions from compound nuclei produced in -induced reactions [14] to a single straight line, once the shell effects are accounted for [9]. An investigation of fission delay times gave an upper limit of 310-20 seconds.
In this paper, we show the results of a recent experiment investigating 3He induced fission of the compound nuclei 200Tl, 211Po, and 212At at excitation energies between 25 and 145 MeV. These fissioning systems bracket the closed shell region around 208Pb, and due to the strong shell effects, the analysis of these systems represents a sensitive test of the method introduced in Ref. [9].
The present paper is organized as follows: In section II, we present an experimental setup which allows one to measure fission excitation functions for various nuclei efficiently, and we show the results of such a measurement. In the subsequent section, we describe the analysis of the fission data and our findings. Finally, our summary can be found in section IV.
II Experiment
Fission of three compound nuclei, 200Tl, 211Po, and 212At, formed in the reactions 3He + 197Au, 208Pb, and 209Bi was investigated. Fig. 1 shows the schematic setup of the experiment. The targets were mounted at 45 degrees with respect to the beam axis and had thicknesses between 240 and 500 g/cm2. The Lawrence Berkeley National Laboratory’s 88-Inch Cyclotron delivered 3He beams with 19 different energies between 21 MeV and 135 MeV. The number of energy points was increased to 26 (see Table I) by using a set of degraders made of aluminum foils with thicknesses between 186 and 433 m which were determined by weighing.
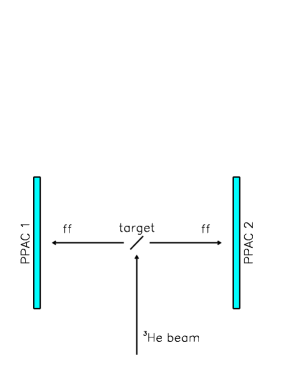
In the past, these fission reactions have been studied using small solid angle solid state counters or nuclear track detectors, see e.g. Ref. [12, 14, 29, 30]. Therefore, beamtimes on the order of weeks were necessary to measure complete excitation functions. To cover a large solid angle and, therefore, to minimize beam time, we performed an experiment using two large area parallel-plate-avalanche counters (PPACs) with an active area of 200 x 240 mm2 each. The detectors were mounted at 80∘ and 260∘ with respect to the beam axis, allowing for the detection of both fission fragments in coincidence. The PPACs were placed at a distances of 150 mm from the target to the center of each detector. As the beam energy increases the velocity of the compound nucleus in the laboratory’s frame increases, resulting in a decreasing folding angle. Since we require the detection of both fission fragments in coincidence, and our detectors are mounted at a fixed relative angle, the acceptance has a weak dependence on the bombarding energy of the projectile: For our detector setup, we have determined a geometric angular coverage between 18 and 20% for bombarding energies between 135 and 21 MeV, respectively.
The PPAC’s detector volume is divided by a cathode foil made of 2 m thick mylar foil which is set at a voltage of 450 - 550 V during operation. The readout of the cathode gives a position independent amplitude and time signal. On both sides of the cathode, signal wireplanes are mounted at a distance of 3 mm, one with horizontal and the other one with vertical oriented wires. The wires have a thickness of 20 m, the distance between the individual wires is 1 mm. Five wires are combined to a group which is read out by a delay line to reconstruct the position of the particle. An intrinsic resolution of 1.0 mm (FWHM) has been achieved in both horizontal and vertical position which allows for the measurement of the folding angle precisely. Each detector has an entrance window made of mylar foil which separates the gas atmosphere in the detector from the chamber vacuum. In the present experiment, the counters were operated by flowing isobutane gas at a constant pressure of 4 mbar.

In Fig. 2, we show a typical experimental amplitude spectrum for coincidence events. It shows that the fission peak is clearly visible and the background is negligible. Cross sections were determined for these fission events using
| (1) |
where and are the number of fission events and the number of beam particles, respectively. represents the mass number of the target, Avogadro’s constant, and the thickness of the target. Due to the incomplete angular coverage, the quantity which accounts for the geometrical acceptance and for the non-isotropic emission of the fission fragments has be be taken into account. The anisotropic angular distribution of the fission fragments has been shown to be reasonably described by the function [15]. We have used this dependence for the determination of our acceptance. The beam normalization was done using a Faraday cup. The systematic uncertainty of this method can be estimated to 15%.

In Fig. 3, we show the experimental fission cross sections for the three compound nuclei 200Tl, 211Po, and 212At as a function of excitation energy. The error bars denote both the statistical and the systematic errors. While the statistical errors dominates at the lowest energy points, the systematic uncertainties are the main contribution at higher excitation energies. The excitation energy was calculated assuming a full momentum and mass transfer of the helium ions to the compound nucleus (CN). The binding energies of 3He, the target isotopes, and the compound nuclei were taken from Ref. [31].
| E(3He) | (mbarn) | |||||
|---|---|---|---|---|---|---|
| (MeV) | 200Tl | 211Po | 212At | |||
| 21.0 | 0.0019 | 0.0004 | 0.0004 | 0.0002 | 0.0108 | 0.0023 |
| 24.0 | 0.0187 | 0.0038 | 0.0171 | 0.0036 | 0.2176 | 0.0441 |
| 27.1 | 0.0859 | 0.0175 | 0.148 | 0.030 | 1.25 | 0.25 |
| 30.8 | 0.298 | 0.060 | 0.707 | 0.141 | 3.8 | 0.8 |
| 35.0 | 0.765 | 0.154 | 2.2 | 0.4 | 10.3 | 2.1 |
| 39.7 | 1.9 | 0.4 | 6.1 | 1.2 | 19.9 | 4.0 |
| 44.9 | 3.6 | 0.7 | 11.2 | 3.9 | 33.6 | 6.7 |
| 50.6 | 6.2 | 1.3 | 19.4 | 6.3 | 54.2 | 10.9 |
| 56.8 | 10.6 | 2.1 | 31.7 | 9.3 | 78.1 | 15.6 |
| 63.4 | 15.5 | 3.1 | 46.6 | 10.5 | 100.6 | 20.2 |
| 67.1a | 18.1 | 3.6 | 52.6 | 14.5 | 115.1 | 23.1 |
| 70.6 | 23.9 | 4.8 | 72.7 | 17.9 | 143.8 | 28.8 |
| 74.4a | 30.7 | 6.2 | 89.7 | 19.9 | 160.3 | 32.1 |
| 78.3 | 34.1 | 6.8 | 99.7 | 19.4 | 178.6 | 35.8 |
| 82.3a | 33.4 | 6.7 | 96.9 | 23.6 | 177.9 | 35.7 |
| 86.5 | 42.6 | 8.5 | 117.8 | 30.6 | 211.3 | 42.3 |
| 92.5 | 63.0 | 12.6 | 152.8 | 31.4 | 243.5 | 48.8 |
| 95.2 | 56.6 | 11.3 | 157.0 | 32.6 | 255.8 | 51.3 |
| 99.9a | 59.4 | 13.1 | 162.9 | 38.1 | 253.7 | 50.8 |
| 104.4 | 67.4 | 14.9 | 190.3 | 39.3 | 282.4 | 56.6 |
| 108.5a | 71.2 | 14.3 | 196.5 | 45.5 | 285.7 | 57.2 |
| 114.1 | 78.1 | 15.6 | 227.3 | 49.2 | 318.3 | 63.7 |
| 119.0a | 88.0 | 17.6 | 245.9 | 55.6 | 333.0 | 66.7 |
| 124.3 | 94.9 | 19.0 | 277.8 | 46.3 | 358.9 | 71.9 |
| 130.0a | 86.7 | 17.4 | 231.6 | 53.7 | 305.3 | 61.2 |
| 135.0 | 100.3 | 20.1 | 268.6 | 54.3 | 351.5 | 70.4 |
III Analysis and results
We will analyze our data according to a method introduced in Ref. [9] that allows us to investigate deviations from the transition state rates and enables us to extract effective fission barriers and values for the shell effects which are independent of those obtained from the ground state masses. The transition state expression for the fission decay width [17, 18]
| (2) |
allows one to write the fission cross section as follows:
| (3) |
where is the compound nucleus formation cross section, is the decay width for fission and is the energy dependent temperature at the saddle; and are the saddle and ground state level densities, is the fission barrier, and the excitation energy. Finally, and represent the saddle and ground state rotational energies. This equation can be rewritten as
| (4) |
To further evaluate this expression, we use the form for the level density. This leads to:
| (5) |
If the transition state null hypothesis holds, plotting the left hand side of the equation versus should result in a straight line. This equation has already been used in Ref. [32] to demonstrate the scaling of over 80 excitation functions obtained by the study of the emission of complex fragments from compound nuclei like 75Br, 90,94Mo, and 110,112In.
Since the neutron width dominates the total decay width in our mass and excitation energy regime, we can write:
| (6) |
where represents the binding energy of the last neutron, is the temperature after neutron emission, and with the spin degeneracy .
The study of the fission process in the lead region forces us to take strong shell effects into account. For the fission excitation functions discussed in this paper, the lowest excitation energies for the residual nucleus after neutron emission are of the order of 15-20 MeV and therefore high enough to assume the asymptotic form for the level density [33] which is given below:
| (7) | |||
| (8) |
where is the ground state shell effect of the daughter nucleus (). For the level density at a few MeV above the saddle point, we can use
| (9) |
since the large saddle deformation implies small shell effects. Deviations due to pairing, however, may be expected at very low excitation energies. In Eq. 9, we introduced the quantity which represents an effective fission barrier, or, in other words, the unpaired saddle energy, i.e. in the case of an even-even nucleus and for nuclei with odd mass numbers. Here, is the saddle gap parameter and the density of doubly degenerate single particle levels at the saddle.
| CN | Proj. | (MeV) | (MeV) | (MeV) | ||||
|---|---|---|---|---|---|---|---|---|
| 212At | 3He | 19.5 | 1.0 | 1.008 | 0.020 | 10.7 | 1.5 | 9.6 |
| 211Po | 3He | 23.0 | 1.0 | 1.009 | 0.030 | 13.7 | 1.5 | 10.8 |
| 211Po | 4He | 23.1 | 1.5 | 1.028 | 0.050 | 13.4 | 1.5 | 10.8 |
| 200Tl | 3He | 25.1 | 1.0 | 0.995 | 0.046 | 12.1 | 1.5 | 6.6 |
Finally, the use of Eq. 8 and Eq. 9 for the level densities allows us to study the scaling of the fission probability as introduced in Eq. 5:
| (10) | |||
| (11) |
The values for , , and using can be obtained by a three parameter fit of the experimental fission excitation functions; the best results of the fits are shown in Fig. 3 and listed in Table II. For this procedure, the formation cross sections and the corresponding values for the maximum angular momentum were taken from an optical model calculation [35]. A simple parametrization, , where is the geometrical cross section, the Coulomb barrier, and the energy in the center of mass, was used to interpolate the results of the optical model calculations. Here, we used the expressions for the Coulomb barrier, , and for the geometrical cross section. The parameters and were chosen so that the resulting cross sections are in agreement with the optical model calculations. The overall uncertainty of the calculated formation cross sections can be estimated to 5%. Finally, we computed the rotational energy at the saddle assuming a configuration of two nearly touching spheres separated by 2 fm.
In a previous letter, it has been shown that the employed method allows one to extract values for the shell effect directly from the data in contrast to the standard procedure where shell effects are determined by the difference of the ground state mass and the corresponding liquid drop value [9]. Furthermore, it has been pointed out that the determination of the shell effects is completely local since it only depends on the properties of the considered nucleus.

In Fig. 4, we now plot the left hand side of Eq. 11 versus the square root of the effective excitation energy above the barrier, , including the results of the fits described above. We should note that we do not make use of the fitted value of . A remarkable straight line can be observed for the three investigated compound nuclei. This scaling extends over six orders of magnitude in the fission probability, although the shell effects are very strong in this regime. Furthermore, a linear fit to the data results in a straight line that goes through the origin and has a slope which represents the ratio , consistent with unity. The observed scaling and the lack of deviations over the entire range of excitation energy indicates that the transition state null hypothesis and the above discussed equations for the level density hold very well. The result of this work is in complete agreement with the findings of a similar analysis investigating 14 -induced fission excitation functions [9, 36].
The presentation of the experimental data in Fig. 4 and Eq. 5 implies the dominance of first chance fission. Calculations verify that first chance fission dominates completely at the lower energies. Even for the highest energy range, first chance fission still accounts for a large part of the cross sections. However, some uncertainties with the nuclear parameters, such as the barriers, shell effects occur for the higher chance fissioning nuclei. It certainly remains an interesting question to experimentally investigate first chance fission probabilities with an appropriate accuracy and to apply the results to the method introduced in Ref. [9].
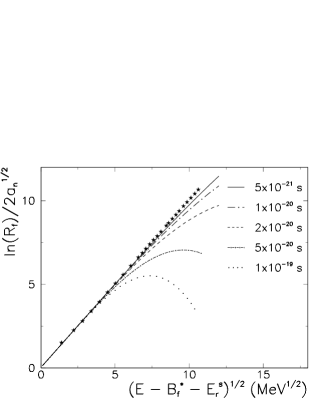
The excitation energy range covered by our experiment corresponds to life times of the compound nuclei between 10-18 and 10-22 seconds, and should therefore be sensitive to delay times in the fission process. To investigate this effect, we assume a step function for the transient time effects. In this assumption, the fission width can be written as follows:
| (12) |
where the quantity jumps from 0 at times smaller than the transient time to 1 for times larger than . Furthermore, denotes the transition state fission decay width and represents the life time of the compound nucleus. This expression for the fission decay width has been used in the formalism described above; the parameters , , and have been taken from Table II. In Fig. 5, we show the results of these calculations for the compound nucleus 211Po; the different lines indicate different assumed values of the transient time between 110-19 and 510-21 seconds. The calculated values show an obvious deviation from the experimental data for assumed transient times larger than 10-20 seconds. Since the experimental fission rates are well described by the transition state rates, it seems likely that any excess prescission emission occurs during the descent from saddle to scission. If this is the case, then the present fission results are not in contradiction with recent measurements of prescission neutrons and rays [10, 11, 19].
IV Summary
Experimentally, we have investigated 3He induced fission excitation functions of three different compound nuclei, 200Tl, 211Po, and 212At between 25 and 140 MeV excitation energy.
The data have been analyzed and discussed according to a method which allows one to check the validity of the transition state null hypothesis over a large range of excitation energy and a regime of compound nuclei masses which is characterized by strong shell effects. Once these shell effects are accounted for, no deviation from the transition state rate is observed. Furthermore, the shell effects can be determined directly from the experimental data by using the above described procedure. Finally, plotting the reduced fission rate allows one to look for evidence of fission delay times as they have been discussed in a series of papers. Our results, however, indicate that the proposed transient times – if they exist – are shorter than 10-20 seconds.
Acknowledgement
The authors would like to thank the staff of the 88-Inch Cyclotron
for the excellent support, i.e. the fast changes of beam energies.
Discussions with M.-E. Brandon are gratefully acknowledged.
This work was supported by the Director, Office of Energy Research,
Office of High Energy and Nuclear Physics, Nuclear Physics Division
of the US Department of Energy, under contract DE-AC03-76SF00098.
REFERENCES
- [1] O. Hahn and F. Strassmann, Naturwiss. 26, 756 (1938), O. Hahn and F. Strassmann, Naturwiss. 27, 11 (1939), L. Meitner and O.R. Frisch, Nature 3615, 239 (1939).
- [2] K.H. Schmidt, A. Heinz, H.-G. Clerc, B. Blank, T. Brohm, S. Czajkowski, C. Donzaud, H. Geissel, E. Hanelt, H. Irnich, M.C. Itkis, M. de Jong, A. Junghans, A. Magel, G. Münzenberg, F. Nickel, M. Pfützner, A. Piechaczek, C. Röhl, C. Scheidenberger, W. Schwab, S. Steinhäuser, K. Sümmerer, W. Trinder, B. Voss, S.V. Zhdanov, Phys. Lett. B 325, 313 (1994).
- [3] M. Bernas, S. Czajkowski, P. Armbruster, H. Geissel, Ph. Dassagne, C. Donzaud, H.-R. Faust, E. Hanelt, A. Heinz, M. Hesse, C. Kozhuharov, Ch. Miehe, G. Münzenberg, M. Pfützner, C. Röhl, K.-H. Schmidt, W. Schwab, C. Stéphan, K. Sümmerer, L. Tassan-Got, B. Voss, Phys. Lett. B 331, 19 (1994).
- [4] S. Polikanov, W. Brüchle, H. Folger, E. Jäger, T. Krogulski, M. Schädel, E. Schimpf, G. Wirth, T. Aumann, J.V. Kratz, and N. Stiel, N. Trautmann, Z. Phys. A 350, 221 (1994).
- [5] H.-G. Clerc, M. de Jong, T. Brohm, M. Dornik, A. Grewe, E. Hanelt, A. Heinz, A. Junghans, C. Röhl, S. Steinhäuser, B. Voss, C. Ziegler, K.-H. Schmidt, S. Czajkowski, H. Geissel, H. Irnich, A. Magel, G. Münzenberg, F. Nickel, A. Piechaczek, C. Scheidenberger, W. Schwab, K. Sümmerer, W. Trinder, M. Pfützner, B. Blank, A. Ignatyuk, and G. Kudyaev, Nucl. Phys. A 590, 785 (1995).
- [6] A.V. Ignatyuk, G.A. Kudyaev, A. Junghans, M. de Jong, H.-G. Clerc, and K.-H. Schmidt, Nucl. Phys. A593, 519 (1995)
- [7] Th. Rubehn, W.F.J. Müller, R. Bassini, M. Begemann-Blaich, Th. Blaich, A. Ferrero, C. Groß, G. Immé, I. Iori, G.J. Kunde, W.D. Kunze, V. Lindenstruth, U. Lynen, T. Möhlenkamp, L.G. Moretto, B. Ocker, J. Pochodzalla, G. Raciti, H. Sann, A. Schüttauf, W. Seidel, V. Serfling, W. Trautmann, A. Trzcinski, G. Verde, A. Wörner, E. Zude, and B. Zwieglinski, Z. Phys. A 353, 197 (1995); Phys. Rev. C 53, 993 (1996); Phys. Rev. C (in print).
- [8] P. Armbruster, M. Bernas, T. Aumann, S. Czajkowski, H. Geissel, Ph. Dessagne, C. Donzaud, E. Hanelt, A. Heinz, M. Hesse, C. Kozhuharov, Ch. Miehe, G. Münzenberg, M. Pfützner, K.-H. Schmidt, W. Schwab, C. Stephan, K. Sümmerer, L. Tassan-Got, and B. Voss, Z. Phys. A (submitted).
- [9] L.G. Moretto, K.X. Jing, R. Gatti, R.P. Schmitt, and G.J. Wozniak, Phys. Rev. Lett. 75, 4186 (1995).
- [10] D. Hilscher and H. Rossner, Ann. Phys. Fr. 17, 471 (1992).
- [11] P. Paul and M. Thoennessen, Ann. Rev. Nucl. Part. Sc. 44, 65 (1994).
- [12] G. M. Raisbeck and J.W. Cobble, Phys. Rev. 153, 1270 (1967).
- [13] L.G. Moretto, S.G. Thompson, J. Routti, and R.C. Gatti, Phys. Lett. 38B, 471 (1972).
- [14] A. Khodai-Joopari, Ph.D. thesis, University of California at Berkeley, 1966.
- [15] R. Vandenbosch, J.R. Huizenga, Nuclear Fission (Academic Press, New York, 1973) and references therein.
- [16] C. Wagemans, The Nuclear Fission Process (CRC Press, Boca Raton - Ann Arbor - Boston - London, 1991) and references therein.
- [17] E. Wigner, Trans. Faraday Soc. 34, 29 (1938).
- [18] N. Bohr and J.A. Wheeler, Phys. Rev. 56, 426 (1939).
- [19] M. Thoennessen and G.F. Bertsch, Phys. Rev. Lett. 71, 4303 (1993).
- [20] P. Grangé and H.A. Weidenmüller, Phys. Lett. B96, 26 (1980).
- [21] P. Grangé, L. Jun-Qing, and H.A. Weidenmüller, Phys. Rev. C 27, 2063 (1983).
- [22] H.A. Weidenmüller and Z. Jing-Shang, Phys. Rev. C 29, 879 (1984).
- [23] P. Grangé, S. Hassani, H.A. Weidenmüller, A. Gavron, J.R. Nix, and A.J. Sierk, Phys. Rev. C 34, 209 (1986).
- [24] L. Zhongdao, Z. Jingshang, F. Renfa, and Z. Yizhong, Z. Phys. A 323, 477 (1986).
- [25] Z.-D. Lu, B. Chen, J.-S. Zhang, Y.-Z. Zhuo, and H.-Y. Han, Phys. Rev. C 42, 707 (1990).
- [26] D. Cha and G.F. Bertsch, Phys. Rev. C 46, 306 (1992).
- [27] P. Fröbrich, I.I. Gontchar, and N.D. Mavlitov, Nucl. Phys. A 556, 281 (1993).
- [28] K. Siwek-Wilczyńska, J. Wilczyński, R.H. Siemssen, and H.W. Wilschut, Phys. Rev. C 51, 2054 (1995).
- [29] R.H. Iyer, A.K. Pandey, P.C. Kalsi, and C. Sharma, Phys. Rev. C 44, 2644 (1991).
- [30] F.D. Becchetti, K.H. Hicks, C.A. Fields, R.J. Peterson, R.S. Raymond, R.A. Ristinen, J.L. Ullmann, and C.S. Zaidins, Phys. Rev. C 28, 1217 (1983).
- [31] G. Audi and A.H. Wapstra, Nucl. Phys. A 565, 1 (1993).
- [32] L.G. Moretto, K.X. Jing, and G.J. Wozniak, Phys. Rev. Lett. 74, 3557 (1995).
- [33] J.R. Huizenga and L.G. Moretto, Ann. Rev. Nucl. Sci. 22, 427 (1972).
- [34] W.D. Myers and W.J. Swiatecki, Table of nuclear masses according to the 1994 Thomas - Fermi model, (Lawrence Berkeley National Laboratory, LBL-36803, 1994).
- [35] Optical model code ptolemy, M.H. Macfarlane and S.C. Pieper, (Argonne National Laboratory, ANL-76-11, 1978).
- [36] Th. Rubehn, K.X. Jing, L.G. Moretto, L. Phair, K. Tso, and G.J. Wozniak, in Proceedings of the 12th Winter Workshop on Nuclear Dynamics, Snowbird, Utah, 1996, edited by W. Bauer and G.D. Westfall [Plenum Press, 1996] (in press)