Purdue University
West Lafayette, IN 47907, USA
Fluctuations and Correlations in STAR
Abstract
The study of correlations and fluctuations can provide evidence for the production of the quark-gluon plasma (QGP) in relativistic heavy ion collisions. Various theories predict that the production of a QGP phase in relativistic heavy ion collisions could produce significant event-by-event correlations and fluctuations in, transverse momentum, multiplicity, etc. Some of the recent results using STAR at RHIC will be presented along with results from other experiments at RHIC. The focus is on forward-backward multiplicity correlations, balance function, charge and transverse momentum fluctuations, and correlations.
pacs:
25.75.-q Relativistic heavy-ion collisions, 25.75.Gz Particle correlations1 Introduction
The investigation of high energy nucleus-nucleus collisions provides a unique tool to study the properties of hot and dense matter. The motivation is drawn from lattice QCD calculations, which predicts a phase transition from hadronic matter to a system of deconfined quarks and gluons (QGP) at high temperaturebib1 . The study of event-by- event fluctuations provides a novel probe to explore such transition in the search for the QGP. It is now possible with large acceptance experiments at SPS and RHIC.
2 Forward-Backward Multiplicity Correlations
The measurement of particle correlations has been suggested as a method to search for the existence of a phase transition in ultra-relativistic heavy ion collisionsbib2 ; bib3 ; bib4 . If the quark-gluon plasma (QGP) is formed in these collisions, the existence or absence of particle correlations could lead to a determination of the presence of partonic degrees of freedom. A linear relationship has been found in high-energy colliding hadron experiments between the multiplicity in a forward region () and average multiplicity in a backward region ()bib5 ; bib6 :
| (1) |
The coefficient b is referred to as the correlation coefficient and it can be expressed in terms of the expectation value bib5 :
| (2) |
where and are the backward-forward and
forward-forward dispersions, respectively. This result is exact and model independent bib5 .
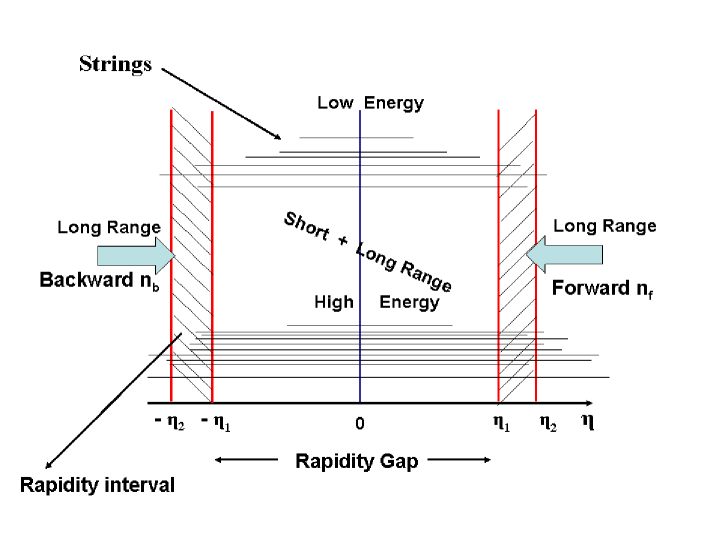
Short and long-range (in rapidity) multiplicity correlations are predicted as a signature of string fusion bib7 ; bib8 . The short range correlations are confined to midrapidity, while long range correlations are extended more than 2 units in rapidity. When strings fuse, a reduction in the long-range forward-backward correlation is expected. The existence of long-range multiplicity correlations may indicate the presence of multiple partonic inelastic collisions. These correlations arise from the superposition of a fluctuating number of strings, such that bib5 :
| (3) |
with the fluctuation in the number of inelastic collisions and the average multiplicity produced from a single inelastic collision. Therefore, should be sensitive to the presence of long-range multiplicity correlations.
We discuss the result on forward-backward multiplicity correlations from 200 GeV Au+Au collisions for all charged particles with in the range from 0.1 to 1.2 GeV/c, to ensure a sampling of soft particles only. To eliminate short-range correlations, a gap in pseudorapidity () of 1.6 units is considered bib4 . The forward pseudorapidity interval was and the backward was tjt .
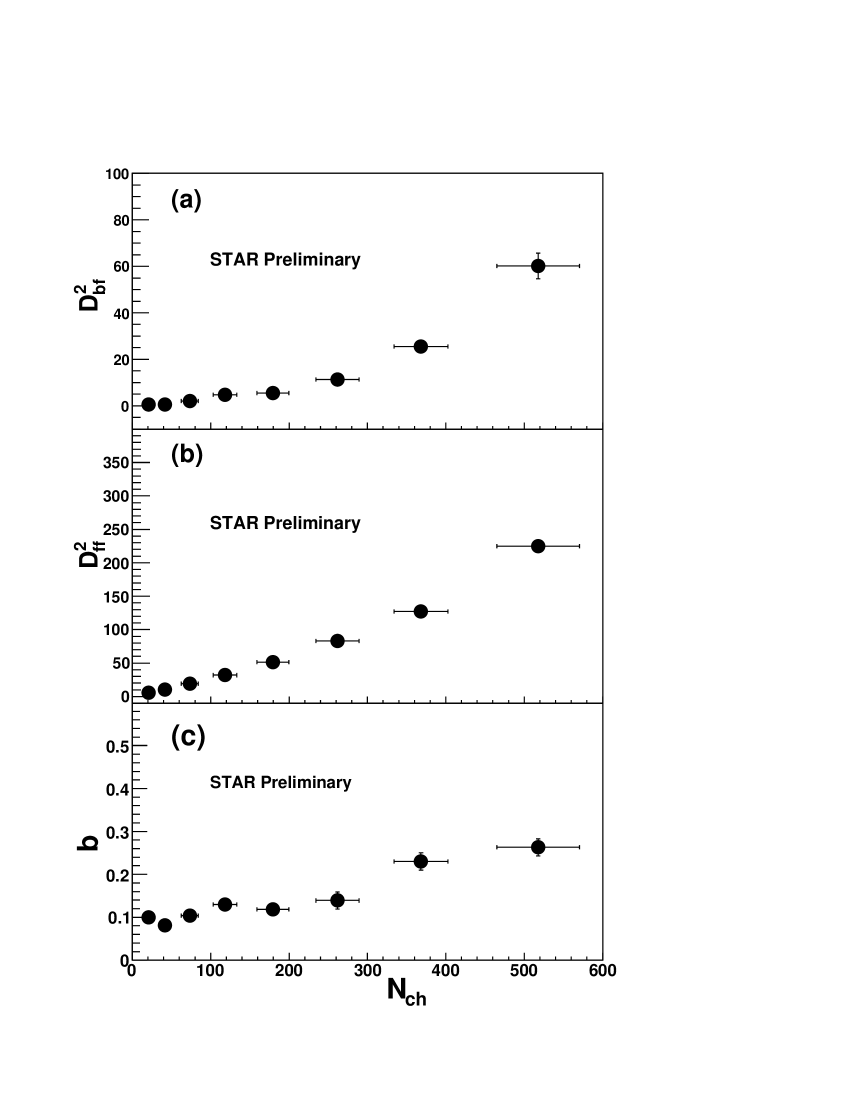
Fig. 2 shows the results for , , and the correlation coefficient, b, as a function of for the 8 centrality bins. The presence of long-range multiplicity correlations are evident from and b. The growth of as a function of is consistent with an increasing long-range correlation from peripheral to central heavy-ion collisions, corresponding to a greater number of fluctuating strings.
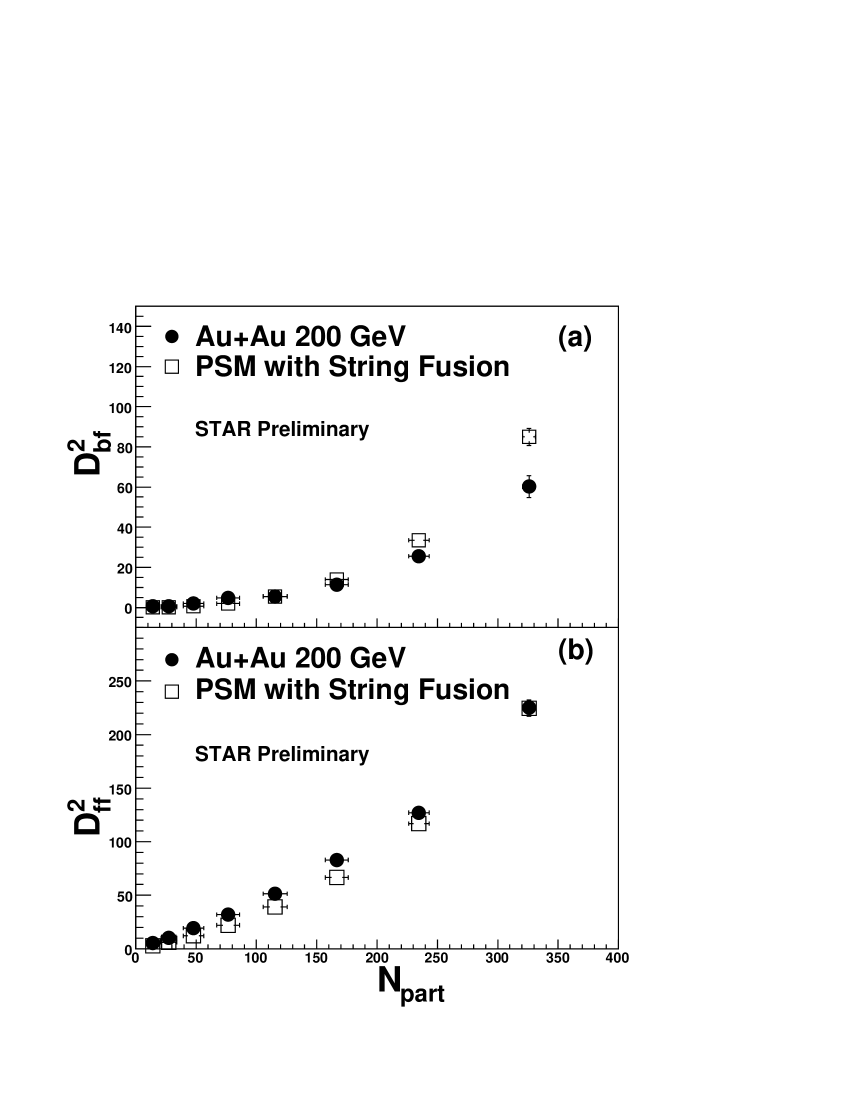
The comparison of and as calculated from the Au+Au data to that from the Parton String Model (PSM) bib9 ; bib10 with the string fusion on or off is presented in Figs. 3 and 4, respectively. The PSM (with two string fusion) minbias multiplicity distribution closely matches that of the corrected Au+Au data. It also describes the enhancement, particle ratios, strangeness production, etc., seen in Au+Au collisions at RHIC bib9 . As such, the centrality cuts in the PSM correspond to the same percentage of the minimum bias cross section as in the data and are plotted as a function of the number of participant nucleons in the collision (), calculated from Monte Carlo Glauber model bib11 . The statistical and systematic uncertainties in Figs. 3 and 4 are the same as those described for Fig. 2.

Figs. 3 and 4 show good agreement in peripheral collisions between data and the independent (no string fusion) or collective (with string fusion) model. In central Au+Au collisions, with the independent string description deviates from the data, but shows good agreement for fusion of two soft strings. This confirms the agreement in multiplicity between the PSM (with two string fusion) and data. However, there is a large discrepancy in for central collisions for both the independent and collective PSM, compared to the data. This discrepancy is greater for the case of independent strings (Fig. 3). This suggests an additional, dynamical reduction in the number of particle sources in central Au+Au collisions, greater than that provided by the fusion of two soft strings (Fig. 4).
3 Transverse Momentum Distributions and String Percolation
It is postulated that in the collision of two nuclei at high-energy, color strings are formed between projectile and target partons. These color strings decay into additional strings via production, and ultimately hadronize to produce the observed hadron yields perc1 . In the collision process, partons from different nucleons begin to overlap and form clusters in transverse space. The color strings are of radius r0 = 0.20-0.25 fm perc1 . The fusion of strings to form clusters is an evolution of the Dual Parton Model bib6 , which utilizes independent strings as particle emitters, to the Parton String Model (PSM), which implements interactions (fusion) between strings perc2 . At some point, a cluster will form which spans the entire system. This is referred to as the maximal cluster and marks the onset of the percolation threshold. An overview of percolation theory can be found in the following reference perc3 . The quantity , the percolation density parameter, can be used to describe overall cluster density. It can be expressed as
| (4) |
with N the number of strings, S the total nuclear overlap area, and the transverse disc area. At some critical value of , the percolation threshold is reached. is referred to as the critical percolation density parameter. In two dimensions, for uniform string density, in the continuum limit, = 1.175 perc4 .
To calculate the percolation parameter, , a parameterization of pp events at 200 GeV is used to compute the distribution
| (5) |
where a, , and n are parameters fit to the data. This parameterization can be used for nucleus-nucleus collisions if one takes into account the percolation of strings by perc1
| (6) |
where and are the transverse overlap area produced by a single and N number of strings respectively. In pp collisions at 200 GeV, the quantity , due to low string overlap probability in pp collisions. Once the distribution for nucleus-nucleus collisions is determined, the multiplicity damping factor can be defined in the thermodynamic limit as perc5
| (7) |
which accounts for the overlapping of discs, with corresponding to the fractional area covered by discs.
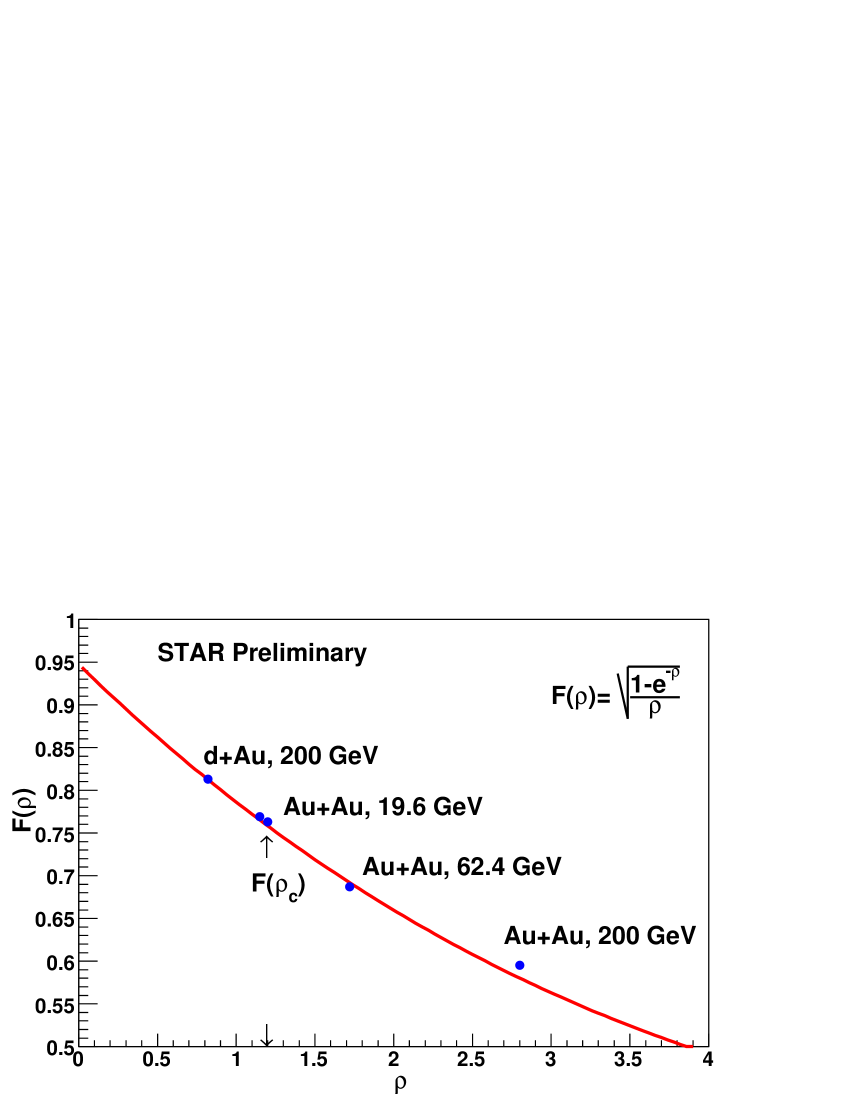
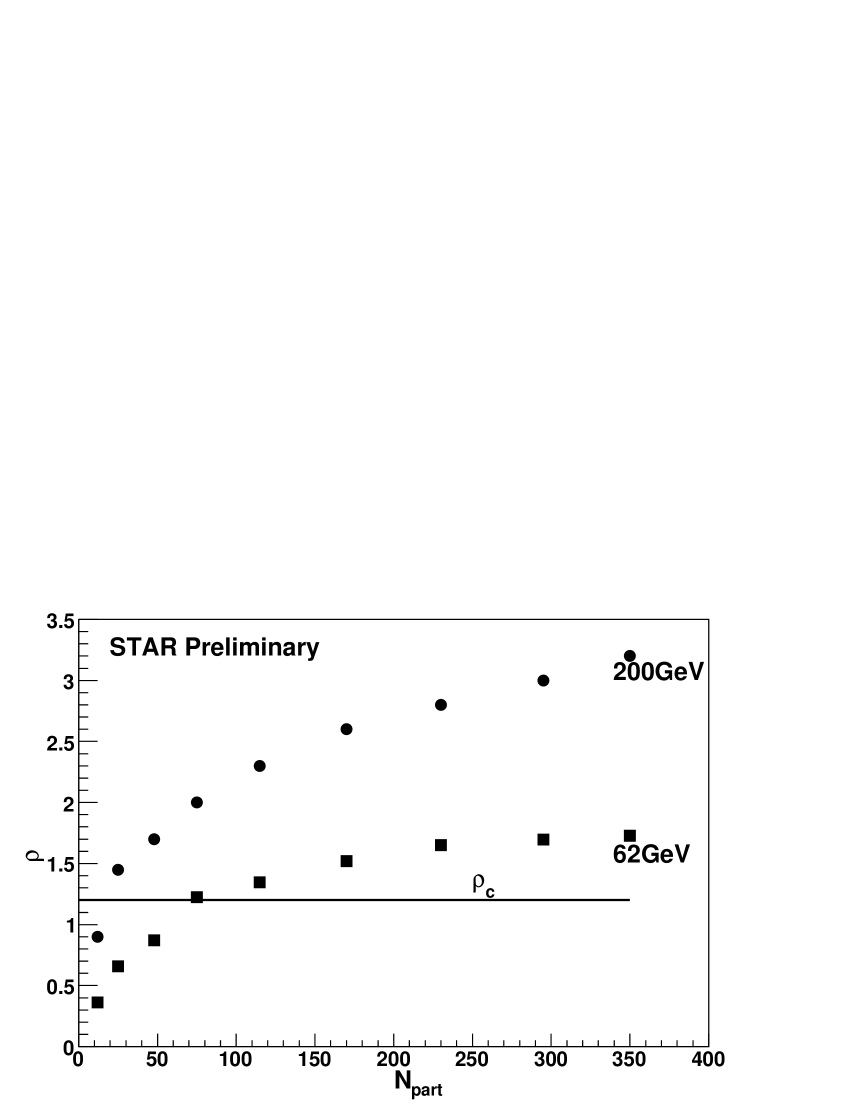
The percolation density parameter, , has been determined for several collision systems and energies. These results have been compared to the predicted value of the critical percolation density, . If is exceeded it is expected that the percolation threshold has been reached, indicating the formation of a maximal cluster that spans the system under study. Figure 5 is a plot of the quantity F() versus the percolation density parameter, (), for central collisions. One can also consider the percolation density as a function of centrality in Au+Au collisions. The centrality expressed in terms of the number of participating nucleons () as found from Monte Carlo Glauber calculations tjt . More central collisions correspond to greater values of . Figure 6 shows as a function of the number of participant nucleons in Au+Au collisions at 200 and 62.4 GeV perc6 . For almost all collision centralities, 200 GeV Au+Au exceeds the critical percolation threshold, . In 62.4 GeV Au+Au, all except the three most peripheral bins exceed .
4 Balance Function
The balance function is based on the principle that charge is locally conserved when particles are produced in pairs bal1 ; bal2 .
| (8) |
where is the number of charged pairs in a given pseudorapidity range, similarly for , and . () is the number of positive (negative) charged particles sum over all the events. is the width of the balance function. If the system exists in a deconfined phase for an extended time and the charged pairs are produced at hadronization, the pairs will retain more of their correlation in rapidity.
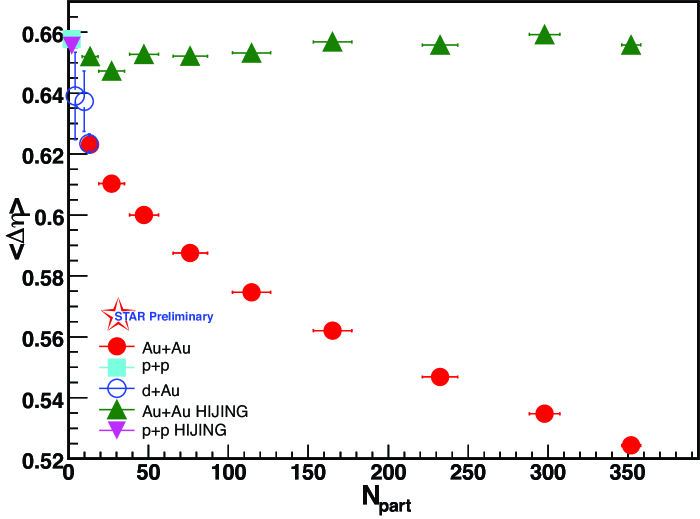
The balance function may be sensitive to whether the transition to a hadronic phase was delayed, as expected if the quark-gluon phase were to exist for a longer time. In Fig. 7 the balance function widths for p+p, d+Au and Au+Au collisions at GeV are shown as a function of the number of participants bal3 . The balance function widths scale with . The widths predicted using HIJING calculations are also shown in Fig. 7, along with data, and show little dependence on centrality and are similar to those measured for . The measured B in central Au+Au collisions is consistent with trends of model incorporating late hadronization.
5 Charge Fluctuations
Combined analysis of fluctuations in, e.g.,total and net charge for positively and negatively charged particles, as well as their ratios can reveal interesting physics. One of the quantity related to fluctuations is net charge fluctuations and is the difference of the number of produced positively and negatively charged particles measured in a fixed rapidity range, defined as char1 ; char2
| (9) |
where and are multiplicities of positive and negative particles. The magnitude of the variance, , is determined both by statistical and dynamical fluctuations, = . Details of net charge fluctuations analysis can be found in references char3 .
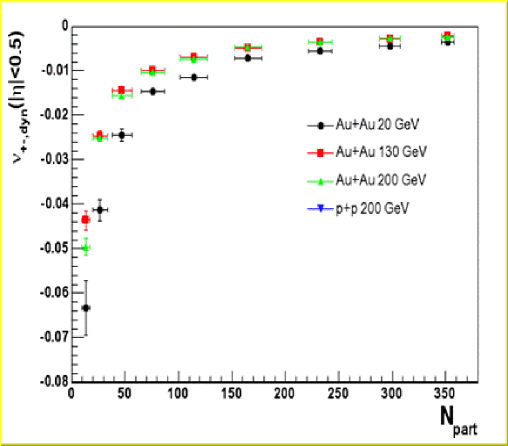
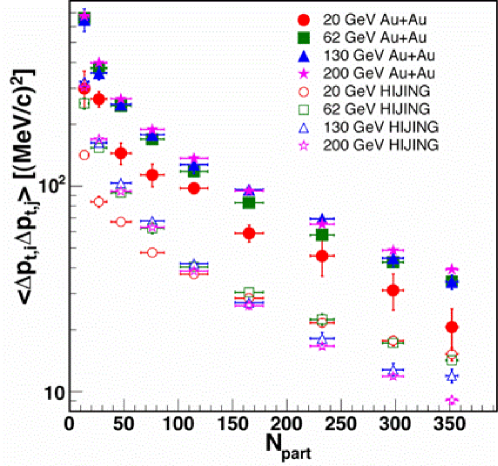
In Fig.8 the is shown for Au+Au collisions at 20, 130, and 200 GeV along with the data for all charged particles with 0.5 and 0.1 5 GeV/c as a function of number of participants char4 . One can see that shows very little dependence on incident energy.
One must however correct measured to account for charge conservation char4 . Fig. 9 show the plot of = + 4/ as a function of beam energy. The total charged particle multiplicity is given by . Fig. 9 also shows the results from other experiments for comparison. The net charge fluctuations are smaller than expected based on predictions from a resonance gas or a quark gluon gas, which undergoes fast hadronization.
6 Fluctuations
Event-by-event fluctuations of mean have been proposed as a possible signature to search for the phase transition pt1 ; pt2 ; pt3 . Fluctuations involve a statistical component arising from the stochastic nature of particle production, as well as a dynamic component determined by correlations arising in various particle production processes. There are several measures to evaluate mean fluctuations. STAR has used pt4 and pt5 as the measure of the dynamical fluctuations. gives the normalized fluctuation in CERES experiment pt6 . Another measure, , is defined as a deviation from 1 of the ratio of the rms of the event-by-event mean distribution in real events to that in mixed events(PHENIX) pt7 . To characterize transverse momentum correlation, the quantity was calculated. Fig. 10 shows for Au+Au collisions at = 20, 62, 130 and 200 GeV. One observes that decreases with centrality. These results are also compared with HIJING calculations as shown in Fig. 10. The values for predicted by HIJING are always smaller than the data pt4 .
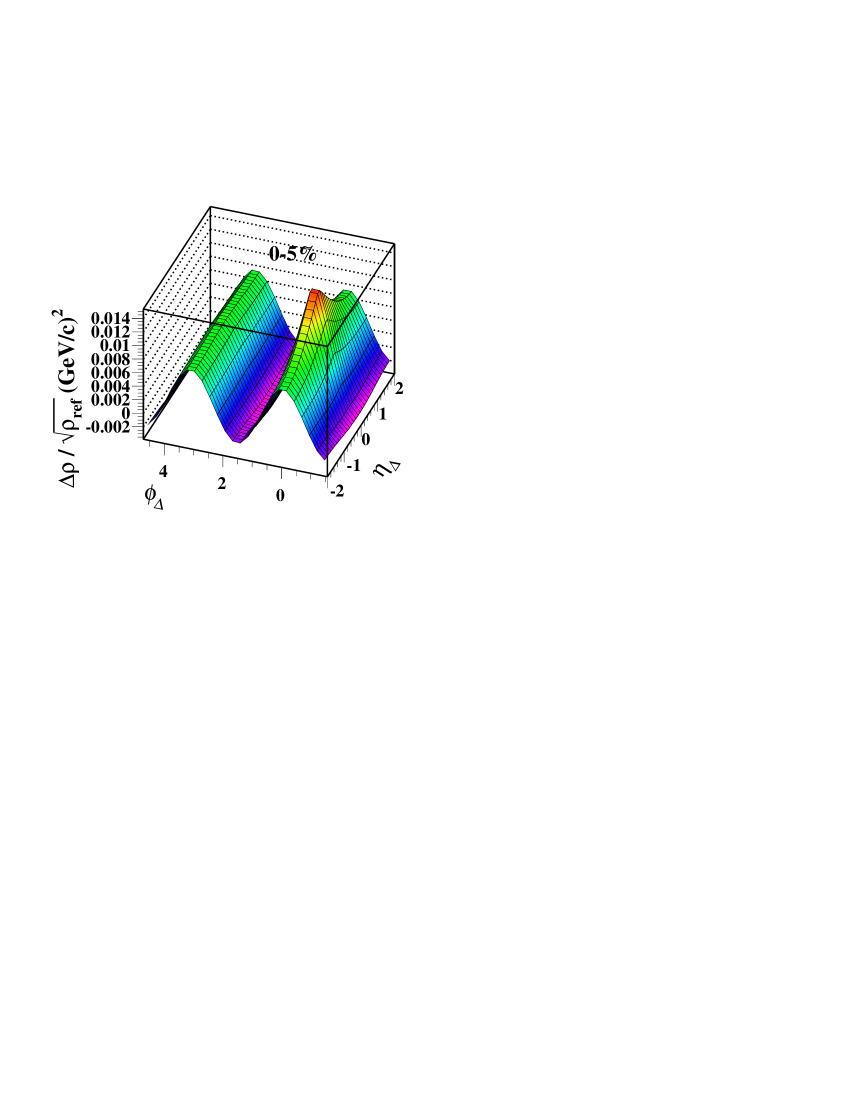
The pseudorapidity and azimuth () bin size dependence of event-wise mean transverse momentum fluctuations has been measured in terms of pt5 ; pt5x . To access underlying dynamics, the corresponding autocorrelations () were extracted and are shown in Fig. 11 for 0-5% central Au+Au collisions. The general form of the autocorrelations suggests that the basic correlation mechanism is parton fragmentation pt5x .
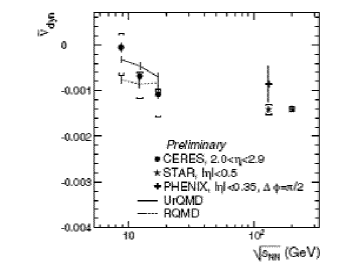
also measures the dynamical fluctuations and is proportional to mean covariance of all charged particle pairs per event. Fig. 12 shows as a function of the nucleon-nucleon center of mass energy from SPS to RHIC energies. The observed fluctuations at SPS and at RHIC are about 1%. is approximately proportional to , where is the mean charged particle multiplicity.
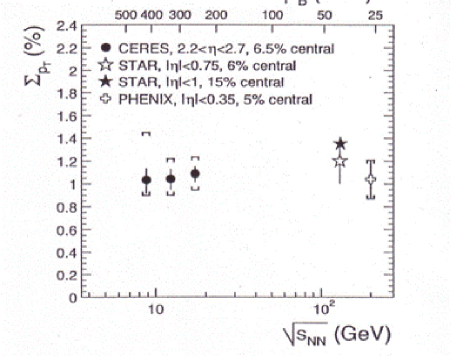
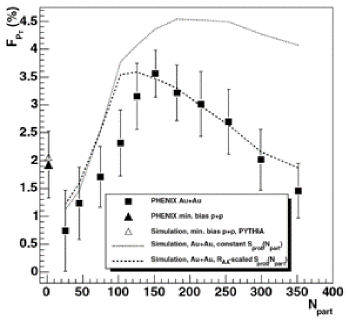
Fig. 13 shows the magnitude of as a function of centrality for Au+Au collisions with = 2.0 GeV/c. A significant non random fluctuation is seen that appears to peak in mid central collisions pt7 .
7 Summary
Some results from fluctuation and correlation measurements in STAR have been presented.
The forward-backward multiplicity correlation in Au+Au shows collective behavior and a fusion/percolation approach has been explored
to understand this.
The narrowing of balance function
width in central collisions is consistent
with trends
predicted by models incorporating delayed hadronization.
The net charge dynamical fluctuations are found to be negative and
smaller than the value expected from a resonance or quark-gluon gas.
Transverse momentum correlations and fluctuations show interesting physics which need further exploration.
References
- (1) F. Karsch et al., Nucl. Phys. B605 (2001) 579.
- (2) R.C. Hwa, Eur. Phys. J. C38 (1988) 277.
- (3) J. Dias de Deus, C. Pajares, and C.A. Salgado, Phys. Lett. B407 (1997) 335.
- (4) M.A. Braun et al., Eur. Phys. J. C32 (2004) 535.
- (5) A. Capella and A. Krzywicki, Phys. Rev. D184 (1978) 120.
- (6) A. Capella et al., Phys. Report 236 (1994) 225.
- (7) N. S. Amelin et al., Phys. Rev. Lett. 73 (1994) 2813.
- (8) N. Armesto et al., Z. Phys. C67 (1995) 489.
- (9) T. J. Tarnowsky (STAR Collaboration), nucl-ex/0606018.
- (10) N. S. Amelin et al., Euro. Phys. J. C22 (2001) 149.
- (11) N. Armesto, C. Pajares, and D. Sousa, Phys. Lett. B527 (2002) 92.
- (12) J. Adams et al. (STAR Collaboration), nucl-ex/0311017.
- (13) M. A. Braun, F. del Moral, and C. Pajares, Nucl. Phys. A715 (2003) 791.
- (14) M. A. Braun and C. Pajares, Nucl. Phys. B390 (1993) 542.
- (15) M. Isichenko, Rev. Mod. Phys. 64 (1992) 861.
- (16) H. Satz, Rep. Prog. Phys. 63 (2000) 1511.
- (17) M. A. Braun, F. del Moral, and C. Pajares, Phys. Rev. C65 (2002) 024907.
- (18) B. K. Srivastava, R. P. Scharenberg, and T. J. Tarnowsky (STAR Collaboration), nucl-ex/0606019.
- (19) S. A. Bass, P. Danielewicz, and S. Pratt, Phys. Rev. Lett. 85 (2000) 2689.
- (20) J. Adams et al. (STAR Collaboration), Phys. Rev. Lett. 90 (2003) 172301.
- (21) G. D. Westfall (STAR Collaboration), J. Phys. G30 (2004) S1389.
- (22) C. Pruneau, S. Gavin, and S. Voloshin, Phys. Rev. C66 (2002) 044904.
- (23) V. Koch et al., Nucl. Phys. A698 (2002) 261.
- (24) J. Adams et al. (STAR Collaboration), Phys. Rev. C68 (2003) 044905.
- (25) C. Pruneau (STAR Collaboration), Nucl. Phys. A774 (2006) 651.
- (26) M. Stephanov, K. Rajagopal, and E. Shuryak, Phys. Rev. Lett, 81 (1998) 4816.
- (27) S. A. Voloshin, V. Koch, and H. G. Ritter, Phys. Rev. C60 (1999) 024901.
- (28) H. Heiselberg, Phys. Rep, 351 (2001) 161.
- (29) J. Adams et al. (STAR Collaboration), Phys. Rev. C72 (2005) 044902.
- (30) J. Adams et al. (STAR Collaboration), Phys. Rev. C71 (2005) 064906.
- (31) J. Adams et al. (STAR Collaboration), J. Phys. G32 (2006) L37.
- (32) H. Sako and H. Appelshauser (CERES Collaboration), J. Phys. G30 (2004) S1371.
- (33) S. S. Adler et al. (PHENIX Collaboration), Phys. Rev. Lett. 93 (2004) 092301.