Applicability of Monte Carlo Glauber models to relativistic heavy ion collision data
Abstract
The accuracy of Monte Carlo Glauber model descriptions of minimum-bias multiplicity frequency distributions is evaluated using data from the Relativistic Heavy Ion Collider (RHIC) within the context of a sensitive, power-law representation introduced previously by Trainor and Prindle (TP). Uncertainties in the Glauber model input and in the mid-rapidity multiplicity frequency distribution data are reviewed and estimated using the TP centrality methodology. The resulting errors in model-dependent geometrical quantities used to characterize heavy ion collisions (i.e. impact parameter, number of nucleon participants , number of binary interactions , and average number of binary collisions per incident participant nucleon ) are presented for minimum-bias Au-Au collisions at = 20, 62, 130 and 200 GeV and Cu-Cu collisions at = 62 and 200 GeV. Considerable improvement in the accuracy of collision geometry quantities is obtained compared to previous Monte Carlo Glauber model studies, confirming the TP conclusions. The present analysis provides a comprehensive list of the sources of uncertainty and the resulting errors in the above geometrical collision quantities as functions of centrality. The capability of energy deposition data from trigger detectors to enable further improvements in the accuracy of collision geometry quantities is also discussed.
pacs:
25.75.-q1 Introduction
Observables in relativistic heavy ion experiments are often reported as functions of measured total inelastic cross section fraction (centrality) and are related to the initial collision geometry using Monte Carlo Glauber (MCG) or optical Glauber models [1, 2, 3]. An example is charged particle multiplicity versus number of participating nucleons . It is therefore imperative that the level of accuracy of the Glauber models be understood and that relevant experimental information be used to estimate collision centrality. For instance, previous studies [1, 2, 4] concluded that the uncertainties in relating peripheral collision data to the corresponding initial collision geometry were very large, thus contributing to the omission of those data from publications [1]. In another example, studies of high- suppression of charged particle production for peripheral to mid-central collisions are presently limited by large uncertainties in the estimated number of binary collisions which is used as a scaling variable [5].
In this work we re-examine the accuracy of Monte Carlo Glauber model descriptions of minimum-bias multiplicity frequency distribution data from RHIC using updated density and multipliciity production model parameters and a sensitive power-law inspired representation introduced by Trainor and Prindle (TP) [6]. After demonstrating the accuracy of our Monte Carlo Glauber model in describing RHIC data we then use the power-law analysis method of Ref. [6] to estimate the uncertainties in the mapping relationships between initial stage collision geometry quantities and centrality for heavy ion collision systems relevant to the RHIC program. We find that previous uncertainties [1, 2, 4] in centrality measures are too pessimistic.
The centrality analysis method of Trainor and Prindle [6] exploits the approximate power-law dependence of the multiplicity frequency distribution data ( is the number of triggered events) for minimum-bias 111A minimum-bias trigger typically refers to the detection of forward going spectator fragments from both colliding nuclei plus a minimal requirement for particle production transverse to the beam direction. Each of the four RHIC experiments utilize a common lowest level trigger detector system based on calorimetric detection of neutrons at zero degree scattering angle using two zero-degree calorimeters (ZDC) placed symmetrically upstream and downstream from the beam-beam intersection region. The minimum-bias trigger systems for the STAR, PHENIX, PHOBOS and BRAHMS experiments are described in Nucl. Instrum. Meth. A 499, Nos. 2-3 (2003). collisions and uses proton-proton (p-p) multiplicity production data to constrain the peripheral collision end-point of the distribution. Their analysis demonstrates that uncertainties in centrality determination and MCG geometry measures can be significantly reduced, particularly in the peripheral region.
In this paper MCG results and errors for centrality bin average quantities (mean impact parameter), , , and [7] are presented for minimum-bias Au-Au collisions at = 20, 62, 130 and 200 GeV and for Cu-Cu at 62 and 200 GeV. In this study centrality is based on charged particle production at midrapidity. Other centrality definitions appear in the literature but will not be considered here. However, the MCG model and analysis methods presented here and in Ref. [6] can be readily extended to any practical centrality determination method.
The MCG model and updated input parameters are discussed in Sec. 2. The accuracy of the model for describing data from RHIC is demonstrated in Sec. 3. MCG predictions and errors are presented and discussed in Sec. 4. Comparison of the MCG results and analytic parametrizations from Ref. [6] are presented in Sec. 5. In Sec. 6 we demonstrate via simulations how energy deposition data from transverse particle production, which are generally available at the trigger level from the RHIC experiments [8], can be used to further reduce the impact of background contamination and to mitigate the effects of event loss due to trigger and collision vertex finding inefficiencies. A summary and conclusions are presented in Sec. 7. Computational details are contained in three appendixes at the end.
2 Monte Carlo Glauber Model
The Monte Carlo Glauber collision model used here is based on a standard set of assumptions [3] which are appropriate for ultra-relativistic heavy ion collisions. These assumptions include the characterization of the collision in terms of a classical impact parameter , straight-line propagation of each incident nucleon through the oncoming nucleus, and a fixed transverse interaction range determined by the nucleon-nucleon (N-N) total inelastic cross section () in free space. The impact parameter was selected at random and the positions of the nucleons relative to the geometrical centers of the colliding nuclei were randomly distributed according to a spherical density . Center-of-mass constraints were not imposed on the nucleon positions. Nucleon pairs in the colliding nuclei were assumed to interact hadronically if their relative impact parameter was .
Charged hadron multiplicity was assigned using the phenomenological two-component model of Kharzeev and Nardi [9] for “soft” plus “hard” particle production processes where the mean number of charged hadrons in the acceptance () per unit pseudorapidity () was computed according to
| (1) |
Parameters and depend on collision energy. Event-wise multiplicities were obtained by sampling the Gaussian distribution [9]
| (2) |
where is a multiplicity fluctuation width parameter. Alternate distributions (e.g. Poisson, negative binomial [10]) produce quantitative effects on the multiplicity frequency distribution for very peripheral collisions but do not affect the present estimates of systematic errors. and were both required to be in order for the simulated collision to be used in the analysis. Centrality bins were defined using the multiplicity frequency distribution . Centrality bin average quantities, , , and , were calculated using the events within each bin. The acceptance for this study was and full in azimuth.
2.1 Matter Densities
Monte Carlo Glauber simulations require the distribution of the centers of the nucleons in the nuclear ground state, , the point-matter density. For 63Cu and 197Au these were estimated using the measured charge densities [11] and the Hartree-Fock calculations of Negele using the Density Matrix Expansion (DME) framework [12] for the neutron - proton density differences. The charge densities for 63Cu and 197Au were represented by a Woods-Saxon distribution,
| (3) |
where the radius and diffuseness parameters are listed in Table 1.
-
Density 63Cu 197Au Parameter Empiricala DMEb Empiricala DMEb 4.2140.026 4.232 6.380.06 6.443 0.5860.018 0.5350.027 3.9250.022 3.899 5.330.05 5.423 4.1950.085 4.213 6.430.10 6.495 0.5810.031 0.5680.047 3.901 3.875 5.41 5.502 -
a Charge density results based on electron scattering analysis [11]; estimates of point matter densities as discussed in the text.
-
b Density Matrix Expansion predictions [12].
The point matter densities assumed for the present analysis are spherically symmetric with a Woods-Saxon radial distribution where the half-density and rms radii were estimated by adding the Hartree-Fock DME point matter – charge distribution differences to the measured charge density radii where,
| (4) |
where and denote the measured radii from electron scattering while the quantities in the square brackets are the DME predictions. The diffusivity parameter was obtained from the quantities in Eq. (4) and the approximate relation, [13]. The nominal radius and diffusivity parameters assumed here for Au and Cu are listed in Table 1.
The uncertainties in and were obtained by summing the independent errors in the proton [11] and neutron point matter densities in quadrature. The latter is constrained by theoretical and experimental information about the neutron - proton density difference. Theoretical nuclear structure model predictions for the neutronproton rms radii differences for isotopes in the Cu and Au mass range agree to within about fm [14]. In general the theoretical predictions agree with analyses of medium energy proton-nucleus elastic scattering data [15] which are typically uncertain by about fm for isotopes in the Cu and Au mass range. The uncertainty in the neutron density rms radii relative to the proton density was therefore assumed to be fm and the corresponding uncertainty in the matter rms radii was fm, where are the number of neutrons and nucleons in the isotope. Theoretical contributions to the errors in and were conservatively estimated by requiring each to independently account for the (N/A)0.09 fm error. The latter theoretical errors were combined in quadrature with the corresponding errors for and from analysis of electron scattering data to obtain the final errors listed in Table 1.
2.2 N-N Inelastic Cross Section
The N-N total inelastic cross sections used here were based on total cross section measurements for p-p collisions (1 mb uncertainty) and elastic total cross sections for p-p and p- (0.5 mb error) [16]. Proton-neutron total cross section data are not available in the energy range studied here. The results for energies = 20, 62, 130 and 200 GeV are respectively 33, 35.3, 38.7 and 41.7 mb, each being uncertain by 1.1 mb.
It is possible that the effective interaction cross section between colliding nucleons inside a nucleus differs from that in free space (density dependence) or that the strength and range of the effective N-N interaction changes with each successive collision as in the “used” nucleon scenario [17] or the “strict” participant scaling model [6] (limiting case of the used-nucleon model in which nucleons interact only once). The study of density dependent effects is well beyond the scope of the present analysis.
2.3 Two-Component Multiplicity Production Model
Parameters at = 62, 130 and 200 GeV are 2.01, 2.25 and 2.43 ( error for each), respectively, using the energy dependent parametrization of the UA5 [18] and CDF data given in Ref. [19]. For the = 20 GeV data, which is outside the energy range parametrized in [19], the average of ISR [20] and FNAL [21] measurements summarized in Ref. [22] was assumed where .
Binary scattering parameter in Eq. (1) was estimated by fitting data from STAR [4, 23], PHENIX [24], and PHOBOS [25, 26] versus with Eq. (1) rewritten as,
| (5) |
assuming the above values for . The resulting values of are 0.07, 0.09, 0.09 and 0.13 (0.03 errors for each) for the 20, 62, 130 and 200 GeV data, respectively. Analysis of the 19.6 GeV Au-Au data by the PHOBOS experiment [25] assumed [20] and obtained , leading to claims in the literature that hard scattering contributions to multiplicity do not change with collision energies from 20 to 200 GeV [25, 26, 27, 28]. A more recent compilation [22] of measurements in this energy range indicates a larger value of . Fitting Eq. (5) to the combined PHENIX [24] and PHOBOS [25] 19.6 GeV data with resulted in a smaller . PHOBOS 62 GeV Au-Au data [26], when plotted versus , do not linearly extrapolate to in contrast to what is expected from Fig. 4 of Ref. [26] and Fig. 1 of Ref. [28] from the PHOBOS experiment. However, 62 GeV Au-Au results from the STAR experiment linearly extrapolate to at , resulting in the fitted value used here. parameters from the three RHIC experiments generally agree for the 130 and 200 GeV data; the PHOBOS values of [25] and 0.13 [25] at 130 and 200 GeV, respectively, were confirmed and used here. It is possible that parameter is affected by other processes in addition to hard and semi-hard partonic scattering in the initial collision stage where the latter mechanisms would be expected to follow a dependence.
The variance of the multiplicity distribution in Eq. (2) is given by where values of parameter or represent multiplicity fluctuation suppression or excess, respectively, relative to pure statistical fluctuations (). In general a non-vanishing integral [29, 30, 31] of two-particle correlations [32] over the acceptance requires . In principle, correlation measures of the type reported in Ref. [32] could be used to determine parameter using the relationship between fluctuations and correlations developed in Refs. [29, 31] and discussed in Appendix A. On the other hand, the Kharzeev and Nardi two-component multiplicity model with distribution constitutes a phenomenology for describing event-wise multiplicity frequency distribution data. The phenomenological approach based on fits to multiplicity distribution data, shown in the next section, was used to estimate parameter in the present analysis. The uncertainty in the width of was estimated by fitting the data. The uncertainty in the analytic form of the multiplicity fluctuation distribution was accounted for by comparing Monte Carlo Glauber results assuming the Gaussian in Eq. (2) (with ) with results assuming a negative binomial distribution (NBD) [10] in place of Eq. (2) as explained in Appendix A.
3 Fits to 130 GeV Au-Au Data
The 130 GeV Au-Au minimum-bias negatively charged hadron multiplicity frequency distribution data from STAR [4] for 60K events were fit by adjusting parameters (for negative hadrons) and where was fixed to 0.09 as discussed above. The acceptance was defined by transverse momentum GeV/, , and . The fit (solid histogram) is shown in the left panel of Fig. 1 in comparison with data (solid dots), where the optimum values of and are (consistent with for charged particle yields) and , respectively. Similar fits (not shown) to the charged particle minimum-bias multiplicity distribution from the same data set resulted in . Parameter was therefore set to for all four energies.
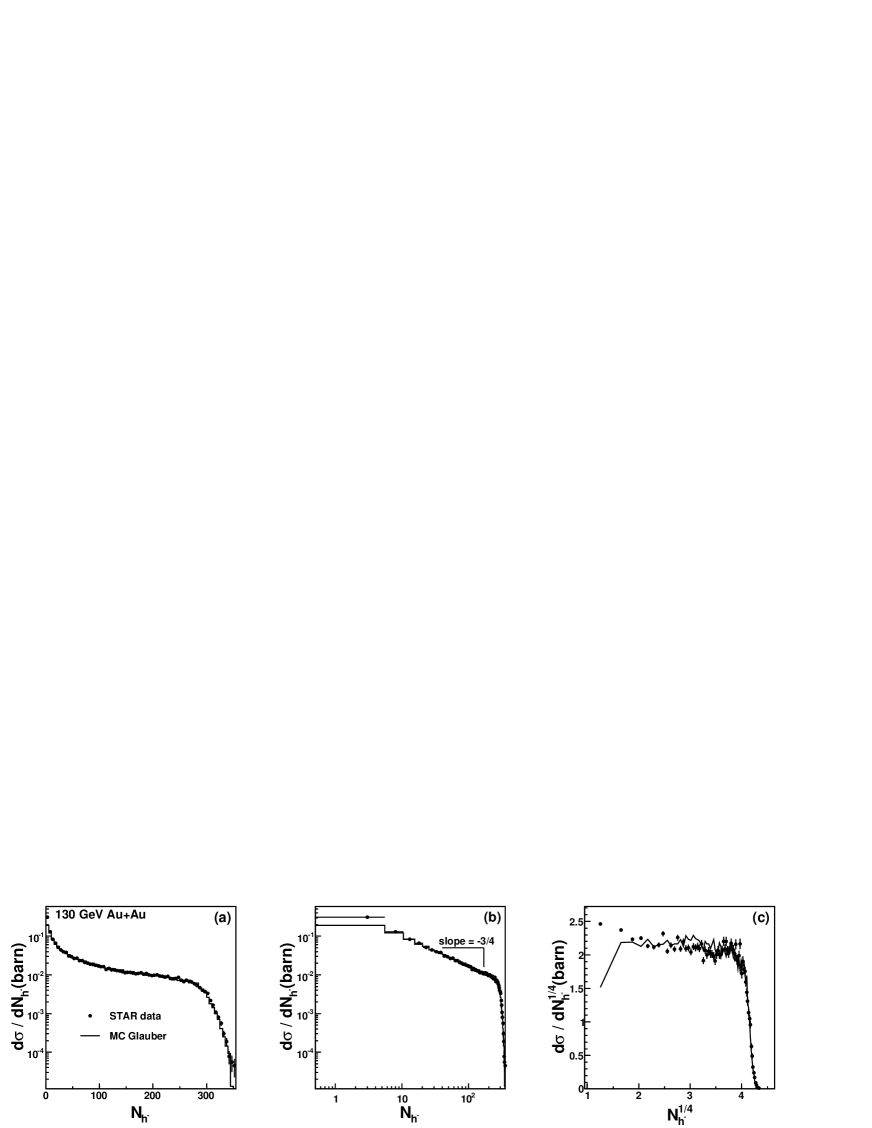
In the TP analysis [6] it was shown that minimum-bias multiplicity frequency distributions for relativistic heavy ion collision experiments and Monte Carlo Glauber models approximately follow a power-law distribution. This is illustrated by plotting the data and MCG fit from the left panel of Fig. 1 on log-log axes in the middle panel. Except near the end-points the data can be described to within 10% with a slope (exponent) of approximately . The collision event yield is approximately proportional to . Therefore distribution versus is approximately constant, where
| (6) |
as shown in the right-hand panel of Fig. 1 for data (solid dots) and MCG fit (solid line). The power-law plotting format in the right-hand panel enables a more sensitive comparison between the model fit and data than in the usual semi-log format (left panel). The MCG model fit is consistent with the data except for the first two data points at low . Except near the end-points the data are constant on to within an overall variation of 20% in comparison to the data which span nearly two orders of magnitude within the same multiplicity range.
The results in Fig. 1 demonstrate the efficacy of the Monte Carlo Glauber model with two-component multiplicity production for accurately describing the measured multiplicity frequency distributions at RHIC. Based on this outcome we conclude that the present model is reasonable to use in estimating centrality bin average quantities and their systematic errors for RHIC data.
4 Results and Error Analysis
Ensembles of one-million, minimum-bias (i.e. random impact parameter) Monte Carlo collisions were generated for each of the six systems studied here. Centrality bin averaged quantities , , , and are listed in Tables 2-7 using the nominal parameter values discussed above. Statistical errors are typically 0.1-0.2% and always % of the nominal bin averages and in all instances are much less than the systematic errors discussed below. Results in Table 2 for for Au-Au collisions at 200 GeV are systematically larger than published Monte Carlo Glauber predictions in Ref. [1] by approximately 5% for peripheral centrality bins. This systematic increase is primarily caused by multiplicity fluctuations in the present model and basing centrality on here rather than on as was done in Ref. [1].
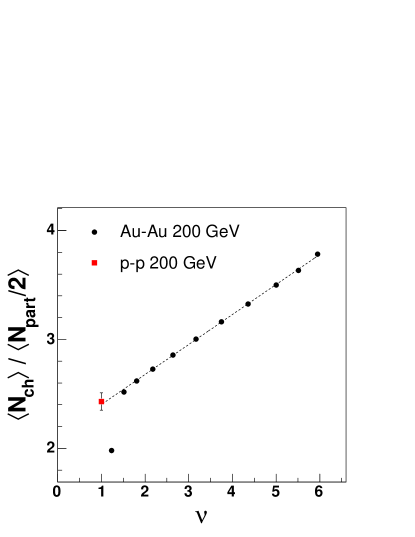
Average charged particle multiplicity per participant pair for at mid-pseudorapidity as a function of centrality () is shown in Fig. 2 for Monte Carlo simulated Au-Au collisions at = 200 GeV (solid dots). The p-p limit, , is indicated by the solid square symbol. The data display a linear dependence on as expected from Eq. (5) except for the most-peripheral 90-100% centrality bin where multiplicity fluctuations significantly reduce the average . The slope agrees with ; the linear extrapolation to the p-p limit is evident.
4.1 Error Estimation Method
The sources of uncertainty which cause systematic error in the collision geometry quantities can be organized into three categories. The first includes fitting uncertainties that occur when the corrected, multiplicity frequency distribution data are described by adjusting the parameters of the multiplicity production model in Eqs. (1-2). The second includes the uncertainties in the matter density, nucleon-nucleon total inelastic cross section, and functional representation of the multiplicity fluctuation distribution . The third includes the uncertainty in the corrected multiplicity frequency distribution data . The latter arise from trigger inefficiency, collision vertex finding inefficiency, background contamination, and particle tajectory finding inefficiency.
Systematic errors in centrality bin average quantities due to fitting uncertainty were estimated by comparing the nominal results to that obtained with parameters and in Eqs. (1-2) individually varied within their respective fitting errors (Secs. 2.3 and 3). Uncertainty in parameter directly affects but does not affect , , or .
Error estimates due to uncertainties in the matter density radius and diffuseness parameters and the N-N inelastic cross section require a refitting of the distribution. This was accomplished via a phenomenological adjustment of the multiplicity production model described in Appendix B. Fit recovery via minimization for MCG simulations with ample statistics (of order collisions) is computationally intensive. The method in Appendix B is fast and accurate. Errors due to the uncertainty in the mathematical representation of were estimated by comparing the nominal MCG results using the Gaussian distribution in Eq. (2) with results assuming a negative binomial distribution [18, 10] as explained in Appendix A.
Uncertainties in the data arising from trigger inefficiency, collision vertex finding inefficiency, and background contamination mainly affect the low multiplicity region. Minimum-bias trigger efficiencies at RHIC are % [24, 33], % [4], 96% [34] and % [25, 35, 36]. Trigger inefficiency causes the lower half-max point of the distribution to shift to larger . The position of this point for the distribution when corrected for trigger inefficiency (assuming the power-law behavior) has a relative uncertainty of about 10%. 222Trigger efficiencies are uncertain by about 2 to 3%. The fractional uncertainty in the lower half-max position is (0.02 to 0.03)% where and are the lower and upper half-max points of the distribution. However, knowledge that the lower half-max point is constrained by p-p scattering allows the relative uncertainties of the lower half-max point on to be reduced to 1/4 of the uncertainties in , or to 0.8%, 0.9%, 1%, and 2% for the 200, 130, 62 and 20 GeV data, respectively.
Primary collision vertex reconstruction efficiency is approximately 100% for events with of order a few tens and greater but falls precipitously for [37]. PHOBOS [25, 36] and STAR [4, 37] both report uncertainties in their overall vertex finding efficiencies of about % for minimum-bias collisions. Vertex finding inefficiency increases the slope and half-max position of the low multiplicity edge of the distribution. An uncertainty of % in the overall efficiency results in about 10% uncertainty in the low half-max position. However, the p-p data constrain this uncertainty. In this analysis we assumed 100% vertex finding efficiency for collisions producing [37], or , and allowed the slope of the lower edge of the distribution to vary such that the half-max position varied by 0.8%, 0.9%, 1%, and 2% for the 200, 130, 62 and 20 GeV data, respectively, as in the preceding paragraph.
The principle sources of background contamination are from ultra-peripheral two-photon interactions [38] and beam-gas collisions. The former process corresponds to coherent photon-photon interactions which excite both nuclei, followed by neutron decay (which activates the minimum-bias trigger detectors) and accompanied by resonance(s) production which decays into charged particles transverse to the beam direction. Transverse particle multiplicities from UPC events are typically (e.g. -meson decay) and generally [38] for at midrapidity. UPC backgrounds are therefore restricted to the most-peripheral (90-100%) centrality bin. UPC yields should be approximately proportional to [38] (charge numbers for colliding ions 1 and 2) whereas beam-gas contamination should scale with beam current. Other background events, e.g. mutual Coulomb dissociation processes such as + A B + n for both nuclei, can be eliminated by requiring minimum transverse particle production. Remaining background events will appear near the lower edge of the distribution.
Estimates of background contamination in minimum-bias trigger data at RHIC range from % [33] to 6% [1, 4] overall for Au-Au at =130 GeV corresponding to 0-20% and 60%, respectively, of the hadronic collision event yield in the 90-100% centrality bin. Most of the UPC events occur at and can be eliminated by cuts on the number of transverse charged particles. The remaining background contributions for are less than the amounts listed above. For the present analysis background contamination was assumed to be dominated by UPC events and to diminish in magnitude with collision energy and . In the present analysis background contamination was applied to the nominal 90-100% centrality bin assuming 3%, 2% and 1% overall contamination levels in the Au-Au data at = 200, 130 and 62 GeV, respectively. UPC contamination for Au-Au collisions at 20 GeV and for Cu-Cu at 200 and 62 GeV was estimated to be negligible. However, calculations were done for the latter three systems assuming a 1% overall background contamination (10% contamination within the nominal 90-100% centrality bin) in order to provide a reference for further systematic error estimation.
The above sources of systematic uncertainty primarily affect the position, slope and shape of the distribution at the lower end-point. These changes impact the MCG model which must describe those data and, in turn, the collision geometry quantities like . The phenomenological method in Appendix B was used to estimate the changes in the collision geometry quantities relative to the nominal values. The latter differences were taken as the estimated errors.
Background levels in collider experiments vary significantly depending on beam quality, beam current and interaction rate. Excessive trigger backgrounds beyond that considered here may result from beam-gas interactions during periods of high integrated beam currents. Collision event pile-up in the particle tracking detectors during periods of high luminosity adversely affect collision vertex finding. Either condition may be so severe as to preclude access to the low multiplicity range of the minimum-bias distribution. Even so, the power-law dependence and p-p end-point constraints enable accurate centrality estimates and collision geometry assignments to be made for the remaining minimum-bias data.
Charged particle trajectory reconstruction efficiencies in the large acceptance tracking detectors at RHIC are typically 70 - 95% [4, 24, 25] and decrease approximately linearly with particle density in the detectors by about 20% from most-peripheral to most-central collisions [37]. Uncertainties in the assumed track reconstruction efficiencies were estimated by comparing corrected data for versus between the RHIC experiments for Au-Au collisions at 20 GeV [24, 25] 130 GeV [4, 24, 25] and 200 GeV [24, 25]. The comparisons indicate uncertainties in both the overall tracking efficiencies and in the dependence on particle density in the tracking detectors. The latter variation in efficiency from peripheral to central collisions is about %.
Overall changes in tracking efficiency are compensated in the MCG model by multiplicative adjustments to parameter and therefore have no effect on the centrality measures reported here. Changes in the assumed tracking efficiency dependence on affect the lower and upper end-point positions of the distribution and distort its shape. The distortions must be accounted for by the MCG model in order to determine the net effect on the collision geometry measures. The effects of the 8% uncertainty in the multiplicity dependence of the trajectory reconstruction efficiency were estimated by generalizing parameter in Eq. (1) to where and for most-central Au-Au collisions. The same value for was assumed for Cu-Cu. Systematic errors were estimated as the differences between the nominal centrality bin averages and those obtained assuming . The choice to maximize multiplicity variation for most-central collisions is arbitrary. As a result systematic errors in centrality bin average multiplicities were not included in Tables 2-7. However, this ambiguity does not affect the resulting systematic errors in the other centrality measures reported here.
4.2 Error Results
The combined systematic errors (all components added in quadrature) in both magnitude and relative percent (given in parentheses) are listed in Tables 2 - 7 for the six collision systems studied here. Impact parameter uncertainty is about % for Au-Au and % for Cu-Cu. Uncertainty in is about % for Au-Au and % for Cu-Cu for peripheral centralities, reducing to about % or less for central collisions where full geometrical overlap of the two nuclei suppresses the dependence of on variations in the nuclear surface geometry. Systematic errors in vary from about % for Au-Au collisions and % for Cu-Cu for central to peripheral collisions. Errors in (% or less) are suppressed due to covariation of and .
Individual contributions to the systematic errors in collision geometry bin averages , , and for Au-Au and Cu-Cu collisions at = 200 GeV are summarized in Tables 8 and 9, respectively. Similar results were obtained for the other four collision systems. Errors are given in percent where the absolute values of positive and negative errors were averaged together. The three numbers listed for each instance correspond to the average errors within the 60-100%, 20-60% and 0-20% centrality bins, respectively. The dominant errors are due to uncertainties in the matter density and the N-N total inelastic cross section. Errors due to uncertainties in the analytic form of the phenomenological multiplicity fluctuation model are only significant for peripheral collisions. Errors due to uncertainties in the multiplicity dependent particle track reconstruction efficiency and in the trigger and vertex reconstruction inefficiencies are negligible when constrained by p-p data as shown previously by Trainor and Prindle [6].
Percent uncertainties due to possible background contamination are listed for all six collision systems in Table 10. The largest errors occur in the most-peripheral centrality bin as expected. The absolute magnitudes of the errors decline rapidly with increasing centrality and are negligible for the centrality bins not listed in the table. Reference errors for Au-Au at 20 GeV and Cu-Cu at = 200 and 62 GeV were based on an assumed 10% background contamination in the 90-100% centrality bin.
Estimates of total systematic error when background contamination differs from that assumed here can be obtained by removing the error contributions in Table 10 from the total errors in Tables 2 - 4 for Au-Au collisions at 200, 130 and 62 GeV, respectively, and then adding (in quadrature) the appropriately scaled background errors from Table 10. For Au-Au collisions at 20 GeV and Cu-Cu collisions at 200 and 62 GeV the scaled errors from Table 10 should be combined in quadrature with the total systematic errors in Tables 5 - 7. If much larger backgrounds than those assumed here are encountered, then the present Monte Carlo results should not be scaled; rather the errors should be recalculated.
Overall, the systematic errors in collision geometry bin averages for non-peripheral centralities are dominated by uncertainties in the nuclear geometry and . Errors in the more peripheral bins are dominated by background contamination and ambiguities in the analytic form of the multiplicity fluctuation model.
5 Analytic Parametrizations
The power-law description of heavy-ion collision centrality developed by Trainor and Prindle [6] prescribes simple, analytic parametrizations of the , , and dependences on total inelastic cross section fraction . For the running integral relation on is accurately given by [6]
| (7) |
where
| (8) |
Similarly
| (9) |
where subscripts and refer respectively to the lower and upper half-max end-point positions of the and distributions.
The above parametrizations are shown as the solid lines in the two upper panels of Fig. 3 in comparison with the present MCG model results (solid dots) from Table 2 for Au-Au collisions at = 200 GeV. The end-point parameters for the power-law parametrizations were , , and . The parametrization for is compared with the MCG result in the lower-left panel. The average multiplicities using Eq. (5), the values for and from Sec. 2.3, and the above parametrizations for and (solid curve) is compared with the MCG result in the lower-right panel. The simple power-law parametrizations introduced in Ref. [6] quantitatively describe the MCG results, thus confirming their utility and precision.


Calculation of the analytic power-law parametrizations require the upper half-max end-point values for and from the MCG model. These quantities are listed in Table 11 for the six collision systems studied here.
6 Discussion
Very peripheral collision data from the four RHIC experiments have generally remained unpublished due to concerns with possibly large, and not well understood background contamination, trigger inefficiencies, and primary collision vertex finding inefficiencies. Trainor and Prindle [6] originally showed, and the present analysis confirms, that the power-law dependence of the multiplicity frequency distribution data together with knowledge of the proton-proton multiplicity enables accurate centrality information to be obtained in spite of these uncertainties. Nevertheless, UPC events in principle cause the lower end-point portion of the multiplicity frequency distribution for minimum-bias A-A collisions to differ from the p-p limit and these backgrounds will contaminate the A-A data in the most-peripheral centrality bins. In this section we discuss additional analysis methods using data available to the RHIC experiments to minimize backgrounds and to provide contamination level estimates for the accepted centrality bins.
Transverse particle production information via scintillators, silicon detectors, and/or calorimetry are available in the RHIC experiments at the trigger level [39, 40, 41, 42]. These data record total energy deposition in the sensitive detector material for each (minimum bias) triggered collision event including contributions from A-A hadronic collisions, ultra-peripheral collisions, beam-gas and other backgrounds, etc. but do not include particle track finding and primary collision vertex finding inefficiencies. If the integrated yields from these detectors, denoted as , is approximately proportional to , then the frequency distribution will follow an approximate power-law such that the data can be usefully represented by versus , where is the number of triggers.
MCG simulations for the integrated yields from the STAR central trigger barrel (CTB) [39] plastic scintillator detector (, azimuth coverage) were done for p-p and Au-Au minimum-bias collisions at = 200 GeV. Details of this simulation are discussed in Appendix C. The results for versus are shown in Fig. 4. Both the p-p and Au-Au simulations reproduce the general shapes of measured STAR CTB minimum-bias trigger yields [8]. The simulated Au-Au CTB yields follow the power-law distribution very well where the lower half-max point coincides with the mode of the p-p distribution. Trigger inefficiency in Au-Au causes a depletion at low multiplicity as indicated by the green, dashed curve. Over- or under-corrected yields result in the blue dotted curves. From Fig. 4 it is clear how the p-p trigger yield can be used to constrain corrections for trigger inefficiency in A-A.
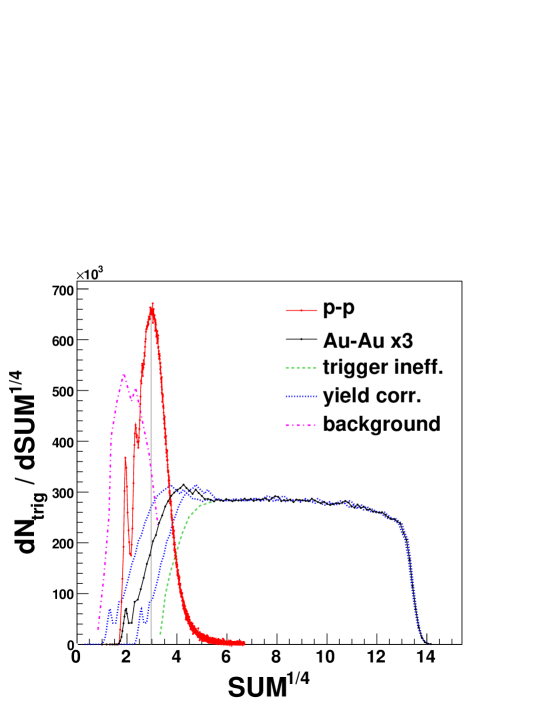
Background triggers appear at lower values of where UPC events typically produce of order two charged particles at mid-rapidity compared with the average from p-p collisions of about in and therefore appear as a peak or enhancement (dashed-dotted curve in Fig. 4) below the mode of the p-p distribution. Comparisons between the measured p-p and Au-Au distributions and the power-law simulations for Au-Au provide a reasonable means for defining additional event cuts to reduce background contamination. This information can also be used to estimate the contamination level for accepted events. Measurements of the dependence of the lower end-point region of the distribution on integrated beam current, luminosity, and ion species would help disentangle background contributions from beam-gas collisions, event pile-up, and UPC events. A similar power-law analysis using reconstructed particle tracks, but without a primary collision vertex requirement, would permit the vertex finding inefficiencies to be estimated and corrected.
7 Summary and Conclusions
A Monte Carlo Glauber and two-component multiplicity production model with fluctuations for high energy heavy ion collisions was used to describe minimum-bias multiplicity frequency distribution data from RHIC. Updated Woods-Saxon radii and diffusivities for the point matter densities of 197Au and 63Cu were determined using a combination of charge density measurements from electron scattering and theoretical Hartree-Fock predictions. The binary scattering parameter was estimated using a compilation of available RHIC data from 20 to 200 GeV. The values for obtained here display some energy dependence, although with large uncertainty. The model was fitted to the 130 GeV Au-Au minimum-bias data [4] in both the conventional semi-log format and in the more sensitive power-law inspired format introduced in Ref. [6]. Quantitative agreement between the present model and data was obtained.
Systematic errors in centrality bin averages for the geometrical quantities , , and were estimated based on charged particle multiplicity for and full azimuth acceptance. The sources of systematic error considered here included uncertainties associated with the model (nuclear density, nucleon-nucleon inelastic total cross section, multiplicity production model analytic form and parameters) and with the corrected minimum-bias multiplicity frequency distribution data (background contamination, trigger and collision vertex finding inefficiencies, and particle trajectory reconstruction inefficiencies). The TP centrality analysis method was applied to the MCG predictions and error analysis for six collision systems relevant to the RHIC heavy ion program.
The analysis showed that significantly reduced errors in the collision geometry quantities result when the uncertainties in the minimum-bias multiplicity frequency distribution data are constrained by the empirical power-law behavior and the minimum-bias p-p collision data. The reduction in errors is in agreement with the original TP power-law analysis; the resulting errors are in general smaller than previous estimates [1, 2, 4] which did not utilize the power-law and p-p constraints. The accuracy of simple parametrizations of centrality dependent quantities developed by Trainor and Prindle [6] was confirmed. We also discussed how particle production data at the trigger level (e.g. scintillator hits and calorimeter energy depositions) can be used within the power-law and p-p constraint methodology [6] to define additional event cuts which minimize background contamination and which enable the detrimental effects of trigger inefficiencies to be reduced.
The systematic errors presented in this paper demonstrate the accuracy of collision geometry quantities which can be achieved with RHIC data by exploiting the power-law behavior of the A-A data and using constraints from minimum-bias p-p collision data. The results presented here assume that backgrounds from UPC events, pileup, beam-gas collisions, etc. are not too large and that the minimum-bias trigger and collision vertex reconstruction efficiencies are not too small for peripheral collisions. It is intended that the MCG results presented here will serve as a useful resource for the RHIC community and that the analysis method developed by Trainor and Prindle [6] and applied in this paper, together with the trigger data analysis method discussed here, will enable accurate description of, and better access to the heavy ion peripheral collision data from RHIC.
| Au-Au 200 GeV | |||||
|---|---|---|---|---|---|
| Centrality (%) | |||||
| 90-100 | 2.9 | ||||
| 80-90 | 8.2 | ||||
| 70-80 | 18.7 | ||||
| 60-70 | 37.8 | ||||
| 50-60 | 69.7 | ||||
| 40-50 | 118.5 | ||||
| 30-40 | 190.2 | ||||
| 20-30 | 291.5 | ||||
| 10-20 | 433.5 | ||||
| 5-10 | 577.6 | ||||
| 0-5 | 705.6 | ||||
| Au-Au 130 GeV | |||||
|---|---|---|---|---|---|
| Centrality (%) | |||||
| 90-100 | 2.7 | ||||
| 80-90 | 7.4 | ||||
| 70-80 | 16.6 | ||||
| 60-70 | 33.2 | ||||
| 50-60 | 60.1 | ||||
| 40-50 | 100.4 | ||||
| 30-40 | 157.8 | ||||
| 20-30 | 237.7 | ||||
| 10-20 | 348.7 | ||||
| 5-10 | 459.5 | ||||
| 0-5 | 557.6 | ||||
| Au-Au 62 GeV | |||||
|---|---|---|---|---|---|
| Centrality (%) | |||||
| 90-100 | 2.4 | ||||
| 80-90 | 6.6 | ||||
| 70-80 | 14.6 | ||||
| 60-70 | 29.0 | ||||
| 50-60 | 52.3 | ||||
| 40-50 | 87.1 | ||||
| 30-40 | 136.9 | ||||
| 20-30 | 205.5 | ||||
| 10-20 | 300.7 | ||||
| 5-10 | 395.5 | ||||
| 0-5 | 480.8 | ||||
| Au-Au 20 GeV | |||||
|---|---|---|---|---|---|
| Centrality (%) | |||||
| 90-100 | 1.9 | ||||
| 80-90 | 4.8 | ||||
| 70-80 | 10.5 | ||||
| 60-70 | 20.5 | ||||
| 50-60 | 36.2 | ||||
| 40-50 | 59.2 | ||||
| 30-40 | 91.6 | ||||
| 20-30 | 135.9 | ||||
| 10-20 | 196.1 | ||||
| 5-10 | 255.4 | ||||
| 0-5 | 309.2 | ||||
| Cu-Cu 200 GeV | |||||
|---|---|---|---|---|---|
| Centrality (%) | |||||
| 90-100 | 2.2 | ||||
| 80-90 | 4.7 | ||||
| 70-80 | 8.4 | ||||
| 60-70 | 14.3 | ||||
| 50-60 | 23.3 | ||||
| 40-50 | 36.6 | ||||
| 30-40 | 55.4 | ||||
| 20-30 | 81.5 | ||||
| 10-20 | 117.4 | ||||
| 5-10 | 152.2 | ||||
| 0-5 | 184.8 | ||||
| Cu-Cu 62 GeV | |||||
|---|---|---|---|---|---|
| Centrality (%) | |||||
| 90-100 | 1.8 | ||||
| 80-90 | 3.8 | ||||
| 70-80 | 6.7 | ||||
| 60-70 | 11.2 | ||||
| 50-60 | 17.9 | ||||
| 40-50 | 27.7 | ||||
| 30-40 | 41.3 | ||||
| 20-30 | 60.0 | ||||
| 10-20 | 84.9 | ||||
| 5-10 | 108.9 | ||||
| 0-5 | 132.2 | ||||
-
Error Au-Au 200 GeV Errors Source (%) (%) (%) (%) 0.9, 1.0, 0.8 0.1, 0.1, 0.2 0.1, 0.9, 2.2 0.0, 0.9, 2.0 1.7, 1.6, 1.5 3.2, 1.6, 0.3 5.2, 5.1, 2.6 2.1, 3.5, 2.3 0.1, 0.1, 0.0 0.4, 0.5, 0.3 1.0, 2.0, 2.5 0.6, 1.5, 2.2 0.0, 0.0, 0.1 0.2, 0.0, 0.0 0.3, 0.0, 0.0 0.2, 0.1, 0.0 0.0, 0.0, 0.2 0.3, 0.1, 0.0 0.4, 0.2, 0.1 0.1, 0.1, 0.0 -form 0.1, 0.0, 0.7 2.2, 0.1, 0.2 3.5, 0.3, 0.3 1.2, 0.2, 0.1 trigger 0.0, 0.0, 0.0 0.1, 0.0, 0.0 0.1, 0.0, 0.0 0.0, 0.0, 0.0 vertex 0.0, 0.0, 0.1 0.1, 0.0, 0.0 0.1, 0.0, 0.0 0.0, 0.0, 0.0 tracking 0.0, 0.0, 0.1 0.0, 0.0, 0.0 0.0, 0.0, 0.0 0.0, 0.0, 0.0
-
Error Cu-Cu 200 GeV Errors Source (%) (%) (%) (%) 1.0, 1.0, 1.0 0.2, 0.4, 0.5 0.2, 1.1, 2.6 0.2, 0.8, 2.0 1.9, 1.8, 1.7 2.1, 1.8, 0.8 3.2, 4.3, 3.2 1.2, 2.5, 2.3 0.2, 0.2, 0.2 0.2, 0.4, 0.4 0.5, 1.5, 2.2 0.3, 1.1, 1.8 0.0, 0.0, 0.0 0.0, 0.0, 0.0 0.2, 0.0, 0.1 0.2, 0.1, 0.1 0.1, 0.1, 0.3 0.8, 0.2, 0.1 1.2, 0.4, 0.2 0.4, 0.2, 0.1 -form 0.3, 0.1, 1.9 2.8, 0.1, 0.5 4.7, 0.5, 0.6 1.5, 0.5, 0.3 trigger 0.0, 0.0, 0.1 0.2, 0.1, 0.0 0.2, 0.1, 0.0 0.1, 0.0, 0.0 vertex 0.0, 0.0, 0.0 0.0, 0.0, 0.0 0.2, 0.0, 0.0 0.0, 0.0, 0.0 tracking 0.0, 0.0, 0.0 0.0, 0.0, 0.0 0.0, 0.0, 0.0 0.0, 0.0, 0.0
-
Background Contamination Errors System Centrality (percent) (%) (%) (%) (%) Au-Au 200 GeV 90-100 -0.3 5.6 7.9 1.8 23% contamination 80-90 0.2 -1.6 -1.7 -0.1 in 88-100% bin Au-Au 130 GeV 90-100 -0.3 4.8 6.7 1.6 22% contamination 80-90 0.2 -1.5 -1.5 0.0 in 91-100% bin Au-Au 62 GeV 90-100 -0.1 1.3 1.6 0.3 18% contamination 10-50a -0.1 0.2 0.4 0.1 in 96-100% bin Au-Au 20 GeVb 90-100 -0.1 2.7 3.5 0.8 80-90 0.0 0.0 0.1 0.0 40-70a -0.1 0.5 0.7 0.2 Cu-Cu 200 GeVb 90-100 -0.2 1.7 2.3 0.8 Cu-Cu 62 GeVb 90-100 -0.1 1.5 2.0 0.6 -
a Average percent changes within the combined centrality bin.
-
b Reference uncertainties assuming 10% background contamination in the number of collisions in the nominal 90-100% centrality bin, equivalent to 1% overall background.
-
System Au-Au 200 GeV 379.3 1166 Au-Au 130 GeV 377.5 1082 Au-Au 62 GeV 374.9 988 Au-Au 20 GeV 373.4 926 Cu-Cu 200 GeV 115.8 230 Cu-Cu 62 GeV 112.7 196
Appendix A
Multiplicity frequency distributions for high energy minimum-bias proton-proton collisions are well described by a negative binomial distribution (NBD) [10, 18] given by
| (12) |
In Eq. (12) and are random and mean multiplicities, the variance is , the variance excess relative to Poisson statistics is , and the multiplicity fluctuation variance excess per final-state particle is . The latter expression serves as an operational definition of parameter . For p-p collisions both and increase approximately linearly with ln() [18] as expected from pQCD cross sections for parton scattering.
Multiplicity fluctuation variance excess per final-state particle within a given acceptance is equal to the integral of two-particle correlations on relative momentum coordinates within the same acceptance [29, 30, 31]. For Au-Au collisions at 130 GeV [32] and at 62 and 200 GeV [43] the integral of charged particle correlations for and azimuth acceptance is dominated by a two-dimensional (2D) correlation peak at small relative opening angles. The magnitude of this correlation integral increases roughly with . Multiplicity fluctuation variance excess per final-state particle was therefore approximated by
| (13) |
where quantity is the variance excess for p-p collisions, is the average number of binary collisions per incident participant nucleon for the most-central (0-5%) A-A data, and is taken to be the ratio of the 2D correlation peak amplitude for most-central A-A collisions to that for p-p collisions.
Values of for p-p collisions were obtained from UA5 [10, 18] using either measured values of or the UA5 energy dependent fit function for . for is given by the values of assumed in this analysis. Simulations demonstrated that the values of obtained by UA5 with very large acceptance remained approximately constant at the smaller acceptance assumed in this analysis. Values of quantities were 0.09, 0.24, 0.40 and 0.51 for = 20, 62, 130 and 200 GeV, respectively. for Au-Au collisions at 20, 62, 130 and 200 GeV were estimated to be 4.8, 5.0, 5.4 and 5.5, respectively, from analysis of correlation data at 130 GeV [32] assuming ln scaling. The remaining values for Cu-Cu at 62 and 200 GeV were respectively 3.4 and 3.7 assuming scaling. Finally, for each simulated collision with event-wise and from Eq. (1) NBD distribution Eq. (12) was sampled to obtain the event-wise multiplicity.
Appendix B
Fit recovery of the nominal distribution following shifts in the nuclear density parameters and was achieved by constructing a perturbative correction, , which was added to the right-hand side of Eq. (1). Parameter shifts affect the collision distributions on and and in turn the and distributions. The fit recovery term is defined such that the nominal distribution is maintained when the frequency distribution on changes. Running integrals of the distributions and produce a one-to-one correspondence between and as a function of the number of summed events. Using the power-law representation this running integral relation is given by,
| (14) |
which defines a locus of ordered pairs , which can be compactly expressed as a discrete function defined by
| (15) |
In Eqs. (14) and (15) subscripts and refer to the nominal (reference) distribution when and to the shifted distribution when . Lower limit for the reference distribution. In order to recover the nominal distribution the correction term must be computed by the following difference,
| (16) |
Throughout this fit recovery procedure the parameters of in Eq. (2) remained fixed.
Numerically stable results with one-million minimum-bias simulated collisions required coarse binning of the Monte Carlo distributions and prior to evaluation of Eqs. (14) - (16). When parameters and were shifted excellent fit recovery was achieved with centrality bins corresponding to 0-5%, 5-10%, 10-40%, 40-70% and 70-100% total cross section fractions. When diffusivity parameter was shifted the optimum binning was 0-5%, 5-10%, 10-20%, 20-40%, 40-60%, 60-80% and 80-100%. The power-law representation in Eq. (14) exploits the approximately uniform statistics throughout the domain of the integrands, making numerical stability of the results less problematic.
Variations in the density parameters and produced typical changes in as a function of centrality of order several percent, up to 5%. Fit recovery in terms of was typically within a few tenths of a percent and always less than about 1% where the magnitude of relative to was less than about 1%, 4% and 1.5% for changes in , and , respectively, for all six collision systems.
A similar method was used to account for shifts in representing the systematic uncertainties in trigger inefficiency, background contamination, and collision vertex reconstruction inefficiency. For these simulations remained fixed while varied. The required correction is given by,
| (17) |
Appendix C
The Monte Carlo simulation model discussed in Sec. 6 for transverse particle production and energy deposition in the STAR CTB for p-p and Au-Au minimum bias collisions is described here. For p-p collisions the interaction point along the beam-line was randomly selected within 25 cm of the geometrical center of the STAR detector [44]. The minimum-bias charged particle multiplicity was obtained by sampling the negative binomial distribution (NBD) fitted to the UA5 = 200 GeV p-p data [10, 18] with parameters and . The , and particle species (, K±, proton or antiproton) for each charged particle produced in the collision was sampled from the measured , , and particle species distributions, respectively. Distribution was assumed to be proportional to , where , is the particle rest mass, and inverse effective temperature = 5.7, 5.2 and 4.8 GeV-1, for pions, kaons and protons, respectively. The values were obtained by fitting data [45] within the approximate range GeV. was restricted to be less than 2 GeV/. Distribution was obtained from the UA5 [18] measurements for = 200 GeV non-singly diffractive p-p collisions for . The particle species probabilities for pions, kaons and protons at low momentum were assumed to be 0.85, 0.085 and 0.065, respectively [23, 46].
Particle trajectories were extended outward from the collision point and approximately transverse to the beam direction toward the STAR Central Trigger Barrel (CTB) detector [39, 44] which was approximated by a uniform cylinder 220 cm in radius, coaxial with the beam line, and having full azimuthal coverage and total longitudinal length of 484 cm located symmetrically about the geometrical center of the STAR Time Projection Chamber [44]. Charged particles were propagated in a 0.5 T solenoidal magnetic field as helices until they either intersected or missed the CTB. The simulated mean number of charged particles per unit pseudorapidity at intersecting the CTB was consistent with the measured from UA5 [18].
Energy deposition in the plastic scintillator material (CH) was estimated by sampling the Landau distribution [47] for the calculated most-probable energy loss [16] for 1 cm thick plastic taking into account the range of crossing angles between the helical trajectories and the cylindrical detector. The areal density (effective thickness) along the path through the material was estimated to be (1.032 gm/cm [16] where is the angle of incidence between the particle trajectory helix and a normal to the detector cylinder at the intersection point. The mean electron excitation (ionization) energies for carbon and hydrogen were assumed to be 80 eV and 20 eV, respectively [16]. Energy depositions in the carbon and hydrogen components of the detector material were added together. Light attentuation in the plastic scintillator (380 cm attenuation length [39]) was included in the simulated CTB output signal. For each p-p collision the total output from each produced charged particle which deposited energy in the CTB scintillators was summed, resulting in a simulated result for the quantity in Sec. 6. The p-p results in Fig. 4 correspond to one-million triggered events with non-zero CTB signal. The resulting trigger output frequency distribution, , served as input for the Au-Au trigger simulations described next.
For Au-Au collisions the Monte Carlo Glauber model presented here was used to generate an ensemble of = 200 GeV simulated minimum-bias collisions. For each Au-Au collision the distribution was sampled times corresponding to the average number of p-p collisions required to generate mean multiplicity . The sampled values of were added to obtain the total CTB trigger output for each simulated Au-Au collision. The results in Fig. 4 correspond to one-million Au-Au triggers with non-zero CTB output.
References
References
- [1] Adams J et al (STAR Collaboration) 2005 Phys. Rev. C 72 014904 Adams J et al (STAR Collaboration) nucl-ex/0311017 Miller M 2003 Ph. D. Thesis, Yale University
- [2] Miller M L, Reygers K, Sanders S J, and Steinberg P 2007 Annu. Rev. Nucl. Part. Sci. 57 205
- [3] Glauber R J 1959 Lectures in Theoretical Physics, edited by Brittin W E and Dunham L G (New York: Interscience) 315 Glauber R J 1967 High Energy Physics and Nuclear Structure, edited by Alexander G (Amsterdam: North-Holland) 311 Glauber R J 1970 High Energy Physics and Nuclear Structure, edited by Devons S (New York: Plenum) 207.
- [4] Adler C et al (STAR Collaboration) 2001 Phys. Rev. Lett. 87 112303 Adler C et al (STAR Collaboration) 2002 Phys. Rev. Lett. 89 202301 Adams J et al (STAR Collaboration) 2006 Phys. Rev. C 73 034906
- [5] d’Enterria D 2004 J. Phys. G: Nucl. Part. Phys. 30 S767
- [6] Trainor T A and Prindle D J hep-ph/0411217
- [7] Liu Q, Prindle D J, Trainor T A 2006 Phys. Lett. B 632 197
- [8] Dunlop J C 2007 private communication
- [9] Kharzeev D and Nardi M 2001 Phys. Lett. B 507 121
- [10] Alner G J et al (UA5 Collaboration) 1985 Phys. Lett. B 160 199 Alner G J et al (UA5 Collaboration) 1986 Phys. Lett. B 167 476
- [11] De Jager C W, De Vries H, and De Vries C 1974 Atomic Data and Nucl. Data Tables 14 479
- [12] Negele J W and Vautherin D 1972 Phys. Rev. C 5 1472 Negele J W 1977 private communication
- [13] Amado R D, Lenz F, McNeil J A, and Sparrow D A 1980 Phys. Rev. C 22 2094 Velicia F J F 1987 J. Phys. A: 20 2293
- [14] Chaumeaux A, Layly V, Schaeffer R 1978 Ann. Phys. (N. Y.) 116 247
- [15] Ray L, Coker W R, Hoffmann G W 1978 Phys. Rev. C 18 2641 Ray L 1979 Phys. Rev. C 19 1855 Ray L, Hoffmann G W, Barlett M, McGill J, Amann J, Adams G, Pauletta G, Gazzaly M, and Blanpied G S 1981 Phys. Rev. C 23 828 Pauletta G et al 1981 Phys. Lett. B 106 470 Hoffmann G W et al 1978 Phys. Lett. B 79 376 Hoffmann G W et al 1980 Phys. Rev. C 21 1488
- [16] Eidelman S et al (Particle Data Group) 2004 Phys. Lett. B 592 1
- [17] Glauber R J 2006 Nucl. Phys. A774 3
- [18] Alner G J et al (UA5 Collaboration) 1986 Z. Phys. C 33 1 Alner G J et al (UA5 Collaboration) 1987 Phys. Rep. 154 247
- [19] Abe F et al (CDF Collaboration) 1990 Phys. Rev. D 41 2330
- [20] Thomé W et al 1977 Nucl. Phys. B129 365
- [21] Ward C P et al 1979 Nucl. Phys. B153 299 Morse W M et al 1977 Phys. Rev. D 15 66 Whitmore J et al 1974 Phys. Rep. C 10 273
- [22] Albajar C et al (UA1 Collaboration) 1990 Nucl. Phys. B 335 261
- [23] Molnar L 2006 Ph. D. Thesis, Purdue University
- [24] Adler S S et al (PHENIX Collaboration) 2005 Phys. Rev. C 71 034908
- [25] Back B B et al (PHOBOS Collaboration) 2001 Phys. Rev. Lett. 87 102303 Back B B et al (PHOBOS Collaboration) 2002 Phys. Rev. C 65 061901(R) Back B B et al (PHOBOS Collaboration) 2004 Phys. Rev. C 70 021902(R)
- [26] Back B B et al (PHOBOS Collaboration) 2006 Phys. Rev. C 74 021901(R)
- [27] Loizides C et al (PHOBOS Collaboration) nucl-ex/0605012
- [28] Stephans G S F et al (PHOBOS Collaboration) 2007 arXiv:0705.3859v1 [nucl-ex]
- [29] Trainor T A hep-ph/0001148
- [30] Prindle D J and Trainor T A 2005 J. Phys: Conf. Ser. 27 118
- [31] Adams J et al (STAR Collaboration) 2006 J. Phys. G: Nucl. Part. Phys. 32 L37
- [32] Adams J et al (STAR Collaboration) 2006 Phys. Rev. C 73 064907
- [33] Adcox K et al (PHENIX Collaboration) 2001 Phys. Rev. Lett. 86 3500 Adler S S et al (PHENIX Collaboration) 2004 Phys. Rev. C 69 034909
- [34] Arsene I et al (BRAHMS Collaboration) 2005 Phys. Rev. C 72 014908
- [35] Back B B et al (PHOBOS Collaboration) 2000 Phys. Rev. Lett. 85 3100 Back B B et al (PHOBOS Collaboration) 2004 Phys. Lett. B 578 297
- [36] Back B B et al (PHOBOS Collaboration) 2002 Phys. Rev. C 65 031901(R)
- [37] Calderon M 2001 Ph. D. Thesis, Yale University
- [38] Baur G, Hencken K and Trautmann D 1998 J. Phys. G: Nucl. Part. Phys. 24 1657
- [39] Bieser F S et al 2003 Nucl. Instrum. Meth. A 499 766
- [40] Aphecetche L et al 2003 Nucl. Instrum. Meth. A 499 521 Allen M et al 2003 Nucl. Instrum. Meth. A 499 549
- [41] Back B B et al (PHOBOS Collaboration) 2003 Nucl. Instrum. Meth. A 499 603
- [42] Adamczyk M et al (BRAHMS Collaboration) 2003 Nucl. Instrum. Meth. A 499 437
- [43] Daugherity M (STAR Collaboration) 2008 Proceedings of the 20 th International Conf. on Ultrarelativistic Nucleus-Nucleus Collisions: Quark Matter 2008, Jaipur, India
- [44] Ackermann K H et al 2003 Nucl. Instrum. Meth. A 499 624
- [45] Adams J et al (STAR Collaboration) 2004 Phys. Rev. Lett. 92 112301
- [46] Adams J et al (STAR Collaboration) 2005 Phys. Lett. B 616 8 Adams J et al (STAR Collaboration) 2006 Phys. Lett. B 637 161 Adler S S et al (PHENIX Collaboration) 2006 Phys. Rev. C 74 024904
- [47] Kölbig K S and Schorr B 1984 Comp. Phys. Comm. 31 97