Event-by-event fluctuations of azimuthal particle anisotropy
in Au+Au collisions at = 200 GeV
Abstract
This paper presents the first measurement of event-by-event fluctuations of the elliptic flow parameter in Au+Au collisions at 200 GeV as a function of collision centrality. The relative non-statistical fluctuations of the parameter are found to be approximately 40%. The results, including contributions from event-by-event elliptic flow fluctuations and from azimuthal correlations that are unrelated to the reaction plane (non-flow correlations), establish an upper limit on the magnitude of underlying elliptic flow fluctuations. This limit is consistent with predictions based on spatial fluctuations of the participating nucleons in the initial nuclear overlap region. These results provide important constraints on models of the initial state and hydrodynamic evolution of relativistic heavy ion collisions.
PACS numbers: 25.75.-q
Results from the Relativistic Heavy Ion Collider (RHIC) at Brookhaven National Laboratory suggest that a dense state of matter is formed in ultrarelativistic nucleus-nucleus collisions WhitePaperBrahms ; WhitePaper ; WhitePaperStar ; WhitePaperPhenix . Studies of final state charged particle momentum distributions show that the produced matter undergoes a rapid collective expansion transverse to the direction of the colliding nuclei. In particular, for collisions at non-zero impact parameter, the expansion shows a significant anisotropy in the azimuthal angle, strongly correlated with the anisotropic shape of the initial nuclear overlap region. The dominant component of this anisotropic expansion is called “elliptic flow” and is commonly quantified by the second coefficient, , of a Fourier decomposition of the azimuthal distribution of observed particles relative to the event-plane angle Voloshin .
Elliptic flow has been studied extensively in Au+Au collisions at RHIC as a function of pseudorapidity, centrality, transverse momentum and center-of-mass energy PhobosFlowPRL1 ; PhobosFlowPRL2 ; PhobosFlowPRC ; WhitePaper ; WhitePaperStar ; WhitePaperPhenix . For Au+Au collisions at RHIC energies, the observed dependence of the elliptic flow signal on centrality and transverse momentum is found to be in good agreement with calculations in hydrodynamic models HydroRef1 ; PhobosFlowPRC . This is considered evidence for an early equilibration of the colliding system and a low viscosity of the matter produced in the early stage of the collision process Teaney2003 . In such calculations, for given conditions of the produced matter, the elliptic flow magnitude is found to be proportional to the eccentricity characterizing the transverse shape of the initial nuclear overlap region Ollitrault1992 .
Measurements of elliptic flow in the smaller Cu+Cu system have shown surprisingly large values of elliptic flow, in particular for the most central collisions where the average eccentricity of the nuclear overlap region was expected to be small PhobosFlowPRL3 . Experimental measurements of can be affected by event-by-event fluctuations in the initial geometry Miller and it is possible to reconcile the results for Cu+Cu and Au+Au collisions if these fluctuations are properly accounted for PhobosFlowPRL3 . To this end, we have proposed a new definition of eccentricity, which does not make reference to the direction of the impact parameter vector, but rather characterizes the eccentricity through the event-by-event distribution of nucleon-nucleon interaction points obtained from a Glauber Monte-Carlo calculation PhobosFlowPRL3 ; PhobosGlauber . This method of calculating the initial state anisotropy, which leads to finite “participant eccentricity” values even for the most central events and has a large effect in the smaller Cu+Cu system, has been found to be crucial for understanding the comparison of Cu+Cu and Au+Au elliptic flow results PhobosFlowPRL3 .
Using the probabilistic distribution of interaction points obtained from a Glauber calculation, performed on an event-by-event basis, leads to relative eccentricity fluctuations of for Au+Au collisions at fixed number of participating nucleons () PhobosGlauber . Similar calculations taking into account stochastic initial state interaction points in a color glass condensate (CGC) model also yield large relative eccentricity fluctuations of cgc . If is proportional to , an event-by-event measurement of elliptic flow should therefore exhibit sizable fluctuations in , even at fixed .
An event-by-event measurement of the anisotropy in heavy ion collisions is expected to yield fluctuations from three sources: statistical fluctuations due to the finite number of particles observed, elliptic flow fluctuations and other many-particle correlations. The statistical fluctuations in the observed signal can be taken out with a study of the measurement response to the input signal. Particle correlations other than flow (non-flow correlations) such as HBT, resonance decays and jets can resemble correlations due to elliptic flow and have various effects on different flow measurements. In particular, non-flow correlations can broaden the apparent distribution and enhance the observed fluctuations. This letter presents the first measurement of event-by-event dynamic fluctuations in , which include contributions from elliptic flow fluctuations and non-flow correlations.
The data shown here were taken with the PHOBOS detector at RHIC during the year 2004. The PHOBOS detector is composed primarily of silicon pad detectors for tracking, vertex reconstruction, and multiplicity measurements. Details of the setup and the layout of the silicon sensors can be found elsewhere PhobosDet . The collision trigger, event selection and centrality determination are described in Ref. pid63 . The Monte Carlo (MC) simulations of the detector performance are based on the HIJING event generator HIJING and the GEANT 3.21 GEANT simulation package, folding in the signal response for scintillator counters and silicon sensors.
The PHOBOS multiplicity array, composed of single layer silicon pad detectors, has a coverage of over almost the full azimuth. We parametrize the pseudorapidity dependence, , with a single parameter, , and a triangular or trapezoidal shape, given by , or , respectively. Both of these parameterizations provide a reasonable description of the measured pseudorapidity dependence of elliptic flow PhobosFlowPRC .
The event-by-event measurement method has been developed to use all the available information from the multiplicity array to measure the elliptic flow at zero rapidity, , while allowing an efficient correction for the non-uniformities in the acceptance. Taking into account correlations only due to elliptic flow, the probability of a particle with given pseudorapidity, , to be emitted in the azimuthal angle, , in an event with elliptic flow magnitude, , and event-plane angle is given by
| (1) |
The direction of the event-plane angle, , is expected to align with the reaction plane angle if the initial geometry of heavy ion collisions is defined by two smooth Wood-Saxon distributions or with the participant eccentricity axis if initial geometry fluctuations are indeed present. In this measurement, is determined from the distribution of final state particles without relying on any model about the initial geometry of the collision.
The angular coordinates () of charged particles are measured using the location of the energy deposited in the silicon multiplicity detectors. After merging of signals in neighboring pads in cases where a particle travels through more than a single pad, the deposited energy is corrected for the angle of incidence, assuming that the charged particle originated from the primary vertex. Noise and background hits are rejected by placing a lower threshold on this angle-corrected deposited energy. Depending on , merged hits with less than 50-60% of the energy loss expected for a minimum ionizing particle are rejected hitref . Since the multiplicity array consists of single-layer silicon detectors, there is no , charge or mass information available for the particles. All charged particles above a low- cutoff of about 7 MeV/c at =3, and 35 MeV/c at =0 (the threshold below which a charged pion is stopped by the beryllium beam pipe) are included on equal footing. We define the probability density function (PDF) for a hit position for an event with and event-plane angle as
| (2) |
where the normalization parameter is calculated in small bins of such that the PDF folded with the acceptance is normalized to the same value for different values of and . The normalization parameter is given by
| (3) |
where the acceptance function, denotes the probability of a particle moving in the direction to yield a reconstructable hit.
For a single event, the likelihood function of and is defined as , where the product is over all hits in the detector. The likelihood function describes the probability of observing the hits in the event for the given values of the parameters and . The parameters and are varied to maximize the likelihood function and estimate the observed values, and , for each event.
The response of the event-by-event measurement is non-linear and depends on the observed multiplicity . Therefore, a detailed study of the response function is required to extract the true distribution from the measured distribution. Let be the true distribution for a set of events in a given centrality bin, and the corresponding observed distribution. The true and observed distributions are related by
| (4) |
where is the multiplicity distribution of the given set of events and is the expected distribution of for events with fixed input flow , and constant observed multiplicity .
The response function, is determined by performing the event-by-event analysis on modified HIJING events with flow of fixed magnitude . The flow is introduced by redistributing the generated particles in each event in the direction according to the probability distribution given by Eq. 1 and the assumed pseudorapidity dependence of . For the two parameterizations of , triangular and trapezoidal, used in the event-by-event measurement, the corresponding response functions, and , are calculated. Fitting smooth functions through the observed response functions decreases bin-to-bin fluctuations and allows for interpolation in and . The response of a perfect detector can be determined as a function of event multiplicity Ollitrault1992 . In practice, some empirical modifications to the ideal relation, accounting for detector effects, significantly improve fits to the response function, leading to
| (5) |
with and , and where is the modified Bessel function. The four parameters () are obtained by fits to observed in the modified HIJING samples.
Correcting for all known effects incorporated in our MC, we obtain the true event-by-event distribution, , which includes contributions from elliptic flow fluctuations and non-flow correlations. We assume to be a Gaussian in the range footnote with two parameters, and , denoting the mean and standard deviation in the given range. For given values of the parameters, it is possible to take the integral in Eq. 4 numerically to obtain the expected distribution. Comparing the expected and observed distributions, the values of and are found by a maximum-likelihood fit. Midrapidity () results from the two parameterizations of , triangular and trapezoidal, are averaged to obtain the mean and standard deviation of the elliptic flow parameter , where the factor comes from integration over .
The induced fluctuations arising from fluctuations in the number of participating nucleons are calculated by parameterizing the versus results and folding them with the distributions in each centrality bin. The relative contribution of these fluctuations to is found to be less than 8%. Results in this letter are presented after subtraction of induced fluctuations.
Systematic errors have been investigated in three main classes: variations to the event-by-event analysis, response of the analysis procedure to known input , and intrinsic differences between HIJING events and data. Various modifications to the event-by-event analysis have been applied. Corrections, previously used in the hit-based event-plane analysis PhobosFlowPRL1 ; PhobosFlowPRL2 , to account for signal dilution due to detector occupancy and to create an appropriately symmetric acceptance have been applied to both HIJING and data events. The thresholds for background hit rejection have been varied. These changes lead to at most 4% variations in the observed relative fluctuations demonstrating a good understanding of the response function. The determination of the response function and the final fitting procedure have been studied by performing the analysis on sets of modified HIJING events with varying input . Differences between input and reconstructed are identified as a contribution to the systematic uncertainty. The sensitivity of the measurement is observed to be limited for very low values. Therefore the 0-6% most central events, where the reconstructed is below 3%, have been omitted. Differences between HIJING and data in terms of and can, in principle, lead to a miscalculation of the response function. A sample of MC events has been generated, in which the distribution of HIJING events is widened by a simple scaling to match the measurements in data within the errors. The difference between results obtained with and without this modification, as well as the difference between results with two different parameterizations of are identified as contributions to the systematic uncertainty. Other systematic studies include using a flat, rather than Gaussian, ansatz for the true distribution, , and performing the analysis in different collision vertex and event-plane angle bins. The uncertainty in the contribution of induced fluctuations has also been estimated via different parameterizations of the versus results. Contributions from all error sources described above are added in quadrature to derive the 90% confidence level error.
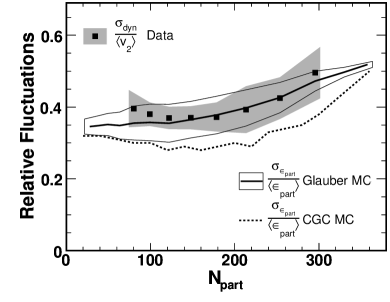
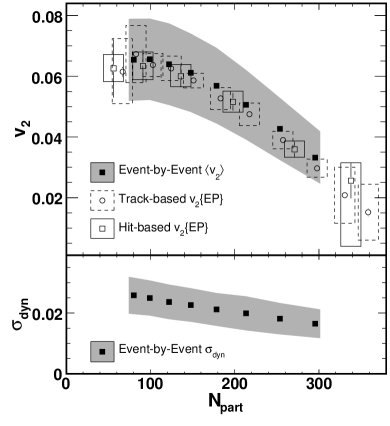
Fig. 1 shows the mean, , and the standard deviation, , of the elliptic flow parameter at midrapidity as a function of the number of participating nucleons, in Au+Au collisions at 200 GeV for 6–45% most central events. The results for are in agreement with the previous PHOBOS measurements PhobosFlowPRL2 , which were obtained with the event-plane method for charged hadrons within . The uncertainties in and , as well as differences between HIJING and the data in these quantities, introduce a large uncertainty in the overall scale in the event-by-event analysis due to the averaging procedure over the wide pseudorapidity range. The event-plane method used in the previous PHOBOS measurements are known to be sensitive to the second moment, , of elliptic flow PhobosGlauber . The fluctuations presented in this letter would lead to a difference of approximately 10% between the mean, , and the RMS, , of elliptic flow at a fixed value of . However, a detailed comparison is not possible for our measurements due to the scale errors, which dominate the systematic uncertainty on and . Most of the scale errors cancel in the ratio, , shown in Fig. 2, revealing large relative fluctuations of approximately 40%.
These results include contributions from both elliptic flow fluctuations and non-flow correlations. With no prior information on the direction of the reaction plane, it is not possible to disentangle these two contributions completely. However, several methods have been proposed to estimate the contribution of non-flow correlations to the observed dynamic fluctuations. One can assume that the correlations in A+A collisions can be modeled by superimposing p+p collisions OlliFluc . However, data from RHIC reveal many differences between the overall correlation structure in Au+Au and p+p (e.g. Trainor ; Wei ; Starridge ; Ed ). A more data-driven approach assumes that non-flow correlations will be small for particle pairs with large pseudorapidity separations (for example, ) nonflow . Under this latter assumption, it is estimated that the relative fluctuations in the actual elliptic flow account for a very large fraction (79-97%) of the observed relative dynamic fluctuations in the parameter nonflow . No attempt was made to correct the data in Fig. 2 for non-flow effects since the validity of the large assumption cannot be unambiguously tested with existing data.
The measured dynamic fluctuations in are directly comparable to models that incorporate both elliptic flow and two particle correlations. Furthermore, without making any assumptions about non-flow, these data establish an upper limit on the magnitude of underlying elliptic flow fluctuations. Also shown in Fig. 2 are at fixed values of obtained in MC Glauber PhobosGlauber and color glass condensate(CGC) cgc calculations. The 90% confidence level systematic errors for MC Glauber calculations (shown as a countour line in Fig. 2) are estimated by varying Glauber parameters as discussed in Ref. PhobosFlowPRL3 . Due to the uncertainties in non-flow effects discussed previously, it is not possible to conclude which of these two models is more consistent with the measured dynamic fluctuations.
In summary, we have presented the first measurement of event-by-event fluctuations in Au+Au collisions at 200 GeV. The relative non-statistical fluctuations of the parameter are found to be approximately 40%. Independent estimates of the non-flow correlation magnitude suggest that the major contribution to these fluctuations are due to intrinsic elliptic flow fluctuations. We show that the magnitude and centrality dependence of observed dynamic fluctuations are consistent with predictions for fluctuations of the initial shape of the collision region. These results provide qualitatively new information on the initial conditions of heavy ion collisions and the subsequent collective expansion of the system.
This work was partially supported by U.S. DOE grants DE-AC02-98CH10886, DE-FG02-93ER40802, DE-FG02-94ER40818, DE-FG02-94ER40865, DE-FG02-99ER41099, and DE-AC02-06CH11357, by U.S. NSF grants 9603486, 0072204, and 0245011, by Polish MNiSW grant N N202 282234 (2008-2010), by NSC of Taiwan Contract NSC 89-2112-M-008-024, and by Hungarian OTKA grant (F 049823).
References
- (1) I. Arsene et al. [BRAHMS Collaboration], Nucl. Phys. A 757, 1 (2005)
- (2) B. B. Back et al. [PHOBOS Collaboration], Nucl. Phys. A 757, 28 (2005)
- (3) J. Adams et al. [STAR Collaboration], Nucl. Phys. A 757, 102 (2005)
- (4) K. Adcox et al. [PHENIX Collaboration], Nucl. Phys. A 757, 184 (2005)
- (5) S. Voloshin, Y. Zhang, Z. Phys., C70, 665, (1996)
- (6) B. B. Back et al. [PHOBOS Collaboration], Phys. Rev. Lett. 89, 222301 (2002)
- (7) B. B. Back et al. [PHOBOS Collaboration], Phys. Rev. Lett. 94, 122303 (2005)
- (8) B. B. Back et al. [PHOBOS Collaboration], Phys. Rev. C 72, 051901(R) (2005)
- (9) P. F. Kolb, P. Huovinen, U. W. Heinz, H. Heiselberg, Phys. Lett. B 500, 232 (2001)
- (10) D. Teaney, Phys. Rev. C 68, 034913 (2003)
- (11) J. Y. Ollitrault, Phys. Rev. D 46, 229 (1992)
- (12) B. Alver et al. [PHOBOS Collaboration], Phys. Rev. Lett. 98, 242302 (2007)
- (13) M. Miller, R. Snellings, arXiv:nucl-ex/0312008, (2003)
- (14) B. Alver et al., Phys. Rev. C 77, 014906 (2008)
- (15) H.J. Drescher and Y. Nara, Phys. Rev. C 76, 041903 (2007)
- (16) B.B. Back et al. [PHOBOS Collaboration], Nucl. Instrum. Meth. A 499, 603 (2003)
- (17) B.B. Back et al. [PHOBOS Collaboration], Phys. Rev. C 75, 024910 (2007)
- (18) M. Gyulassy and X. N. Wang, Comput. Phys. Commun. B 83, 307 (1994)
- (19) R. Brun et al., GEANT3 Users Guide, CERN DD/EE/84-1
- (20) B.B. Back et al. [PHOBOS Collaboration], Phys. Rev. Lett. 87, 102303 (2001)
- (21) The hit distribution on the detector due to negative and positive values of are the same. Therefore a well-defined value for the fluctuations in can only be obtained for . Any distribution with values should be folded around zero for a proper comparison with the results in this paper.
- (22) J.Y. Ollitrault, A.M. Poskanzer, S.A. Voloshin, Phys. Rev. C 80, 014904 (2009)
- (23) J. Adams et al. [STAR Collaboration], Phys. Rev. C 73, 064907 (2006)
- (24) B. Alver et al. [PHOBOS Collaboration], Rev. C81 024904 (2010)
- (25) B.I. Abelev et al. [STAR Collaboration], Phys. Rev. C 80, 064912 (2009)
- (26) B. Alver et al. [PHOBOS Collaboration], Phys. Rev. Lett. 104, 062301 (2010)
- (27) B. Alver et al. [PHOBOS Collaboration], Phys. Rev. C81 034915 (2010)