Indirect study of 19Ne states near the 18F+p threshold.
Abstract
The early 511 keV gamma–ray emission from novae depends critically on the 18F(p,O reaction. Unfortunately the reaction rate of the 18F(p,O reaction is still largely uncertain due to the unknown strengths of low–lying proton resonances near the +p threshold which play an important role in the nova temperature regime. We report here our last results concerning the study of the d(18F,p)19F(N transfer reaction. We show in particular that these two low–lying resonances cannot be neglected. These results are then used to perform a careful study of the remaining uncertainties associated to the 18F(p,O and 18F(p,Ne reaction rates.
keywords:
Transfer reaction, Radioactive beam, DWBA, Spectroscopic factor, Nova nucleosynthesis.PACS:
26.60.Je, 21.10.Jx, 26.30.+k, 27.20+n1 Introduction
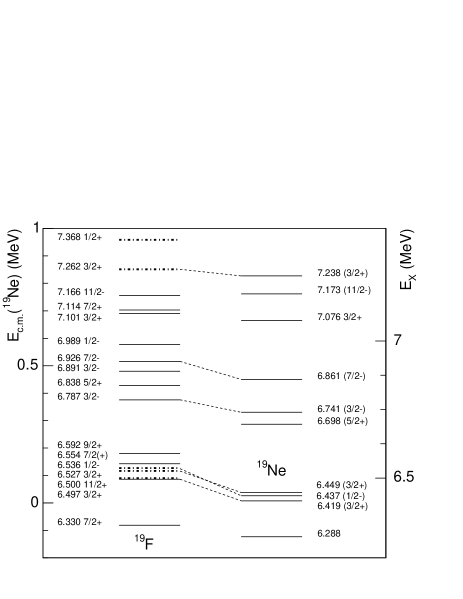
Gamma–ray emission from classical novae is dominated, during the first hours, by positron annihilation resulting from the beta decay of radioactive nuclei. The main contribution comes from the decay of (half–life of 110 min) and hence is directly related to formation during the outburst Gom98 , Her99 , CHJT00 . A good knowledge of the nuclear reaction rates of production and destruction of is required to calculate the amount of synthesized in novae and the resulting gamma–ray emission. The relevant reactions for the production [17O(p,) and 17O(p,)14N] have been recently studied Fox04 , Fox05 , Cha05 and point to a lower production of . The relevant rates for the destruction are the 18F(p,Ne reaction ( MeV) and the much faster 18F(p,O reaction ( MeV). In order to calculate these destruction rates, it is important to determine the properties of the states near the + p threshold. Therefore, an extensive series of experiments like (p,p) elastic scattering Bar00 , Gra01 , Bar01a , direct (p,) measurements Coz95 , Reh95 , Gra97 , Gra01 , Bar01a , Bar02 and indirect transfer reactions to populate levels in and Utk98 , Ser03a , Vis04 , Koz05 have been performed. However, its rate remains poorly known at nova temperatures (lower than 3.5 K) due to the scarcity of spectroscopic information for levels near the proton threshold in the compound nucleus . This uncertainty is directly related to the unknown properties of the first three levels in : , = 6.419 MeV, (3/2+); 6.437 MeV, (1/2-) and 6.449 MeV, (3/2+) (see Fig 1) and following Utku et al. Utk98 we will assume the previous spin and parity assignments even though they have not been measured directly. The tails of the corresponding resonances at = 8, 26 and 38 keV, respectively, can dominate the 18F(p,O astrophysical S–factor in the relevant energy range CHJT00 . As a consequence of these nuclear uncertainties, the production in nova and the early gamma–ray emission was estimated to be uncertain by a factor of 300 CHJT00 .
In order to estimate the level position and spectroscopic factors of the relevant states in , we performed shell–model calculations with the OXBASH code OXBASH . It was not possible to reproduce experimental levels at energies about 6–7 MeV, motivating hence an experimental approach. Due to the very low Coulomb barrier penetrability for the relevant resonances in , a direct measurement of their strength is at present impossible. Hence, we have used an indirect method, the d(18F,p)19F transfer reaction, aiming at the determination of the one–nucleon spectroscopic factor () in the analog levels of the mirror nucleus. Assuming the equality of the spectroscopic factors in analog levels, it is possible to calculate the proton widths through the relation Lan60 , Mac60 where is the single particle width. Preliminary results were presented in Ser03a , here we provide a detailed data analysis.
2 Experimental method
2.1 Experimental set–up
The experiment was performed at the CYCLONE RIB facility at the Centre de Recherches du Cyclotron, UCL, Louvain–la–Neuve, Belgium. We used a 14-MeV radioactive beam which was produced via the 18O(p,n) reaction, chemically extracted to form CH3 molecules, transferred to an ECR source, ionized to the 2+ state and then accelerated to the relevant energy Cog99 . The production of was made in the batch mode and an average of 2.2 ions per second on target was delivered for a total of 40 hours representing 15 batches. The beam contamination from its stable isobar 18O was evaluated 20 hours after the delivery of the last batch from the counting rate on the target. The observed counting rate was in fact compatible with the radioactive decay and indicated a 18O / ratio less than 10-3.
The beam bombarded 100 g/cm2 deuterated polyethylene (CD2) targets. These targets were produced by polymerization and their thickness and homogeneity were checked by measuring the energy loss of particles. The target stoechiometry and contamination were studied at the Orsay ARAMIS accelerator ARAMIS after the d(18F,p)19F experiment. Elastically scattered protons were detected with a silicon detector at a laboratory angle of 150∘ for an incident proton energy of 2.8 MeV Ami93 , Koch69 . It was found that the stoechiometry was not modified during the experiment as expected from the low beam intensity.
The products of the d(18F,p)19F reaction were detected using the multi–strip silicon detector LEDA Dav00 . Two configurations named LEDA and LAMP were used. These detectors are composed of 8 and 6 sectors, respectively, each divided into 16 radial strips. The energy calibration of the 224 strips was performed with a calibrated 3–source (239Pu, 241Am and 244Cm) whereas the time–of–flight calibration was performed with a precision pulser.

The experimental set–up is shown in Fig 2. The protons from the d(18F,p)19F reaction were detected in LAMP positioned 8.7-cm upstream from the target. It corresponds to laboratory angles between 110∘ and 157∘, i.e. center–of–mass angles between 12∘ and 44∘ for the two 3/2+ levels of astrophysical interest. Since these two levels in are situated above the –threshold at 4.013 MeV, they decay through N. The decay products were detected in LEDA positioned 40-cm downstream from the target, which corresponds to laboratory angles between 7∘ and 18∘. The positions of the detectors were determined by Monte-Carlo simulations: for LAMP, the angular range and detection efficiency were maximized and for LEDA, the coincidence efficiency between protons detected in LAMP and 15N detected in LEDA was optimized.
Rutherford elastic scattering of on the carbon contained in the target, detected in LEDA, provides the (target thickness) (beam intensity) normalization. We used the strip at 15.7∘ in LEDA for which the solid angle is maximum and less sensitive to the exact position of the beam on the target. Furthermore, for this strip the elastic scattering peaks of and 12C are well separated. The uncertainty on the normalization is mainly due to the position of the beam ( 2 mm) and is estimated to be of 7%.
Data were collected in event–by–event mode where the multiplicity, the angle, the deposited energy and the time of flight relative to the cyclotron radio–frequency were recorded, allowing an off–line analysis of single and coincidence events.
2.2 Data reduction
Thanks to the low energy ( MeV), below the Coulomb barrier of the + 12C and + d systems, only a few channels are opened: d(18F,O, d(18F,p)19F, d(18F,pN, d(18F,n), and d(18F,n)15O. Single and coincidence events have been analyzed but the coincidence condition between LAMP and LEDA (see Figure 3) allows to distinguish easily the events from these reactions. The two–body properties of the d(18F,O reaction can be observed as a linear correlation between the detected energies in LAMP and LEDA, which is not the case for the three–body d(18F,pN reaction. We performed a further check of the reaction identification by verifying that the reaction products were (not) detected in the same reaction plane, indicating a two (three)–body reaction.
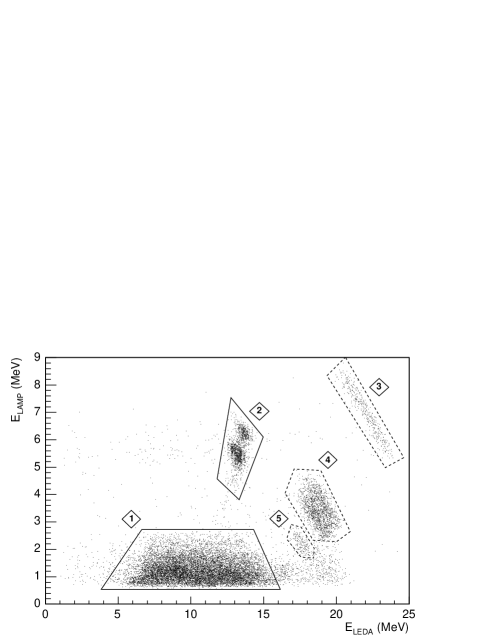
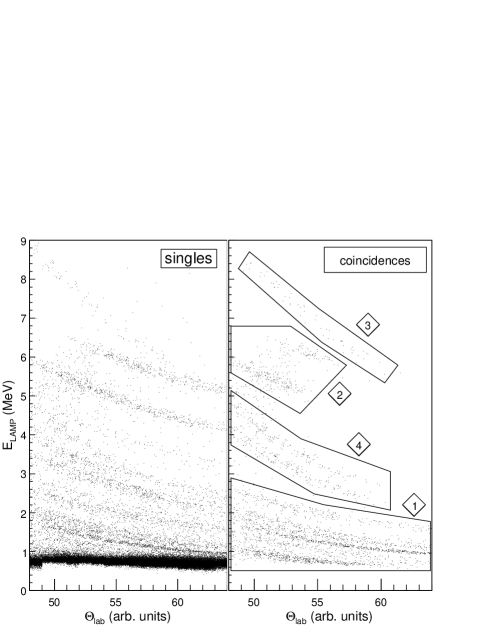
Kinematical bands (energy versus strip number in LAMP) corresponding to the events in Fig 3 are plotted in Fig 4 (right). For comparison, kinematical bands from single events are also plotted in Fig 4 (left). The same patterns as for coincidence events are observed but, in addition, since there is no coincidence condition, some kinematical bands are completed (region 2) or new (between 2 and 4 MeV).
Protons from the d(18F,pN reaction are detected in LAMP in coincidence with –particle or 15N in LEDA. Both type of coincidences can be separated using the time–of–flight information in LEDA, but since the p– coincidences represented only 7% of the total coincidence events, only the p–15N coincidences were analysed. After selection of the p–15N coincidences, the excitation energy of the decaying levels can be kinematically reconstructed from the energies and angles of the detected protons and the known beam energy. From the excitation energy spectra, and after identifying the populated levels, the differential cross section in the center–of–mass system was calculated following the formula:
where is the number of detected protons in a given LAMP strip corresponding to the angle , and are the number of incident ions and the deuteron content of the target per unit area, respectively, and is the geometrical solid angle. In the case of coincidences, is multiplied by the p–15N coincidence efficiency which is determined by Monte–Carlo simulations considering an isotropic angular distribution in the –15N center–of–mass system for the –decay of the . However for the two 3/2+ levels, the –particle is emitted with an angular momentum. Monte–Carlo simulations using –particle angular distribution corresponding to different sub–magnetic population, gave an uncertainty related to the normalisation of about 15%.
3 Spectra and peak deconvolution
3.1 Spectra
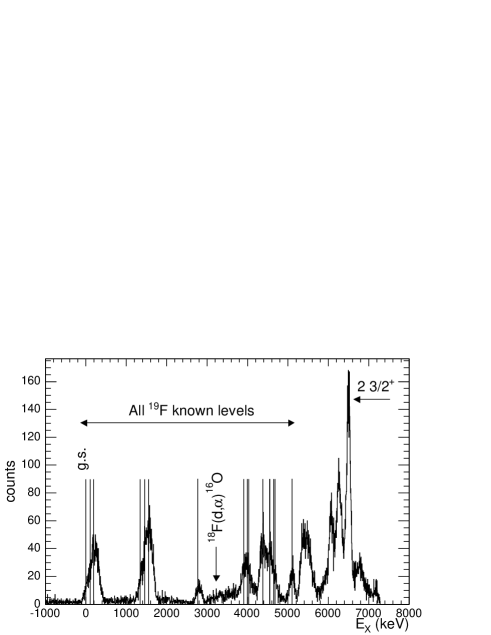
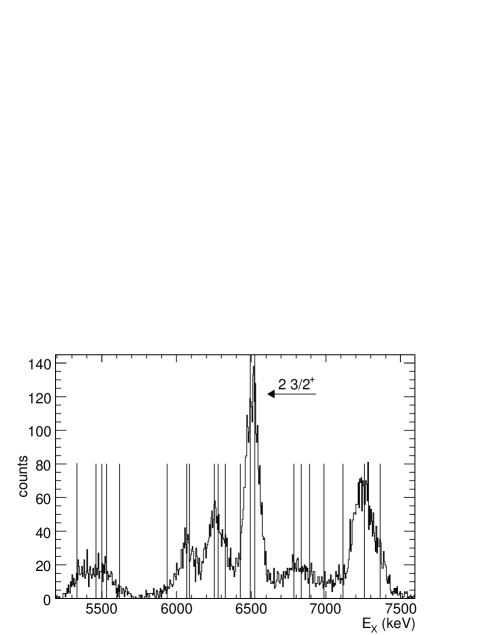
The reconstructed excitation energy spectra are shown in Figure 5 for coincidence (bottom) and single (top) events after applying the alpha calibration and before the internal calibration (see the end of the subsection for more details). Owing to the high coincidence efficiency (), the coincidence and singles counting statistics were comparable. Both spectra correspond to all the events collected in the 6 sectors of the LAMP detector without any correction for the beam position on target. Because LAMP is very close to the target, this reconstruction is very sensitive to the beam position on the target, which is known within 2 mm. Hence the angular position of the strips on a same ring varies, inducing a different reconstructed excitation energy for the same detected proton energy. This, in turn, leads to a deterioration of the resolution when the contribution of the 6 LAMP sectors are directly summed without correction. To compensate this effect, the 6.5 MeV peak obtained in coincidence for each LAMP sector is fitted and each spectrum is shifted relative to the mean position of the 6 sectors.
For the coincidence events, the vertical lines in Figure 5 (bottom) present the position of the levels Tilley populated with low transferred angular momentum (). Even if the energy resolution (FWHM 100 keV) is not sufficient to separate the 20 levels that are represented, the two 3/2+ levels of interest in at and 6.528 MeV (the analogs of the 3/2+ levels in ) are well isolated from the other groups of levels. Unlike for coincidence events, single events (Figure 5 top) are directly selected from a time–of–flight versus energy spectrum in LAMP, which does not allow to separate proton events from –particle events coming from the d(18F,O reaction. For excitation energies higher than about 5 MeV, one can observe the same structure for the single and coincidence spectrum. However, it should be noted that the 7.2-7.3 MeV peak is less populated than in the coincidence spectrum because a higher energy threshold for the selection of single events is used to reduce electronic noise. For lower excitation energy (below the –threshold), levels are observed down to the ground state and the vertical lines represent all the existing levels.
 |
 |
We performed an internal excitation energy calibration using the peaks corresponding to the well isolated levels at = 2.780 MeV, 5.106 MeV as well as the doublet = 7.262 + 7.363 MeV. In case of the unresolved peak at 7.3 MeV, its doublet nature was checked by performing a fit with two components where the position of each component was left as a free parameter. The experimental energy difference obtained ( = 107 keV) is in very good agreement with the energy difference from the literature ( = 101 keV) and the hypothetical presence of a third state in this energy region Koz05 was not needed to describe the data.
3.2 Peak deconvolution
The excitation energy spectrum obtained after the internal calibration is shown in Figure 6 as well as a fit to the data between and 6950 keV. The fit includes the contribution of two levels for the 6.5 MeV peak ( keV), three levels for the 6.25 MeV peak ( keV) and three levels for the 6.9 MeV peak ( keV). The free parameters of the fit are the amplitude of each gaussian and a width common to all the levels. The level energies are fixed. The excess of counts below the 6.5 MeV peak is interpreted as the broad 1/2- level keV Bar05 ( keV) for which only the intensity is left as a free parameter.
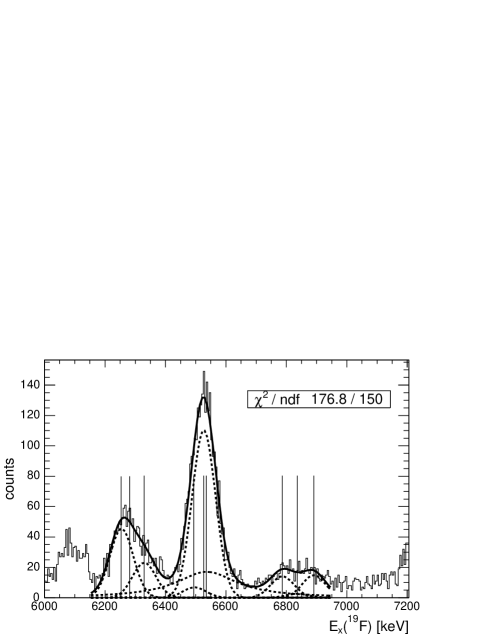
For this broad 1/2- level, we used the values of the energy and width derived recently Bar05 from a reanalysis of previous data Smo61 . Compared to previous adopted values, the width is similar (245 keV instead of 280 keV) but the energy is about 100 keV higher ( keV instead of keV). It should be noted that the fit obtained with the new parameters is better (/ndf = 1.19) than with the previous parameters (/ndf = 1.54, see Figure 1 in Ser04a ). Furthermore, a fit with the same conditions but with the energy of the broad 1/2- level as free parameter naturally gives an energy of keV, compatible with the new value from Bar05 .
The solid line on Figure 6 shows the best fit and the dashed lines represent the contribution of each level separately. For the 6.5 MeV peak composed of the two 3/2+ levels, the high-energy level is favored with a relative contribution of 5%–95% for the and 6527 keV level respectively. A recent experiment using the same reaction but a higher bombarding energy found an opposite proportion for the two 3/2+ levels Koz05 . In both cases, an internal energy calibration of the excitation energy was used. The differences are that our energy calibration is an interpolation based on experimental peaks surrounding the 3/2+ levels of astrophysical interest whereas in Ref. Koz05 the calibration is an extrapolation done for several laboratory angles, from peaks at lower energies than the levels of astrophysical interest.
However, since the two levels are not experimentally resolved, different relative contributions can give similar and hence the nominal relative contribution derived above should be taken with care. Hence we performed a statistical study aiming at the determination of the upper limit of the keV level contribution. A careful study of the systematic errors (target thickness and detector dead layer, beam energy, energy loss in the target and in the detector dead layer, beam centering and detector position) associated to the reconstruction of the excitation energy, showed that the most important uncertainty is related to the precise position of the LAMP detector. Hence three uncertainties were taken into account: the error associated to the internal energy calibration ( keV for MeV), the error associated to the precise position of LAMP after the internal energy calibration ( keV for mm) and the deconvolution procedure of the 6.5 MeV peak. The 1– upper limit for the contribution of the keV level for each effect taken separately is 41%, 34% and 44% respectively. When summed quadratically, we obtain a contribution for the keV level of 5. It should be noted that there is a 7/2 level of unknown parity at keV lying just above the 3/2+ doublet. We estimated its contribution to be less than 5%.
From the previous analysis, one cannot exclude that the two 3/2+ levels are populated in the same proportion. However one expects that these two levels have different structure properties as it is suggested by an electron inelastic scattering measurement on Bro85 . Such an experiment gives access to the tranversal and longitudinal form factors [] as a function of the transfered momentum . For such an inelastic scattering, the form factor depends on the initial and final nuclear states and hence of the nuclear structure of the observed levels. The longitudinal form factor of the two 3/2+ levels are different by more than one order of magnitude, indicating a very different nuclear structure. It is then not surprising that one of the two levels would be preferentially populated through the d(18F,p)19F transfer reaction, since transfer reactions are very sensitive to the nuclear structure.
4 DWBA and compound nucleus components
4.1 DWBA parameters
DWBA calculations were performed with the FRESCO code FRESCO in Finite–Range. For testing the dependency of the results versus the DWBA parameters, two sets of optical parameters were used: A+A’ and B+B’ (see Table 1). The optical potentials are written as usual:
where f(r,ri,ai) is a potential well of Wood–Saxon shape with ri and ai being the radius and the diffuseness of the interaction potentials. VC, V0, W, WD and Vs.o are the Coulomb, the volume, the volume absorption, the surface absorption and the spin–orbit well depths, respectively. Usually the optical parameters are determined by fitting elastic scattering data of the entrance and exit channels. Such data do not exist for the d+ channel, so here the parameters correspond to other nuclear systems of similar masses and similar energies. The first set of parameters A+A’ comes from a compilation Per76 , whereas the second set of parameters B+B’ comes from a similar neutron transfer reaction 19F(d,p)20F which was studied at the same center–of–mass energy Lop64 . In that study, 11 angular distributions of 20F excited states are well described by the optical potential B+B’. For the Finite–Range calculation, the potential describing the deuteron is of Reid Soft Core type Reid68 . The depth of the volume potential well for the transferred neutron is automatically adjusted to reproduce its separation energy in .
| Optical | rC | V0 | r0 | a0 | W | rW | aW | WD | rD | aD | Vs.o. | rs.o. | as.o. |
|---|---|---|---|---|---|---|---|---|---|---|---|---|---|
| potentials | (fm) | (MeV) | (fm) | (fm) | (MeV) | (fm) | (fm) | (MeV) | (fm) | (fm) | (MeV) | (fm) | (fm) |
| + d entrance channel | |||||||||||||
| A | 1.3 | 80.1 | 1.1 | 0.972 | — | — | — | 14.8 | 1.6 | 0.652 | — | — | — |
| B | 1.3 | 60.0 | 1.5 | 0.6 | 20 | 1.5 | 0.6 | — | — | — | — | — | — |
| + p exit channel | |||||||||||||
| A’ | 1.3 | 47.45 | 1.185 | 0.721 | — | — | — | 7.5 | 0.942 | 0.568 | 5.1 | 1.042 | 0.488 |
| B’ | 1.3 | 50.0 | 1.3 | 0.5 | — | — | — | 8 | 1.3 | 0.5 | — | — | — |
It should be noted that even if the energy available in the center–of–mass system (1.4 MeV) of the d(18F,pN reaction is lower that the Coulomb barrier ( MeV), the emitted protons from the two 3/2+ levels of astrophysical interest are slightly above the Coulomb barrier of the exit channel ( MeV and MeV). Hence the term of “sub–Coulomb transfer” does not seem to be justified for the conditions of this reaction. We have checked this by computing a DWBA calculation in which the nuclear potentials were switched off, only leaving a Coulomb potential. This calculation was unable to reproduce the shape of the angular distribution for the two 3/2+ levels.
4.2 Compound nucleus component
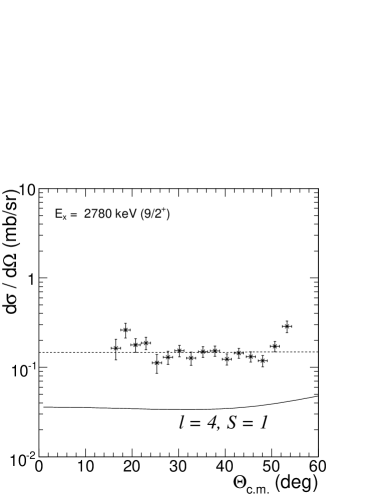
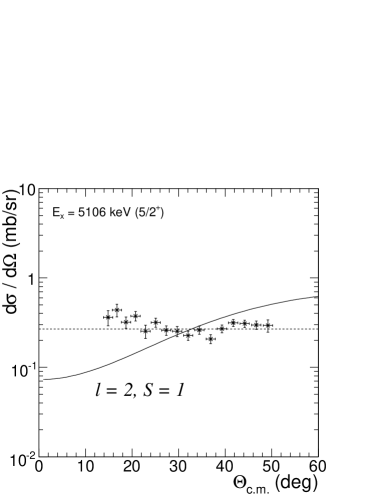
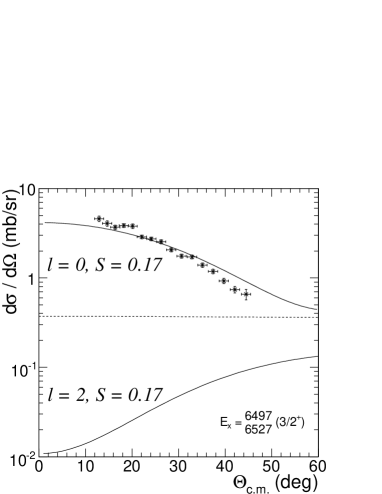
Due to the restricted angular range (), we used the 9/2+ keV level observed in our data to estimate the compound nucleus component. Its spin and parity make it difficult to be populated by a transfer reaction due to the high transferred angular momentum which corresponds to a 9.2 MeV centrifugal barrier, to be added to the Coulomb barrier. The DWBA calculation for this level with a maximum spectroscopic factor of 1 (see Figure 7) fails to describe the data. Two-step processes such as the excitation of the 3+ state at 937 keV in followed by the transfer of a neutron into an orbital were also computed with the coupled channels code CCZR CCZR . The contribution of these two-step processes was at most a few b/sr and can not explain the angular distribution of the 9/2+ level. The Hauser–Feshbach contribution was calculated with the HSFB HSFB code taking into account the open channels from the compound nucleus 20Ne decay at our bombarding energy and normalized to the keV data. Applying this normalization to the 5/2+ keV level describes successfuly the data which does not seem to be described by a dominant direct reaction mechanism (see Figure 7).
5 Discussion
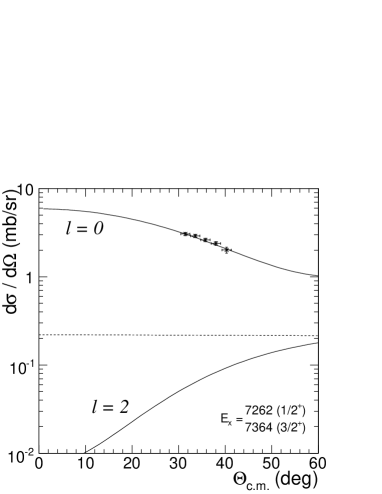
The angular distributions of single data for the and 5106 keV levels and of coincidence data for the doublet and 6527 keV and the two and 7364 keV levels are shown in Figure 7. While the angular distributions for the two levels at and 5106 keV are quite flat, supporting a compound nucleus type reaction mechanism, the angular distribution of the 3/2+ doublet shows a strong variation of about one order of magnitude in a small center–of–mass angular range, which is typical of a direct reaction mechanism. The spectroscopic factors obtained from our analysis are displayed in Table 2.
 |
 |
 |
 |
| () [MeV] | Jπ | ||
|---|---|---|---|
| 3/2+ | 0 | 0.17 | |
| 6.536 | 1/2- | 1 | 0.33 |
| 7.262 | 3/2+ | 0 | 0.15 |
| 7.363 | 1/2+ | 0 | 0.22 |
5.1 Levels at = 6.497 and 6.527 MeV in
The two 3/2+ levels can be populated by both and transfers, however the fit of the DWBA calculations to the data indicates that only the component is contributing (see Figure 7) at such low center of mass energy. At much higher incident energy, a component was requested to reproduce transfer data Koz05 . Taking into account the compound nucleus contribution as explained above, we obtain for a spectroscopic factor of (to be compared with from a recent experiment Koz05 ). This value supersedes our previous value of Ser03a : the difference comes from the new Finite–Range DWBA calculations and the inclusion of the Hauser–Feshbach contribution. The fact that the two sets of optical parameters A+A’ and B+B’ give very similar angular distributions and spectroscopic factors makes us to feel confident about the present results. The analysis of the single data events for this 3/2+ doublet allowed us to derive the corresponding angular distribution and to compare it with the coincidence one. They agree well, both in the shape and in the normalisation, hence giving strong confidence in the coincidence solid angle determined by Monte–Carlo simulations.
The uncertainties associated to the spectroscopic factors have been evaluated to be of 25%. The major source of uncertainty comes from the DWBA method (20%) and is related to the choice of the optical parameters in the entrance channel which cannot be constrained by experimental data. Another source of uncertainty (15%), which has already been discussed, arises from the angular distribution of the emitted –particle in the center–of–mass frame. The uncertainty on the normalization contributes to 7% (Section 3).
5.2 Level at = 6.536 MeV in
Due to its large total width keV Bar05 , this 1/2- level can play an important role in the 18F(p,O reaction since it covers the whole Gamow peak at novae temperatures. But its large width also makes it difficult to be observed. However, making the hypothesis that all the excess of counts below the 6.5 MeV peak comes from the 1/2- level, an upper limit to its contribution could be derived. This hypothesis does not seem unrealistic because no counts are observed in the coincidence spectrum in the MeV region (see Figure 5 bottom), where no levels exist. Hence this seems to indicate that the excess of counts below the 6.5 MeV peak has a physical origin.
The number of counts corresponding to the population of the 1/2- level is obtained from the global fit presented in Figure 6 where this level is described by a lorentzian shape whose amplitude is a free parameter. Then, assuming a transfer for populating this level, one obtains an upper limit for the spectroscopic factor of . The difference with respect to our previous value ( Ser03a ) comes from the new position and width of this level Bar05 as well as from the DWBA calculation, now made in Finite–Range.
5.3 Levels at = 7.262 and 7.364 MeV in
The experimentally unresolved levels at 7.262 and 7.364 MeV have a 3/2+ and 1/2+ spin and parity, respectively, and both can be populated by a or neutron transfer. However the DWBA calculations fitted to the data showed that only the is contributing (see Figure 7). These two levels have the highest excitation energy which can be achieved with the beam energy used here, and correspond to the less energetic protons detected ( MeV). Part of the kinematical band of these two levels, which are not experimentally resolved, is cut by the electronic threshold. Hence only the five outer strips of LAMP were considered in the analysis. The extracted angular distribution does not allow to deduce the relative contribution of the two levels since the differential cross section has the same shape due to the same transfer but a different normalisation (a factor of 2) due to the spin factor. However a two–peak fitting analysis of the 7.3 MeV excitation energy peak indicates a relative contribution of 57%–43% for the 7.262 and 7.364 MeV levels, allowing to obtain a set of spectroscopic factors and . The compound nucleus component which has been taken into account has a negligible cross section ( mb/sr).
5.4 Analog level of the = 7.076 MeV
Up to now, the analog level in of the 18F(p,O resonance at keV [ MeV, Jπ = 3/2+] is still not identified. A gamma–ray measurement But98 via the 15N(,) reaction found a level at 7.101 MeV in with a width keV. The spin and parity was deduced to be 3/2+ by observing gamma–ray transitions to a 3/2- level. Assuming equality of reduced –widths between analog states, Butt et al. But98 find keV for the level at MeV, which is in good agreement with the value of keV from Bar01a .
However, the assignation of a 3/2+ spin and parity to the MeV level has been questioned by Fortune and Sherr For00 who pointed out that this level could be a doublet of spins 1/2–5/2 or 1/2–7/2. Furthermore, these authors predict the position of the analog level at higher energy around MeV.
Assuming here that the 7.101 MeV level in is the analog of the MeV and assuming equality between dimensionless reduced widths [], we obtain . This value is comparable to the one from the two 3/2+ levels of astrophysical interest () and should hence appear in our spectra as a peak of similar intensity as the 6.5 MeV peak, but our data (Figure 5, bottom) do not show any evidence of a peak around 7.1 MeV. Furthermore it has been shown recently that the spin of this resonance was unlikely to be 3/2+ Bar05 .
The 7.3 MeV group in is composed of two states at 7.262 MeV (3/2+) and 7.368 MeV (1/2+) whose spectroscopic factors are determined here to be and 0.22, respectively (see Table 2). The spectroscopic factor value for the 3/2+ state is very close to the one of the level at 7.076 MeV in , and seems then to indicate that the MeV is a good candidate for the analog level of the 7.076 MeV in . However, it should be noted that the total width of the 7.262 MeV level in calculated from the MeV is keV which seems incompatible with the measured value keV Tilley .
5.5 Proton widths in
The obtained neutron spectroscopic factors are for levels whereas the proton widths of astrophysical interest correspond to their analog levels in . Following Utku et al. Utk98 , we assume that the two 3/2+ levels and 6527 keV and the 1/2- level keV populated in are the analog states of the 3/2+ levels and 6449 keV, and of the keV, respectively, even if the spins and parity of states has not been determined experimentaly. Unlike other analog levels in / where the assignation comes from the fact that the levels are populated with comparable statistics by mirror reactions, the case of the two 3/2+ and 1/2- levels only relies on the similarity of their energy position and of their total width, respectively. The two 3/2+ levels are both separated by 30 keV in and at similar excitation energies, whereas for the 1/2- level .
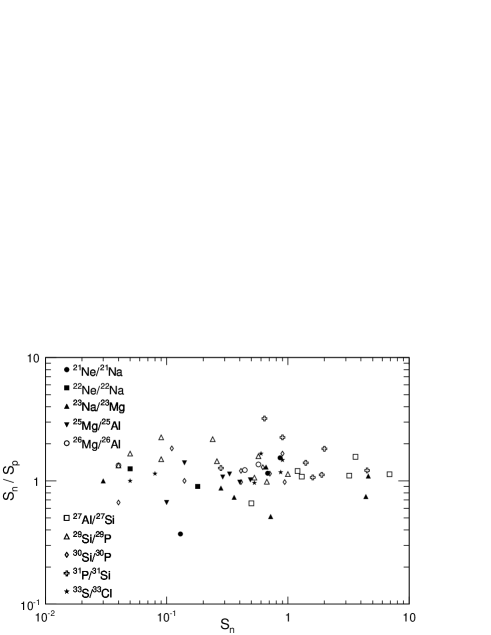
It is of common use in nuclear astrophysics to assume equality of spectroscopic factors between analog states. Hence for the 3/2+ states in , we obtain a proton spectroscopic factor and for the 1/2- state, we obtain an upper limit . However, the uncertainty associated to this practice is estimated to be a factor of two from the comparison of the values of neutron and proton spectroscopic factors for all the analog states of the shell nuclei (Figure 8).
The proton widths are calculated using the following relations:
where is the single–particle width, is the interaction radius ( fm) and is the proton radial wave function in the p+ system calculated with classical parameters for the Wood–Saxons nuclear potential: (, ) = (1.25, 0.65) fm, where and are the radius and diffuseness of the potential. As compared to direct determination of the proton width, a statistical study of shell nuclei showed an agreement between direct and indirect method of about 30% Hal04 . Using the above prescription we obtain for the 3/2+ doublet in , keV and keV assuming that the total strength of the doublet is put on each level respectively. As far as the levels above = 7 MeV are concerned and if we assume that the levels MeV and MeV are analogs Utk98 we obtain keV which is larger than the adopted upper limit ( keV Utk98 ). For the analog state of the MeV 1/2+ level, no 1/2+ levels in have been observed so far at an excitation energy around 7.3 MeV.
6 CONCLUSIONS: REMAINING UNCERTAINTIES
Our analysis showed that the two expected low–lying 8 keV and 38 keV proton resonances ( and 6449 keV in ) must be considered for the calculation of the 18F(p,O reaction. Here we focus on the remaining uncertainties before firm reaction rates can be computed for the 18F(p,O and 18F(p,Ne reactions.
Due to the small energy difference (30 keV) between the two 3/2+ levels in ( and 6527 keV) and the two resonances in ( and 38 keV), the assignment of analog pairs is not straigthforward and one cannot discard the possibility of an inversion. Hence the identification of the main contributing level is not so crucial for the determination of the associated proton widths in . So two cases will have to be considered, the whole strength at the = 8 keV resonance or at the = 38 keV resonance.
The second uncertainty arise from interference effects between the two = 8 and 38 keV resonances and the 3/2+ resonance at keV (corresponding to the level MeV). The sign of these interferences is totally unknown and for the destructive case, the S–factor would become extremely small between 100 and 300 keV, which corresponds to Gamow peak energies for temperatures achieved in novae (). As usual, the notation corresponds to the temperature K.
Another uncertainty on the reaction rates comes from the poor knowledge of the alpha widths, , for the and 38 keV resonances. Since there are no measurements of these in , they are usually deduced from the analog states in . However differences as large as a factor 10 have been observed for alpha widths of analog levels for the / mirror nuclei Oli97 . Calculations of constructive and destructive interferences for different values of alpha widths showed a strong impact on the 18F(p,O reaction rate Ser03b .
Finally the energy of the two and 38 keV resonances in is not known better than 6 keV Utk98 . This effect is far less important than the one of the unknown alpha widths because the position of the resonances are below the energies corresponding to the Gamow peak for temperatures relevant to production in novae.
In conclusion we reported here on our latest results concerning the one–nucleon transfer reaction d(18F,pN used to study analog states of the astrophysically important states in . A DWBA analysis of the data showed that the two 3/2+ low–energy resonances in , and 38 keV have a relatively large spectroscopic factor ( = 0.17) and hence cannot be neglected in calculating the 18F(p,O and 18F(p,Ne reaction rates. We made a careful analysis of the impact on the reaction rates of remaining uncertainties. This includes interferences between the low–lying states and the 3/2+ keV resonance, the unknown –widths in and the possibility of inversion for the analog levels between and . A new challenging experiment to investigate the 18F(p,O reaction at energies below 0.6 MeV in the center–of–mass will be soon performed at the Louvain-la-Neuve CYCLONE facility.
Acknowledgments
This work has been supported by the European Community-Access to Research Infrastructure action of the Improving Human Potential Program, contract N° HPRI-CT-1999-00110, and the Belgian Inter–University Attraction Poles P05/07. One of us (P.L.) is a Research Director of the National Fund for Scientific Research, Brussels. We wish to thank Jean-Pierre Thibaud for very fruitful discussions concerning the data analysis and his careful reading of the manuscript. We also thank Jordi José and Margarita Hernanz for very interesting discussions concerning the astrophysical implications of the present work.
References
- [1] J. Gómez-Gomar, M. Hernanz, J. José, et al. MNRAS 296 (1998) 913.
- [2] M. Hernanz, J. José, A. Coc, et al. Astrophys. J. 526 (1999) L97.
- [3] A. Coc, M. Hernanz, J. José, et al. Astron. Astrophys. 357 (2000) 561.
- [4] C. Fox, C. Iliadis, A. E. Champagne, et al. Phys. Rev. Lett. 93 (2004) 081102.
- [5] C. Fox, C. Iliadis, A. E. Champagne, et al. Phys. Rev. C71 (2005) 055801.
- [6] A. Chafa, V. Tatischeff, P. Aguer, et al. Phys. Rev. Lett. 95 (2005) 031101.
- [7] D. W. Bardayan, J. C. Blackmon, W. Bradfield-Smith, et al. Phys. Rev. C62 (2000) 42802.
- [8] J.-S. Graulich, S. Cherubini, R. Coszach, et al. Phys. Rev. C63 (2001) 11302.
- [9] D. W. Bardayan, J. C. Blackmon, W. Bradfield-Smith, et al. Phys. Rev. C63 (2001) 65802.
- [10] R. Coszach, M. Cogneau, C. R. Bain, et al. Phys. Lett. B353 (1995) 184.
- [11] K. E. Rehm, M. Paul, A. D. Roberts, et al. Phys. Rev. C52 (1995) 460.
- [12] J.-S. Graulich, F. Binon, W. Bradfield-Smith, et al. Nucl. Phys. A626 (1997) 751.
- [13] D. W. Bardayan, J. C. Batchelder, J. C. Blackmon, et al. Phys. Rev. Lett. 89 (2002) 262501.
- [14] S. Utku, J. G. Ross, N. P. T. Bateman, et al. Phys. Rev. C57 (1998) 2731.
- [15] N. de Séréville, A. Coc, C. Angulo, et al. Phys. Rev. C67 (2003) 052801 (R).
- [16] D. W. Visser, J. A. Caggiano, R. Lewis, et al. Phys. Rev. C69 (2004) 048801.
- [17] R. L. Kozub, D. W. Bardayan, J. C. Batchelder, et al. Phys. Rev. C71 (2005) 032801 (R).
- [18] B. A. Brown, A. Etchegoyen, and W. D. M. Rae. The computer code OXBASH, MSU–NSCL Report No. 524 (1988).
- [19] A. M. Lane. Rev. Mod. Phys. 32 (1960) 519.
- [20] M. H. Macfarlane and J. B. French. Rev. Mod. Phys. 32 (1960) 567.
- [21] M. Cogneau, P. Decrock, M. Gaelens, et al. Nucl. Inst. and Meth. A420 (1999) 489.
- [22] H. Bernas, J. Chaumont, E. Cottereau, et al. Nucl. Inst. and Meth. B62 (1992) 416.
- [23] R. Amikiras, D. N. Jamieson, and S. P. Dooley. Nucl. Inst. and Meth. B77 (1993) 110.
- [24] D. C. Kocher and T. B. Clegg. Nucl. Phys. A132 (1969) 455.
- [25] T. Davinson, W. Bradfield-Smith, S. Cherubini, et al. Nucl. Inst. and Meth. A454 (2000) 350.
- [26] D. R. Tilley, H. R. Weller, C. M. Cheves, et al. Nucl. Phys. A595 (1995) 1.
- [27] D. W. Bardayan, R. L. Kozub, and M. S. Smith. Phys. Rev. C71 (2005) 018801.
- [28] H. Smotrich, K. W. Jones, L. C. McDermott, et al. Phys. Rev. 122 (1961) 232.
- [29] N. de Séréville, E. Berthoumieux, and A. Coc. Nucl. Phys. A478 (2005) 745c.
- [30] B. A. Brown, B. H. Wildenthal, C. F. Williamson, et al. Phys. Rev. C32 (1985) 1127.
- [31] I. J. Thompson. Computer Physics Report 7 (1988) 167.
- [32] C. M. Perey and F. G. Perey. Atomic Data and Nuclear Data Tables 17 (1976) 1.
- [33] M. E. O. de López, J. Rickards, and M. Mazari. Nucl. Phys. 51 (1964) 321.
- [34] R. V. Reid. Annals of Physics 50 (1968) 411.
- [35] J. Van de Wiele (1970). IPN Orsay, unpublished.
- [36] M. Mermaz. Sur la séparation des mécanismes de réactions à basse énergie. Étude des réactions 27Al(d,p)28Al, 24Mg(d,p)25Mg et 24Mg(d,)22Na (1967). Rapport CEA - R 3078, unpublished.
- [37] Y. M. Butt, J. W. Hammer, M. Jaeger, et al. Phys. Rev. C58 (1998) 10.
- [38] H. T. Fortune and R. Sherr. Phys. Rev. C61 (2000) 24313.
- [39] S. E. Hale, A. E. Champagne, C. Iliadis, et al. Phys. Rev. C70 (2004) 045802.
- [40] F. de Oliveira, A. Coc, P. Aguer, et al. Phys. Rev. C55 (1997) 3149.
- [41] N. de Séréville. Ph.D. thesis (2003).