Measurement of the beam asymmetry in –photoproduction off the proton
Abstract
The beam asymmetry, , was measured at ELSA in the reaction using linearly polarised tagged photon beams, produced by coherent bremsstrahlung off a diamond. The crystal was oriented to provide polarised photons in the energy range to 1400 MeV with the maximum polarisation of % obtained at 1305 MeV. Both dominant decay modes of the into two photons and were used to extract the beam asymmetry from the azimuthal modulation of the cross section. The measurements cover the angular range – 150 degrees. Large asymmetries up to 80 % are observed, in agreement with a previous measurement. The eta-MAID model and the Bonn–Gatchina partial wave analysis describe the measurements, but the required partial waves differ significantly.
pacs:
13.60.-rPhoton and charged-lepton interactions with hadrons and 13.60.LeMeson production and 13.88.+ePolarization in interactions and scattering and 14.20.GkBaryon resonances with S=01 Introduction
The rich excitation spectrum of the nucleon mirrors its complicated multi–quark inner dynamics. Therefore baryon spectroscopy is expected to provide benchmark data for any model of the nucleon, e.g. quark models in their variety CR00 ; Loering01 or, increasingly in the near future, Lattice QCD as an approximation of full Quantum Chromodynamics KLW05 . However, in many cases widths and density of states prohibit a clean identification, i.e. an unambiguous assignment of quantum numbers within a partial wave analysis.
The analyses are mostly based on pion and kaon induced reactions. Since some excited states are suspected to have a strongly disfavoured coupling CR94 , photoinduced reactions offer a complementary access to the nucleon spectrum, in particular in non-pionic final states. This provided the motivation to search for expected (within quark models) but yet unobserved “missing” resonances in photoproduction off the proton Crede05 ; SL02 ; Chen03 .
The channel provides a great simplification to the complex spectrum. Due to its isospin it only connects states () to the nucleon ground state, but no states (). Nevertheless, an unambiguous extraction of all contributing partial waves still requires a complete experiment with respect to the reaction amplitudes. Pseudoscalar meson photoproduction is determined by 4 complex amplitudes. However, due to the inherent nonlinearities it is not sufficient to measure independent quantities, as could be naively expected. Instead, it can be shown that a minimum of 8 observables needs to be measured CT97 . Besides the differential cross section those include 3 single-spin and 4 double-spin observables. The combination of double-spin observables can be appropriately chosen, but cross section, target asymmetry, , recoil polarisation, , and beam asymmetry, , are required in any case (for a definition of the observables see e.g. ref.KDT95 ).
Once a linearly polarised photon beam is provided, the photon-beam asymmetry is already accessible without polarised target or recoil polarimetry. For this case the cross section of pseudoscalar meson photoproduction off a nucleon can be cast into the form KDT95
| (1) |
where denotes the polarisation independent cross section, the degree of linear polarisation of the incident photon beam, and the azimuthal orientation of the reaction plane with respect to the plane of linear polarisation. While in principle it suffices to determine around and degrees, it is more favourable to extract the beam asymmetry from the modulation of the cross section over the full azimuthal circle, since systematic effects are better under control. Thus, a cylindrically symmetric detector such as Crystal Barrel CBarrel is particularly suited to measure in photoproduction.
Most previous experiments investigated differential cross sections Crede05 ; Krusche95 ; Renard02 ; Dugger02 . But there are also a few measurements of single polarisation observables. Heusch et al. Heusch70 determined the recoil proton polarisation in photoproduction between GeV and GeV in a spark chamber experiment. The target asymmetry was measured at the Bonn synchrotron Bock81 . A first measurement of the photon beam asymmetry using linearly polarised photon beams was accomplished at the laser backscattering facility GRAAL at the ESRF Grenoble Ajaka98 . The GRAAL experiments were later on extended to higher energies and preliminary results have been presented at conferences Kouznetsov02 . Large were obtained in the near-threshold region. Contrary, in electroproduction the interference cross section, which is related to , was found consistent with zero over almost all the range in — GeV/c2 in the threshold region Thompson01 .
In order to clarify this situation and to extend the energy range in photoproduction we carried out experiments with linearly polarised tagged photon beams at the electron accelerator ELSA Hillert06 of the University of Bonn. The following section is first devoted to the experimental setup. In addition to the basic analysis steps, section 3 then describes the method of extracting . The results are discussed in section 4 and, after a brief summary, tabulated in the appendix.
2 Experimental Setup
Electron beams of GeV were used to produce coherent bremsstrahlung from a m thick diamond crystal. Electrons which radiated a photon are momentum analysed using a magnetic dipole (tagging-) spectrometer. Its detection system consists of 14 plastic scintillators providing fast timing and additional hodoscopes to achieve the required energy resolution: The range of low electron energies, corresponding to , is covered by a multi-wire proportional chamber, a 480 channel double-layer scintillating fibre detector complements the range . At the nominal setting of GeV the energy resolution varies between 2 MeV for the high photon energies and 25 MeV for the low energies. Since the photon beam remained virtually uncollimated, the measured electron spectrum directly reflects the photon spectrum.
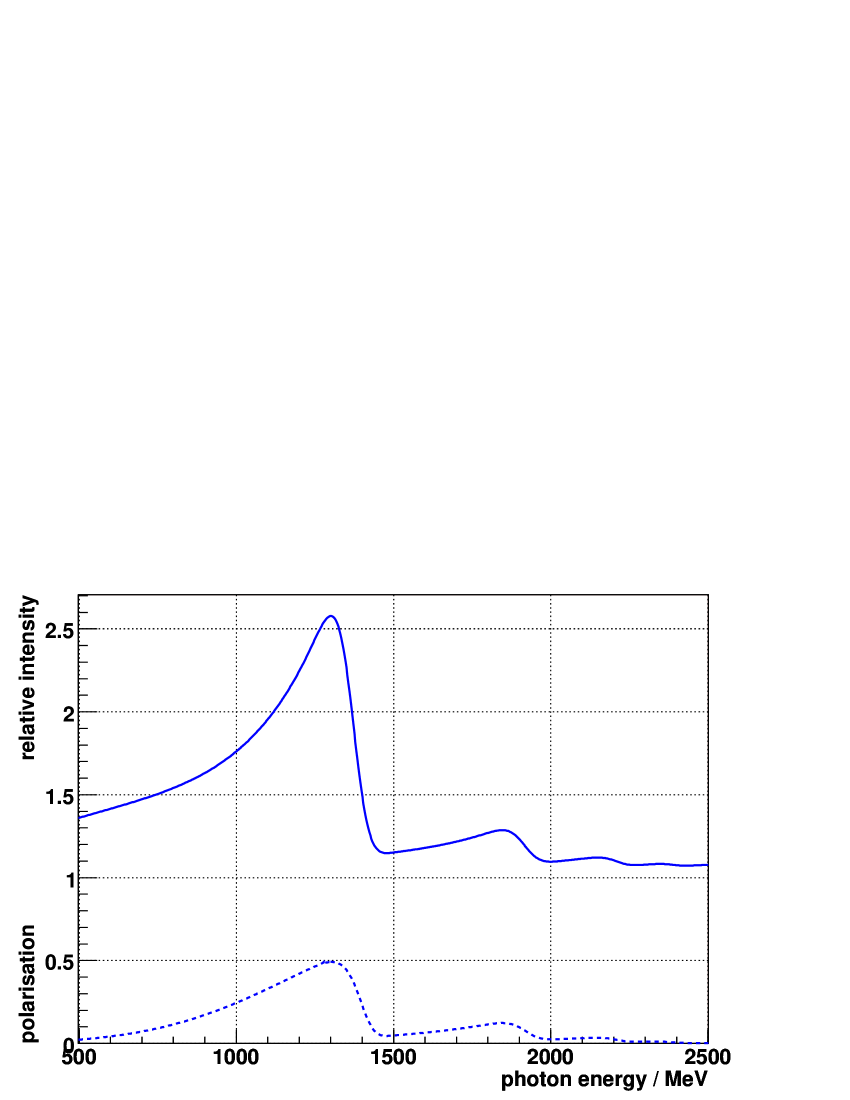
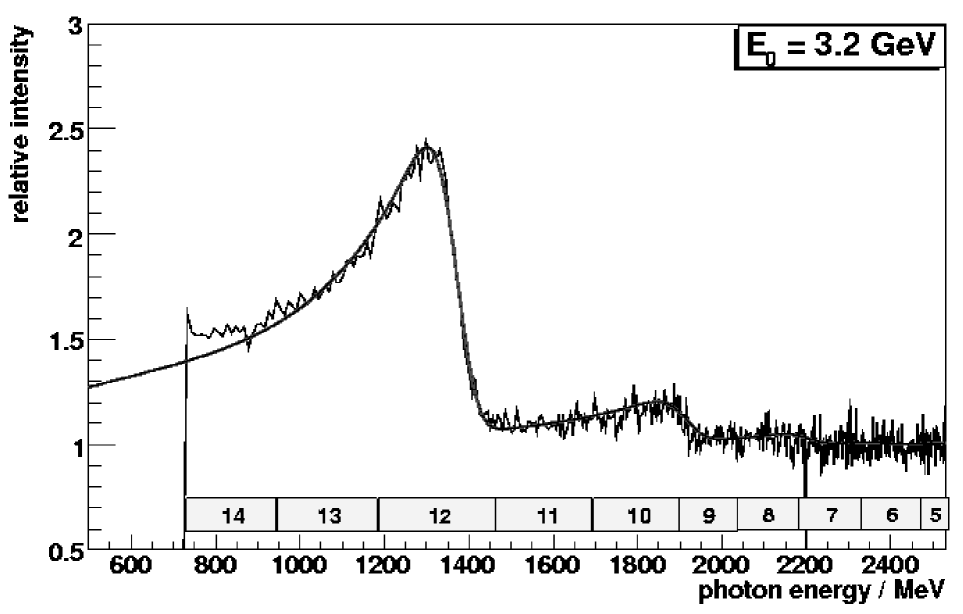
Fig.1 shows the photon energy distribution obtained from the diamond radiator, measured through the detection of the corresponding electrons in the tagging system. This spectrum is normalised to the spectrum of an amorphous copper radiator. Hence, a constant run of the curve corresponds to the ordinary dependence in the bremsstrahlung process. This representation accentuates the coherence effect, which manifests itself in clear peaks. Within the range of the coherent peaks the bremsstrahlung recoil is transferred to the whole crystal as opposed to individual nuclei in the incoherent process, thus fixing the plane of electron deflection very tightly relative to the orientation of the crystal lattice. Consequently, the emitted photons are linearly polarised Timm69 . The maximum achievable degree of polarisation decreases with increasing photon energy, is obtained at . The orientation of the linear polarisation and the position of the maximum in the photon energy-spectrum can be deliberately chosen through appropriate alignment of the crystal relative to the electron beam direction. We used a crystal setting to obtain the polarisation maximum at 1305 MeV. Vertical orientation of the polarisation vector was chosen, since the vertical emittance of the electron beam is about an order of magnitude better than in horizontal direction. A dedicated commercial 5-axis goniometer111Newport company enabled the accurate crystal alignment with typical angular uncertainties of rad.
The curve in Fig.1 represents a calculation of the spectrum using an improved version Elsner06 of the original ANB (“analytic bremsstrahlung calculation”) software ANB from Tübingen University. It nicely describes the measured spectrum. This level of agreement can be only obtained, if the incoherent part of the ANB calculation is scaled by a factor of . This was traced back to an inaccurate inclusion of multiple scattering and an uncertainty in the atomic form factors Elsner06 . Using the form factor parametrisation after Schiff Sch51 instead that of Hubbell Hub59 improves the agreement significantly.
The relative strengths of coherent and incoherent contributions determine the absolute value of linear polarisation. It can be obtained from any fit of the spectrum as long as there is no overlap of different reciprocal lattice vectors — which can correspond to different orientations of the resulting polarisation vector — within a given energy interval. This condition is surely fulfilled, if adjacent peak regions do not overlap. In this respect the mentioned re-scaling of the incoherent contributions introduces no significant error. As can be seen from Fig.1, in our particular case there is only a tiny overlap between the adjacent peaks. Furthermore, both of them even result in the same orientation of the polarisation vector.
Fig.2 shows the ANB-calculated relative photon intensity spectrum in conjunction with the calculated photon polarisation. The maximum polarisation of is obtained at MeV, as expected. An absolute error of is estimated. The total photon flux was up to s-1.
The detector setup of the experiment is depicted in Fig.3. The linearly polarised photon beam was incident on a cm long liquid hydrogen target with 80 m Kapton windows Kop02 . A three layer scintillating fibre detector Suft05 surrounded the target within the polar angular range from 15 to 165 degrees. It determined a piercing point for charged particles. Both, charged particles and photons were detected in the Crystal Barrel detector CBarrel . It was cylindrically arranged around the target with 1290 individual CsI(Tl) crystals in 23 rings, covering a polar angular range of 30 — 168 degrees. The crystals of 16 radiation lengths guaranteed nearly full longitudinal shower containment. In transverse direction electromagnetic showers extended over up to 30 modules. For photons an energy resolution of and an angular resolution of degree was obtained.
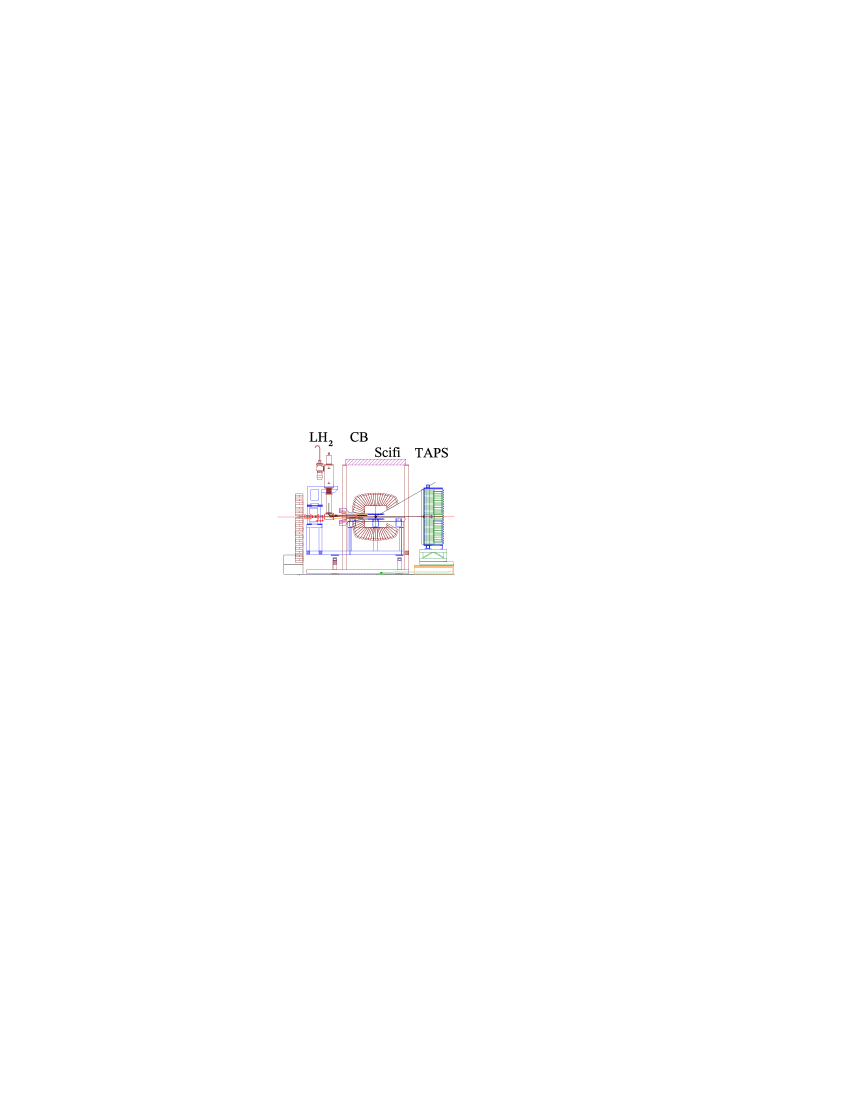
The — 30 degree forward cone was covered by the TAPS detector TAPS , set up in one hexagonally shaped wall of 528 BaF2 modules. For photons between 45 and 790 MeV the energy resolution is Gabler94 . The position of photon incidence could be resolved within 20 mm. For charged particle recognition each TAPS module has a 5 mm plastic scintillator in front of it.
In contrast to Crystal Barrel, the fast TAPS detectors are individually equipped with photomultiplier readout. Thus, the first level trigger was derived from TAPS, requiring either hits above a low threshold () or, alternatively, hit above a high threshold (). Using, within s, a fast cluster recognition Flemming00 for the Crystal Barrel as second level trigger (), the total trigger condition required , with 2 clusters identified at second level.
3 Event reconstruction and data analysis
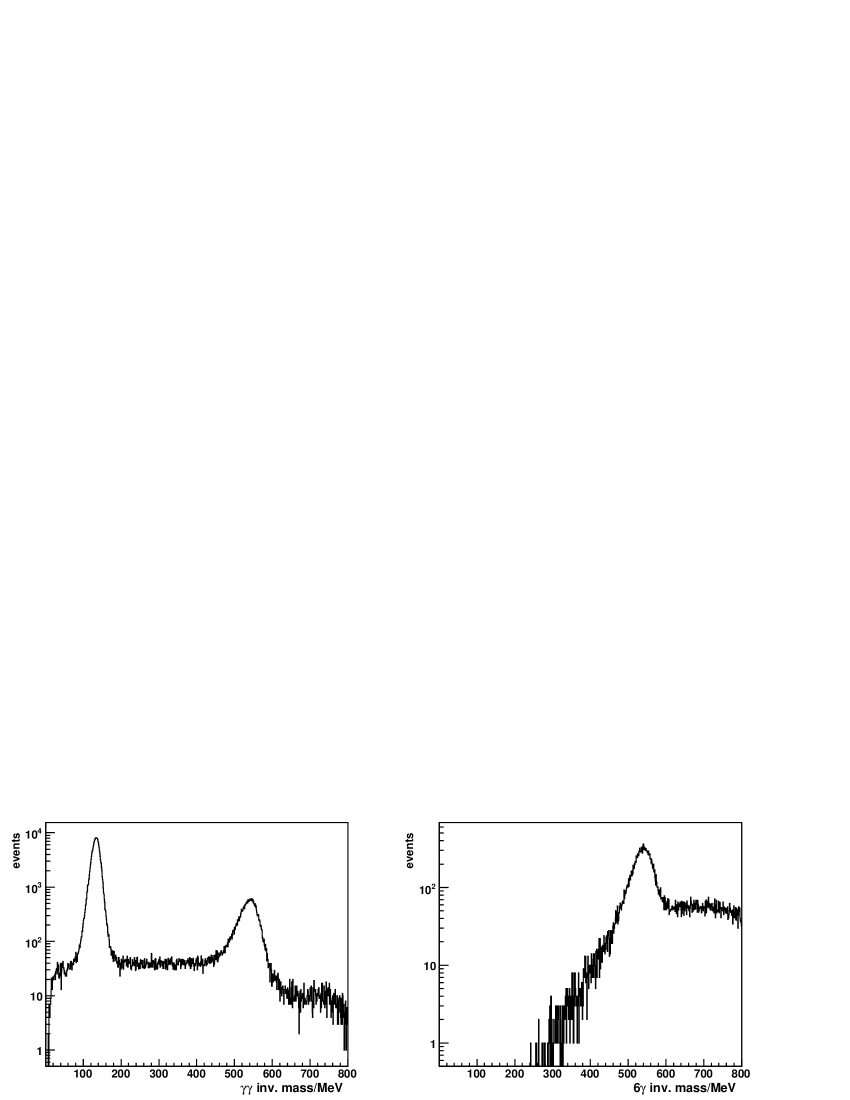
To enrich the final state, the occurence of, in total, either three or seven detector hits was required during the offline analysis, corresponding to two or six photons and the proton. In particular photon hits usually fire a cluster of adjacent crystals whose energy is summed over. After the basic detector calibrations from the data itself, the meson is identified in either of its major decay modes into two photons or . Fig. 4 shows the respective invariant mass distributions, obtained after only basic kinematic cuts have been applied in order to ensure consistence of the azimuthal angles (i.e. coplanarity) and polar angles involved. No cuts were applied on the energy of the respective hit of the proton candidate. The signal widths in Fig. 4 are MeV and MeV, respectively. To avoid any possible bias from detector inefficiencies on the azimuthal distributions, the proton was not positively identified by using the signals of the inner scintillating fibre detector of the barrel or the veto detectors of TAPS. Instead, all combinatorial possibilities were processed, i.e. 3 for the 3–cluster events and 21 for the 7–cluster events. A cut on the missing mass applied to the proton candidates subsequently yielded a clean separation. No kinematic fit was used to improve the separation, nor to increase the resolution.
As can be seen from Fig. 4, the background below the peaks is very small (note the logarithmic scale). It varies with photon energy and thus was determined in each bin of . Two different fits were used to interpolate the background between the edges of the signal, linear and gaussian. From the difference the possible systematic error was estimated which may be due to the background subtraction scheme.
3.1 Beam asymmetry
Cuts of widhts around the –mass in the invariant mass spectra (Fig. 4) yielded a clean event sample. To extract the photon beam asymmetry according to Eq. 1, a fit of the azimuthal event distribution was performed:
| (2) |
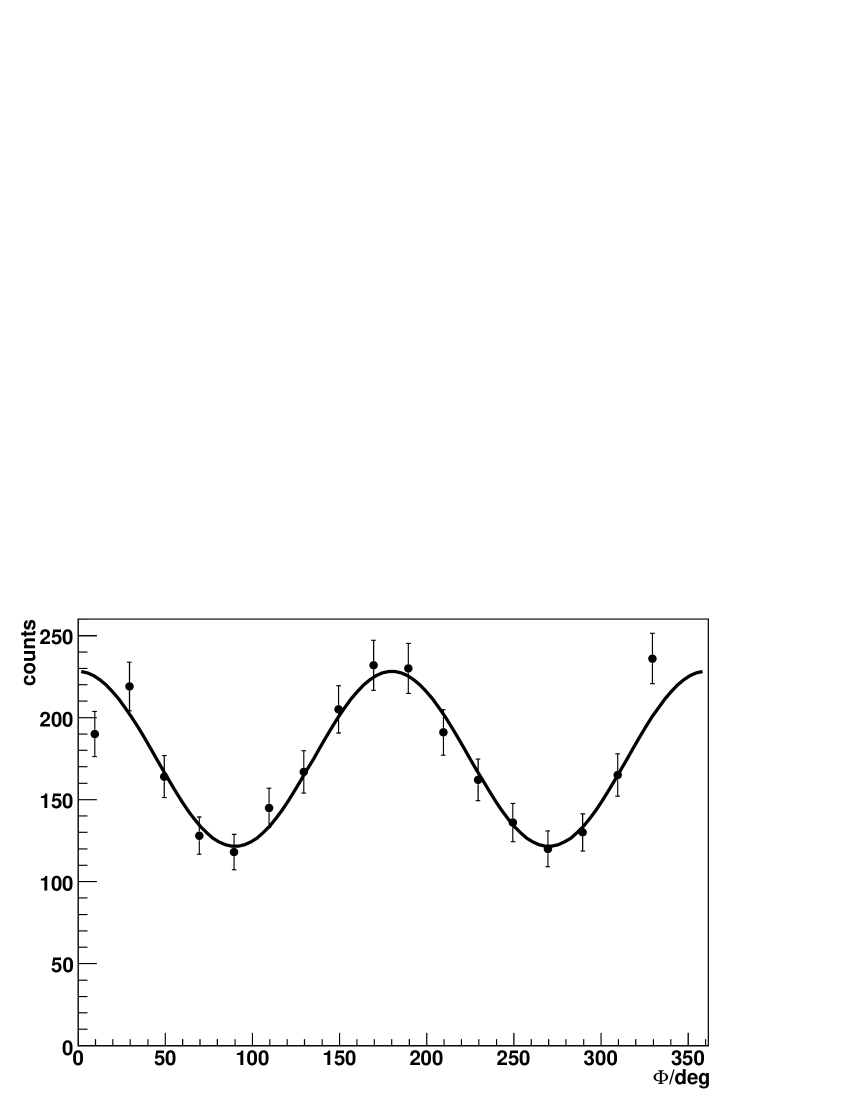
An example for one bin in and is shown in Fig. 5. The ratio of the fit determines the product of beam asymmetry and photon polarisation, , of Eq. 1. Since there is a strict relation between the photon energy and the photon polarisation (c.f. Fig. 2), and the appropriate photon energy can be assigned to each single event, it is possible to determine the event-weighted average polarisation in each bin of photon energy.
The photon asymmetries extracted from the and the decay channels agree very well. This is illustrated in Fig. 6 (top) where, as examples, the two photon energy bins MeV (left) and MeV (right) are shown.
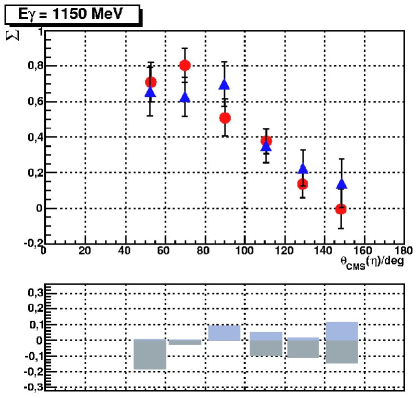
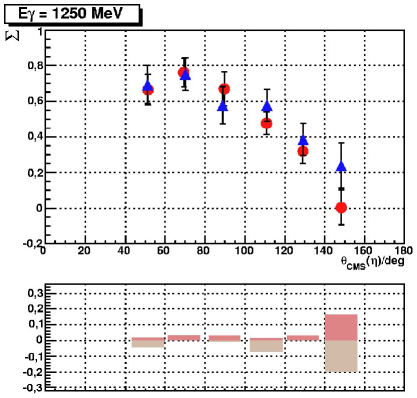
In order to detect possible false detector asymmetries, the uniformity of the event distribution of the laboratory angles versus was routinely inspected Elsner06 . Most detected problems could be removed in the offline analysis. Other sources of false asymmetries were identified but could not be completely remedied, e.g. trigger inefficiencies within certain angular regions. In such bins the corresponding –regions were excluded from the fit of Eq. 2. The remaining systematic error is estimated through the difference of separate fits of the 0 — 180 and 180 — 360 degree azimuthal regions to the full fit. The differences are shown as the bar graphs on the bottom of Fig. 6, left in the , right in the decay of the meson. Note that these estimates are correlated with the statistical errors.
It turned out that the angle dependent inefficiencies provide by far the major contribution to the systematic error of this experiment. In contrast, the remaining uncertainty of the beam polarisation affects the final result much less, and the effect of the background subtraction is almost negligible. The total error remains, however, still dominated by statistics as can also be seen from the table of results in the appendix.
4 Results and discussion
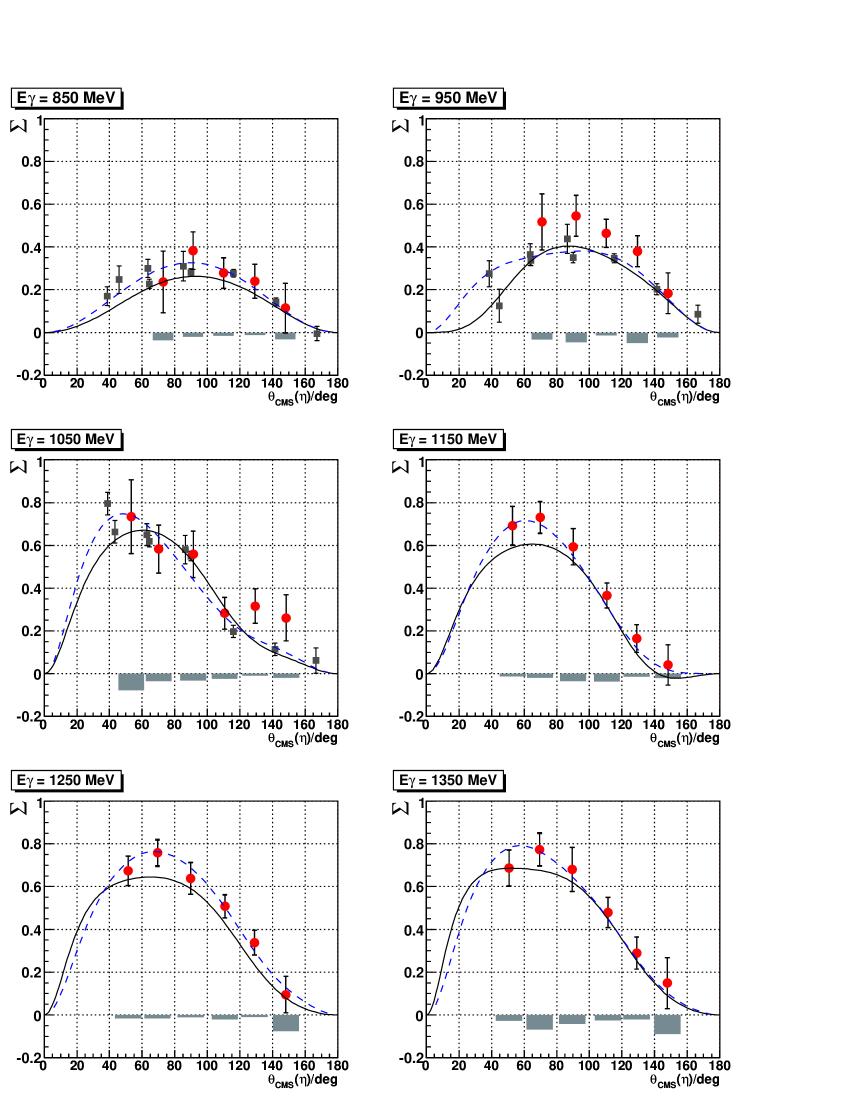
The combined results of the and data sets are presented in Fig. 7. Statistical errors are directly attached to the data points. Since determined from the of the fit of Eq. 2, these statistical errors may still carry some correlation to systematics. The estimated total systematic uncertainty is indicated by the bars.
Nice agreement is found with the published GRAAL data of Ajaka et al. Ajaka98 . This provides confidence that the analysis chain is well under control on the level of the presented errors, in particular the determination of the degree of linear polarisation and the extraction of the azimuthal asymmetries, the latter despite the fact that, due to the unfavourable horizontal beam emittance, no data were taken with the polarisation plane rotated by 90 degrees, as was done by the GRAAL collaboration.
More recent but yet preliminary (and hence here not shown) data of the GRAAL collaboration, extended in energy up to 1445 MeV Kouznetsov02 , do also nicely agree with our data.
In Fig.7 our new data are compared to two standard calculations, the Mainz isobar model eta-MAID CYTD02 and the Bonn–Gatchina partial wave analysis BnGa Anisovich05 .
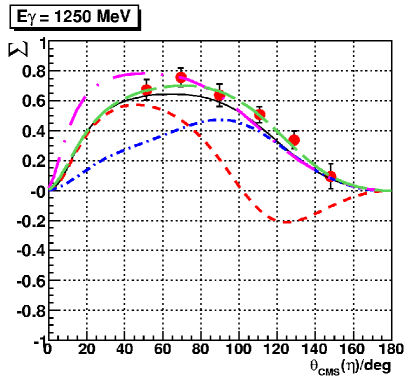
In contrast to eta-MAID, the Bonn–Gatchina analysis in addition to also takes the , and coupled channels into account. To calculate the photon asymmetry, the preliminary high energy GRAAL data Kouznetsov02 have already been used in the BnGa fit. This might be the reason for the slightly better description of our data.
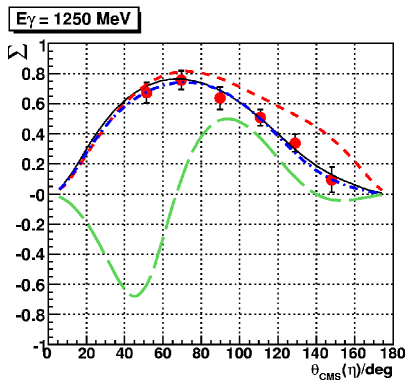
The overall agreement between data and both models seems very satisfactory at first glance. Closer examination reveals distinct inconsistencies, however. While the full model results agree, the individual resonance contributions differ substantially as is illustrated in Fig. 8.
Within the energy range considered, the tail of the state provides an important contribution to the cross section in both models. In eta-MAID the is required as well to describe the cross section, whereas the BnGa PWA prefers a strong partial wave. This also shows up in the photon asymmetry. The (long dashed-dotted) affects in eta-MAID, albeit weakly. No impact at all is found in the BnGa PWA. In contrast, the influence of the (long dashed) on the photon asymmetry is pronounced only in the BnGa model. Within eta-MAID, turning off the leaves the photon asymmetry almost unaffected. Both the (short dashed) and (short dashed-dotted) states have a strong influence on within eta-MAID. Contrary, the remains negligible in the BnGa calculation; the has a weak impact but, compared to eta-MAID, in opposite direction (cf. Fig. 8).
This unsatisfactory situation can not be resolved from measurements of the photon asymmetry alone. Yet, such data provide the necessary basis to be extended with double polarisation observables in order to get closer to, or even accomplish the complete experiment in terms of the introductory discussion.
5 Summary and conclusions
In summary, we have presented data on the photon beam asymmetry, , in the reaction . The continuous GeV ELSA electron beam was used to produce a linearly polarised tagged photon beam by means of coherent bremsstrahlung off a diamond crystal, covering a photon energy range MeV with polarisation degrees up to 49 %. A combined setup of the Crystal Barrel and TAPS detectors enabled high-resolution detection of multiple photons, important for the clean detection of the and decays of the meson. We obtained photon asymmetries in excess of 50 % in some angular and energy bins. The results are in agreement with a previous measurement by the GRAAL collaboration in the overlapping energy intervals. The eta-MAID model and the Bonn–Gatchina partial wave analysis provide a satisfactory overall description of our data. In detail, however, there are marked differences with regard to the role of individual resonance contributions. To resolve this problem, further double-polarisation experiments are indispensable. They will be tackled at several laboraties, at ELSA within the Collaborative Research Project SFB/TR-16 with use of the Bonn polarised solid state target.
Acknowledgements.
We are happy to acknowledge the continuous efforts of the accelerator crew and operators to provide stable beam conditions. K. Livingston from Glasgow university deserves a big share of credit for his invaluable help in setting up the Stonehenge technique for the crystal alignment. This work was financially supported by the federal state of North Rhine-Westphalia and the Deutsche Forschungsgemeinschaft within the SFB/TR-16. The Basel group acknowledges support from the Schweizerischer Nationalfonds, the KVI group from the Stichting voor Fundamenteel Onderzoek der Materie (FOM) and the Nederlandse Organisatie voor Wetenschappelijk Onderzoek (NWO).Appendix
The detailed results of the photon asymmetries, , from the reaction are summarised in Table 1. To each value of the photon asymmetry is assigned the corresponding 1- statistical error and an 1- estimate of the total systematical error.
| energy bin 850 MeV | energy bin 950 MeV | ||||||||
| Eγ/MeV | Eγ/MeV | ||||||||
| 843.4 | 72.9 | 0.237 | 0.145 | 0.036 | 942.8 | 70.9 | 0.517 | 0.131 | 0.033 |
| 842.6 | 91.2 | 0.382 | 0.087 | 0.020 | 939.7 | 91.9 | 0.546 | 0.095 | 0.045 |
| 846.4 | 109.9 | 0.278 | 0.071 | 0.015 | 941.7 | 110.3 | 0.465 | 0.065 | 0.013 |
| 847.5 | 129.2 | 0.240 | 0.079 | 0.012 | 943.6 | 129.4 | 0.380 | 0.072 | 0.049 |
| 850.5 | 147.9 | 0.114 | 0.116 | 0.031 | 943.8 | 148.2 | 0.184 | 0.095 | 0.023 |
| energy bin 1050 MeV | energy bin 1150 MeV | ||||||||
| Eγ/MeV | Eγ/MeV | ||||||||
| 1054.0 | 53.3 | 0.734 | 0.172 | 0.077 | 1154.4 | 52.9 | 0.692 | 0.090 | 0.013 |
| 1051.2 | 70.1 | 0.583 | 0.111 | 0.035 | 1151.5 | 69.8 | 0.731 | 0.072 | 0.019 |
| 1046.0 | 91.4 | 0.559 | 0.108 | 0.032 | 1150.2 | 90.1 | 0.593 | 0.084 | 0.036 |
| 1045.9 | 110.6 | 0.283 | 0.074 | 0.023 | 1151.4 | 110.7 | 0.366 | 0.058 | 0.037 |
| 1043.0 | 129.4 | 0.316 | 0.080 | 0.010 | 1150.0 | 129.0 | 0.165 | 0.064 | 0.014 |
| 1043.3 | 148.4 | 0.261 | 0.107 | 0.019 | 1148.5 | 148.2 | 0.041 | 0.095 | 0.020 |
| energy bin 1250 MeV | energy bin 1350 MeV | ||||||||
| Eγ/MeV | Eγ/MeV | ||||||||
| 1251.4 | 51.5 | 0.674 | 0.068 | 0.016 | 1344.7 | 50.7 | 0.687 | 0.083 | 0.027 |
| 1249.3 | 69.4 | 0.758 | 0.060 | 0.017 | 1343.5 | 69.4 | 0.774 | 0.075 | 0.069 |
| 1249.0 | 89.8 | 0.638 | 0.073 | 0.012 | 1342.4 | 89.4 | 0.680 | 0.102 | 0.043 |
| 1249.5 | 110.7 | 0.508 | 0.053 | 0.021 | 1342.6 | 111.3 | 0.479 | 0.070 | 0.026 |
| 1249.5 | 129.0 | 0.338 | 0.058 | 0.010 | 1343.4 | 129.0 | 0.290 | 0.075 | 0.021 |
| 1250.0 | 148.2 | 0.095 | 0.085 | 0.076 | 1343.1 | 147.9 | 0.149 | 0.119 | 0.089 |
References
- (1) see e.g. S. Capstick and W. Roberts, Prog. Part. Nucl. Phys. 45 (2000) 241
- (2) U. Löring et al., Eur. Phys. J. A10 (2001) 395, 447
- (3) A.C. Kalloniatis, D.B. Leinweber, A.G. Williams (Eds.), “Lattice Hadron Physics”, Lecture Notes in Physics 663, Springer (2005)
- (4) S. Capstick and W. Roberts, Phys. Rev. D 49 (1994) 4570
- (5) V. Crede et al., Phys. Rev. Lett. 94 (2005) 012004
- (6) B. Saghai and Z. Li, Proceedings of the Workshop on the Physics of excited Nucleons, Pittsburgh (2002), ed. by S.A. Dytman and E.S. Swanson (World Scientific, 2003), p. 166
- (7) G.Y. Chen eta al., Nucl. Phys. A723 (2003) 447
- (8) W.-T. Chiang and F. Tabakin, Phys. Rev. C55 (1997) 2054
- (9) G. Knöchlein, D. Drechsel and L. Tiator, Z. Phys. A352 (1995) 327
- (10) E. Aker et al., Nucl. Instr. Meth. A321 (1992) 69
- (11) B. Krusche et al., Phys. Rev. Lett. 74 (1995) 3736
- (12) F. Renard et al., Phys. Lett. B528 (2002) 215
- (13) M. Dugger et al., Phys. Rev. Lett. 89 (2002) 22202 and 249904(E)
- (14) C. A. Heusch et al., Phys. Rev. Lett. 25 (1970) 1381
- (15) A. Bock et al., Phys. Rev. Lett. 81 (1998) 534
- (16) J. Ajaka et al., Phys. Rev. Lett. 81 (1998) 1797
- (17) V. Kouznetsov et al., PIN Newsletter 16 (2002) 160
- (18) R. Thompson et al., Phys. Rev. Lett. 86 (2001) 1702
- (19) W. Hillert, Eur. Phys. J. A28, s01 (2006) 139
- (20) U. Timm, Fortschritte der Physik 17 (1969) 765
- (21) D. Elsner, doctoral thesis, Bonn (2006)
- (22) F.A. Natter et al., Nucl. Instr. Meth. B211 (2003) 465
- (23) L.I. Schiff, Phys. Rev. 83 (1951) 252
- (24) J.H. Hubbell, J. Appl. Phys. 30 (1959) 981
- (25) B. Kopf, doctoral thesis, Dresden (2002)
- (26) G. Suft et al., Nucl. Instr. Meth. A538 (2005) 416
- (27) R. Novotny et al., IEEE transaction on nuclear science 38 (1991) 378
- (28) A.R. Gabler et al., Nucl. Instr. Meth. A346 (1994) 168
- (29) H. Flemming, doctoral thesis, Bochum (2000)
-
(30)
W.T. Chiang, S.N. Yang, L. Tiator, D. Drechsel,
Nucl. Phys. A700 (2002) 429;
see also http://www.kph.uni-mainz.de/MAID/maid.html - (31) A.V. Anisovich et al., Eur. Phys. J. A25 (2005) 427