Study of the 12C+12C fusion reactions near the Gamow energy
Abstract
The fusion reactions 12C(12C,)20Ne and 12C(12C,p)23Na have been studied from to 4.75 MeV by -ray spectroscopy using a C target with ultra-low hydrogen contamination. The deduced astrophysical factor exhibits new resonances at MeV, in particular a strong resonance at MeV, which lies at the high-energy tail of the Gamow peak. The resonance increases the present non-resonant reaction rate of the channel by a factor of 5 near K. Due to the resonance structure, extrapolation to the Gamow energy MeV is quite uncertain. An experimental approach based on an underground accelerator placed in a salt mine in combination with a high efficiency detection setup could provide data over the full energy range.
pacs:
24.30.-v, 26.20.+f, 27.20.+tThe fusion reactions 12C(12C,)20Ne ( MeV) and 12C(12C,p)23Na ( MeV) are referred to as carbon burning in stars, following the hydrogen and helium burning stages. These reactions represent key processes in nuclear astrophysics since they influence not only the nucleosynthesis of 20Ne and 23Na but also the subsequent evolution of a star, e.g. whether a star evolves into a carbon detonation supernova or not C.Rolfs and W.S.Rodney (1988). Thus, the cross section of these reactions must be known with high accuracy down to the Gamow energy MeV for a temperature of K C.Rolfs and W.S.Rodney (1988). Previous experiments obtained useful data over a wide range of energies down to the center-of-mass energy MeV using charged-particle or -ray spectroscopy J.R.Patterson et al. (1969); H.Spinka and H.Winkler (1974); M.G.Mazarakis and W.E.Stephens (1973); K.U.Kettner et al. (1977); M.D.High and B.Cujec (1977); H.W.Becker et al. (1981); E.F.Aguilera et al. (2006). However, below MeV the reported cross sections are rather uncertain, because at these energies the presence of 1H and 2H contamination in the C targets hampered the measurement of the 12C+12C processes in both particle and gamma ray studies. For example, in -ray spectroscopy the transitions from the first excited state in 20Ne ( keV) and 23Na ( keV) were normally the prominent lines in the gamma spectra, but at low energies their observation suffered from an intense background from the MeV line from 1H(12C,)13N and the MeV line from 2H(12C,p)13C. Thus, improved studies require C targets with an ultra-low hydrogen contamination. The present work reports on such studies by -ray spectroscopy.
The 4 MV Dynamitron tandem at the Ruhr-Universität Bochum provided the 12C beam (2+ charge state) with up to 40 particle A on target at low beam energies. The energy calibration and the energy spread of the beam are known to better than 3 keV, and equal to 2 keV, respectively S.Wüstenbecker et al. (1989); T.Spillane (2007, to be published). The purity of the C beam is known to be better than 10-11, for O and other light ions D.Rogalla et al. (1999). The beam passed through a Ta collimator (diameter = 4 mm, distance to target = 60 cm, with a suppression voltage of 200 V for secondary electrons) and was stopped at the C target: a graphite foil of natural isotopic composition, with a 1.0 mm thickness, a mm2 area, and a purity of 99.8%; obtained from Goodfellow. The target was mounted on a stainless steel conflat flange. The conflat beam pipe (diameter = 4 cm, length = 30 cm) and the target holder were electrically insulated from the upstream beam pipe; they formed the Faraday cup for beam integration, with an estimated error of 3%. Visual inspection showed that the beam spot on target had a diameter of about 6 mm. A Ge gamma detector was placed at 0∘ to the beam axis (115% relative efficiency, resolution = 2.4 keV at MeV, front face distance to the target = 2 cm) with an absolute efficiency of and for the 440 and 1634 keV -rays, respectively, as deduced from calibrated -ray sources placed at the target position T.Spillane (2007, to be published). The setup was surrounded by a 15 cm thick lead shield to suppress the room background by a factor of about 400 near MeV. Finally, a plastic scintillator (thickness = 4 cm, area = cm2) was used to veto cosmic-ray induced events in the detector: a factor of 2 additional reduction in background near MeV.

The intense 12C beam heated the target to an estimated temperature of 700∘C (using a setup described in F.Raiola et al. (2005)) and we observed - within about 20 minutes of bombardment - a decrease of the hydrogen contamination in the target to a negligible level. The spectra are dominated by the lines of interest at 440 and 1634 keV (Fig. 1). The lines show a significant Doppler broadening due to the relatively long slowing-down time of the 20Ne and 23Na recoils in the infinitely thick C target, while this broadening was nearly absent in previous work K.U.Kettner et al. (1977) due to the faster slowing-down time in the Ta backing of the thin C targets. At the higher energies one observes also the 451 keV -ray from 12C(12C,n)23Mg, sufficiently resolved from the 440 keV line (Fig. 1). Finally, the proton channel populating the 2076 keV state in 23Na can contribute to the intensity of the 1634 keV line by the 91% P.M.Endt (1990) branching keV ( keV), but this feeding can be monitored via the concurrent 9% keV branching; from this monitoring the contribution of this proton channel to the 1634 keV line turned out to be negligible (less than 4%).

The -ray yields of the 440 and 1634 keV lines as a function of beam energy represent a sizable fraction of the total fusion yield (including the and p0 channels), with a mean value of and for the and p channel as observed at MeV H.W.Becker et al. (1981), respectively. We used these mean values in our analyses at all energies. It was also found that the two -rays exhibit nearly isotropic angular distributions K.U.Kettner et al. (1977), a feature adopted by us.
The reaction yield of the infinitely thick C target, , was obtained in several runs from to 4.75 MeV, with energy steps of to 25 keV: , where is the number of counts for the relevant -rays and is the number of 12C projectiles on target. In order to arrive at a thin-target yield curve, , the thick-target yield curve was differentiated, i.e. the yield difference between two adjacent points and ) was calculated. The result is , where is the effective energy over the step C.Rolfs and W.S.Rodney (1988), and is the stopping power H.Andersen and J.F.Ziegler (1977) with a quoted error of 4.6% (e.g. eV cm2 atom-1 at MeV). The present technique avoids the previous problems of target deterioration and/or carbon deposition that occur when using thin C targets, as discussed in E.F.Aguilera et al. (2006). In the analysis of the 440 and 1634 keV lines at low beam energies, we subtracted a background spectrum (with the beam off, taken over a running time of 5 days, Fig. 1) from the spectrum obtained with the beam on target; an example is shown in Fig. 2.
When a C target was bombared with more than 15 Coulomb, we observed an increase in the 440 keV -ray flux by about a factor of 10 at low beam energies. Visual inspection of the target showed that the beam had sputtered a 1 mm diameter hole in the C foil and was thus stopped partially in the stainless steel flange producing a 440 keV line probably due to Coulomb excitation of 23Na present in the steel (see also below). For this reason, we changed the C foil after a beam charge of about 7 Coulomb. Measurements with different beam currents (factor of 5) at higher energies led to the same reaction yields within experimental error indicating that the beam current has a negligible influence on the stopping power.
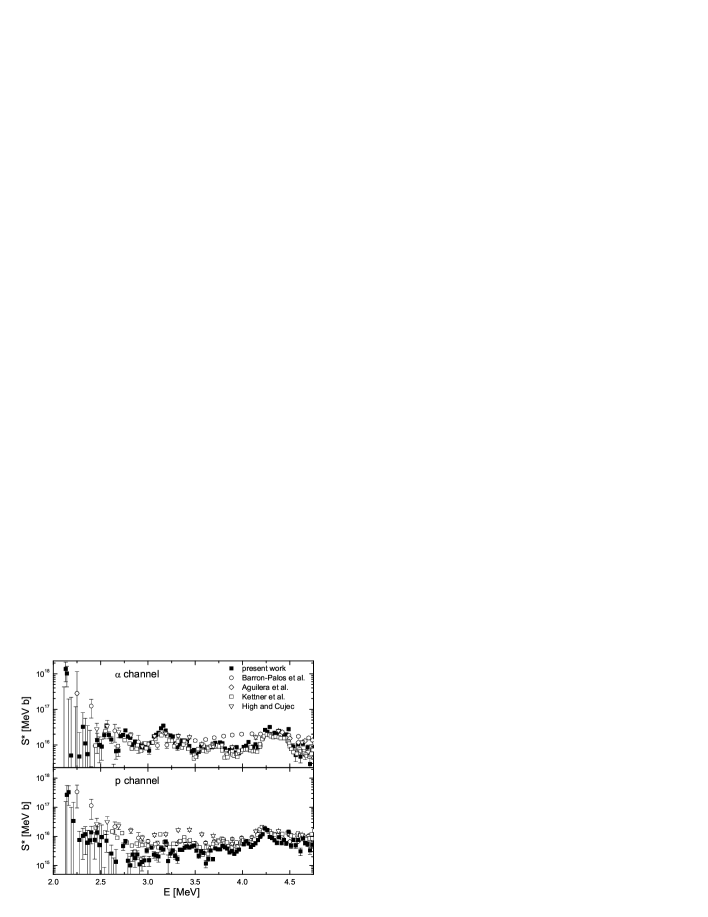
The resulting cross sections ), i.e. the weighted average of several runs, are illustrated in Fig. 3 in form of the modified astrophysical factor C.Rolfs and W.S.Rodney (1988); J.R.Patterson et al. (1969); H.Spinka and H.Winkler (1974); M.G.Mazarakis and W.E.Stephens (1973); K.U.Kettner et al. (1977); M.D.High and B.Cujec (1977); H.W.Becker et al. (1981); E.F.Aguilera et al. (2006),
with E in units of MeV (for the numerical values, see T.Spillane (2007, to be published)). The errors shown are mainly of statistical origin in the differentiation method (see above). The cross section at the lowest energies is below 0.8 nb. Screening effects of the atomic electrons with keV H.J.Assenbaum et al. (1987) lead to a cross section enhancement of 8% at MeV and have thus been neglected.

The data exhibit a pronounced resonance structure down to our low-energy limit, where a strong resonance is found at keV (width keV) with strengths and meV for the and p channel, respectively, as deduced from the step in the thick-target yields at this resonance (Fig. 4): C.Rolfs and W.S.Rodney (1988), where is the DeBroglie wavelength. The quoted errors are mainly of statistical origin, and include the uncertainties of , , , and in quadratures (15%). The resonances are superimposed on a flat background. The average non-resonant value at the lowest energies for both channels is about MeV b. In the compilation of Caughlan and Fowler G.R.Caughlan and W.A.Fowler (1988) a value of MeV b for both channels has been recommended, as an approximative average over the resonance structures from to 6.5 MeV J.R.Patterson et al. (1969); H.Spinka and H.Winkler (1974); H.W.Becker et al. (1981).
The reaction rate per particle pair for the non-resonant plus resonant parts is given by the expression (e.g. chapter 4 in C.Rolfs and W.S.Rodney (1988))
with and , where the temperature is in units of 106 K, is in units of keV b, and and ER are in units of keV. The 2.14 MeV resonance increases the -channel non-resonant rate of the present work by a factor of 5 near , and a factor of 2 with respect to G.R.Caughlan and W.A.Fowler (1988). The present rate of the p channel is lower by a factor of 4 with respect to G.R.Caughlan and W.A.Fowler (1988). Astrophysical consequences of the new rates have to await the results of stellar model calculations. However, since there is a resonance at nearly every 300 keV energy step, it is quite likely that a resonance exists near the center of the Gamow peak. Thus, the above rates remain quite uncertain; they represent lower limits to the true rates near the Gamow energy.
The energy dependence of the present data in the overlapping energy range is in good agreement with previous results (Fig. 3), except for the proton channel at energies MeV (see below). A recently E.F.Aguilera et al. (2006) suggested energy shift of the data of K.U.Kettner et al. (1977) by keV is not confirmed by the present measurements.
After the completion of the present work, similar studies have been reported down to MeV in energy steps of to 250 keV L.Barron-Palos et al. (2006). In this work, the problem of hydrogen contamination in the target was not solved. Using a 1 mm thick graphite target the thick-target yield curve was parametrized using a polynomial function for the cross section, whereby the resonance structures were washed out (Fig. 3). The authors presented the data in the form of the usual factor and not as the modified factor, , where , as has been customary for most of the previous studies. Presented as the factor, the factor increases at low energies in all studies. If the data of L.Barron-Palos et al. (2006) are presented as the modified factor, their energy dependence leads to a flat curve. The possible exceptions are the data points for the proton channel at energies MeV L.Barron-Palos et al. (2006) (Fig. 3), where the higher values could be due to Coulomb excitation of 23Na e.g. created in the stainless steel collimator near the target. A similar problem for the p channel has existed probably in the low-energy data of previous work K.U.Kettner et al. (1977); H.W.Becker et al. (1981) (Fig. 3), i.e. a thin C target on a Ta backing, as pointed out already in K.U.Kettner et al. (1977). Thus, one may consider these older data at MeV for the proton channel as upper limits.
The C+C fusion reactions are an excellent case for experimental studies with a future underground facility, such as a 3 MV high-current, single-stage accelerator with an ECR ion source. Measurements in the salt mine Slanic Prahova (Romania, depth = 208 m) showed that the unshielded natural background near the 1634 keV -ray is reduced by a factor of 50 compared to our present shielded setup in Bochum. Even with an unshielded, but improved detection system such as a Ge crystal ball, a beam current of 200 particle A, and long running times, it appears possible to perform measurements over the energy range of the Gamow peak.
Acknowledgements.
The authors thank C.A.Barnes (Caltech) for fruitful comments on the manuscript and the Dynamitron Tandem Laboratory (RUBION) for technical and other support.References
- C.Rolfs and W.S.Rodney (1988) C.Rolfs and W.S.Rodney, Cauldrons in the Cosmos (University of Chicago Press, 1988).
- J.R.Patterson et al. (1969) J.R.Patterson et al., Astrophys.J. 157, 367 (1969).
- H.Spinka and H.Winkler (1974) H.Spinka and H.Winkler, Nucl.Phys.A 233, 456 (1974).
- M.G.Mazarakis and W.E.Stephens (1973) M.G.Mazarakis and W.E.Stephens, Phys.Rev.C 7, 1280c (1973).
- K.U.Kettner et al. (1977) K.U.Kettner et al., Phys.Rev.Lett. 38, 337 (1977).
- M.D.High and B.Cujec (1977) M.D.High and B.Cujec, Nucl.Phys.A 282, 181 (1977).
- H.W.Becker et al. (1981) H.W.Becker et al., Z.Phys.A 303, 305 (1981).
- E.F.Aguilera et al. (2006) E.F.Aguilera et al., Phys.Rev.C 73, 064601 (2006).
- S.Wüstenbecker et al. (1989) S.Wüstenbecker et al., Nucl.Instr.Meth.A 279, 448 (1989).
- T.Spillane (2007, to be published) T.Spillane, Thesis (University of Connecticut, Storrs, CT, USA, 2007, to be published).
- D.Rogalla et al. (1999) D.Rogalla et al., Eur.Phys.J. A 6, 471 (1999).
- F.Raiola et al. (2005) F.Raiola et al., Eur.Phys.J. A 31, 1141 (2005).
- P.M.Endt (1990) P.M.Endt, Nucl.Phys. A 521, 1 (1990).
- H.Andersen and J.F.Ziegler (1977) H.Andersen and J.F.Ziegler, The Stopping and Ranges of Ions in Matter (Pergamon, New York, 1977), eprint and SRIM-2003.
- H.J.Assenbaum et al. (1987) H.J.Assenbaum et al., Z.Phys.A 327, 461 (1987).
- G.R.Caughlan and W.A.Fowler (1988) G.R.Caughlan and W.A.Fowler, Atomic Nucl.Data Tables 40, 283 (1988).
- L.Barron-Palos et al. (2006) L.Barron-Palos et al., Nucl.Phys. A 779, 318 (2006).